
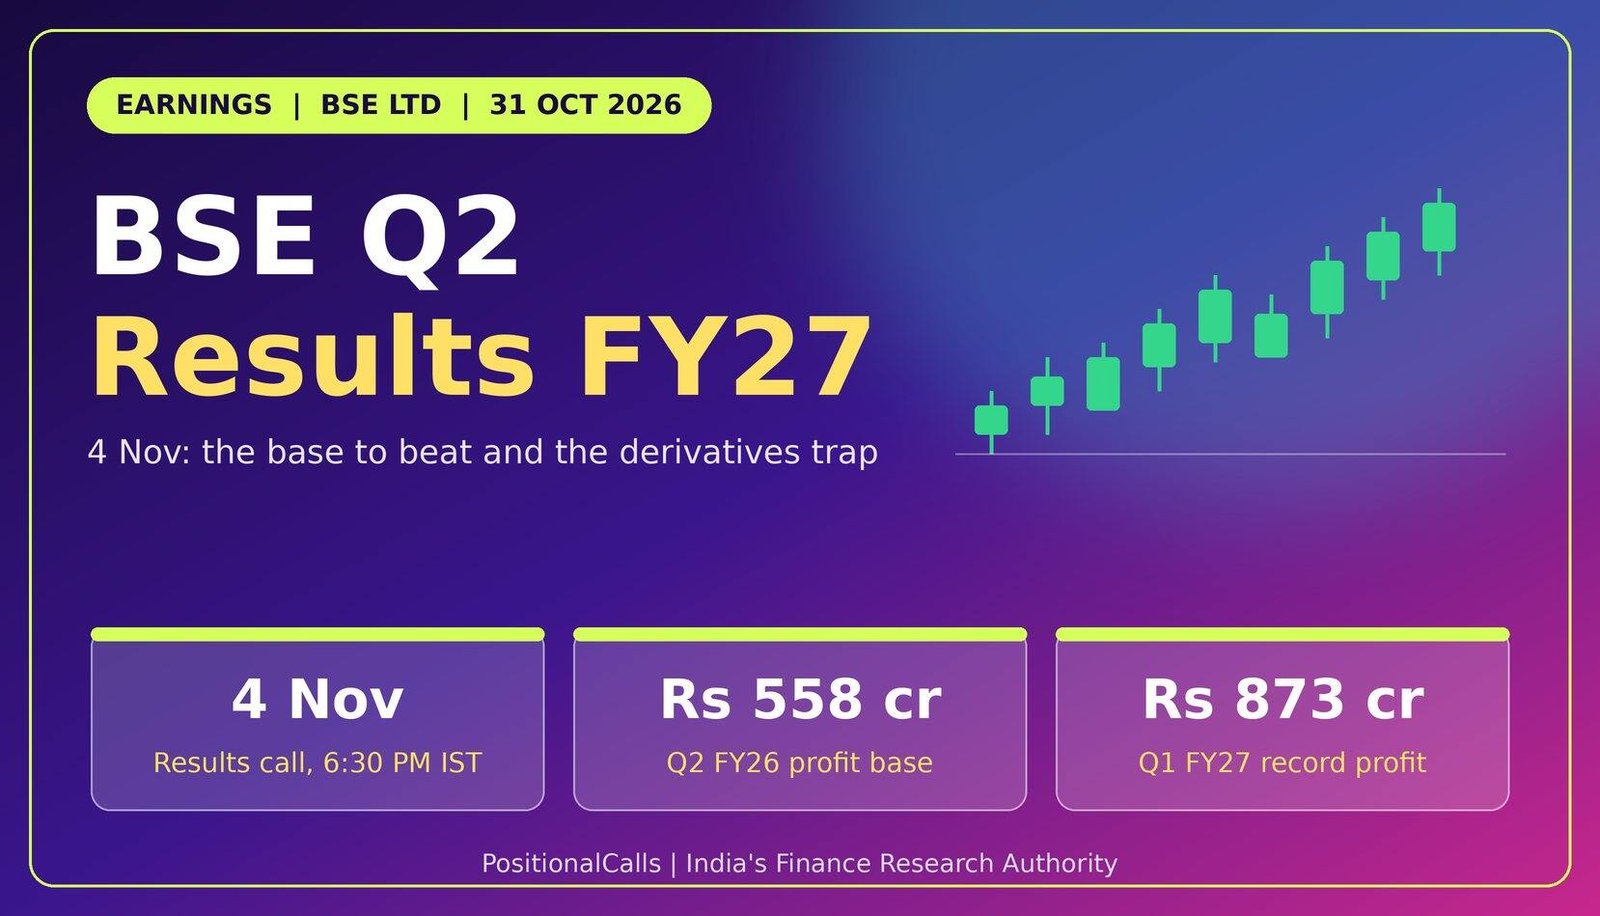
Earnings · BSE
BSE reports its September quarter on 4 November 2026. Here is the base, the record Q1 it must follow, five versions of “revenue” and “EBITDA” that confuse readers, and what drives an exchange’s profit.
Quick answer
BSE Q2 results FY27 are due on Wednesday, 4 November 2026, when the exchange operator holds its results call at 6:30 PM IST. The base to beat is Rs 558 crore profit on Rs 1,068 crore operating revenue in Q2 FY26. Q1 FY27 set a record at Rs 873 crore. No Q2 estimate was found as of 31 October 2026.
Latest update (31 October 2026, 1:30 PM IST): BSE has scheduled its Q2 FY27 results conference call for Wednesday, 4 November 2026 at 6:30 PM IST, per an intimation dated 27 October 2026 as reported. No Q2 numbers are out. This page converts into the results analysis on the day.
Key takeaways
- Date: results call on Wednesday, 4 November 2026, 6:30 PM IST.
- Base (Q2 FY26): operating revenue Rs 1,068 crore (+44%), operating EBITDA Rs 680 crore (64%), profit Rs 558 crore (+61%).
- Bar set by Q1 FY27: revenue from operations Rs 1,566 crore (+63%), operating EBITDA Rs 1,046 crore, profit Rs 873 crore (+62%).
- Trap: Q1 FY27 revenue appears as Rs 1,566, 1,707 and 1,726 crore; know the line.
- Estimates: none found for Q2 FY27.
In plain words: BSE (Bombay Stock Exchange) earns when people trade, list shares and use its data. Most of its profit now comes from transaction charges on derivatives. A “base to beat” is last year’s same quarter. EBITDA is operating profit before interest, tax, depreciation and amortisation.
Data note: as of 31 October 2026, 1:30 PM IST. Figures come from BSE results as carried by Business Standard, Kotak Neo, brokerage notes and aggregators; I have not opened the company’s results filings. Reports differ on revenue, EBITDA and profit lines, so each is labelled. Derived numbers are marked “my calculation”.
When will BSE announce its Q2 FY27 results?
BSE has scheduled its Q2 FY27 results call for Wednesday, 4 November 2026 at 6:30 PM IST; confirm the board meeting and filing time in the exchange announcement.
The call was intimated on 27 October 2026, as reported. One older calendar page lists a board meeting on 3 November, but that entry is stale and conflicts with the call date, so treat 4 November as the working date until the filing confirms it. Last year BSE reported Q2 on Tuesday, 11 November 2025, a week later, and Q1 FY27 on Tuesday, 4 August 2026.
Several other large results fall in the same window. See SBI Q2 results FY27 (reported for Tuesday, 3 November 2026), Apollo Hospitals Q2 results FY27 (also 4 November) and Hindalco Q2 results FY27 (6 November). The Q2 results calendar hub lists all dates.
What is the base to beat in the BSE Q2 results FY27?
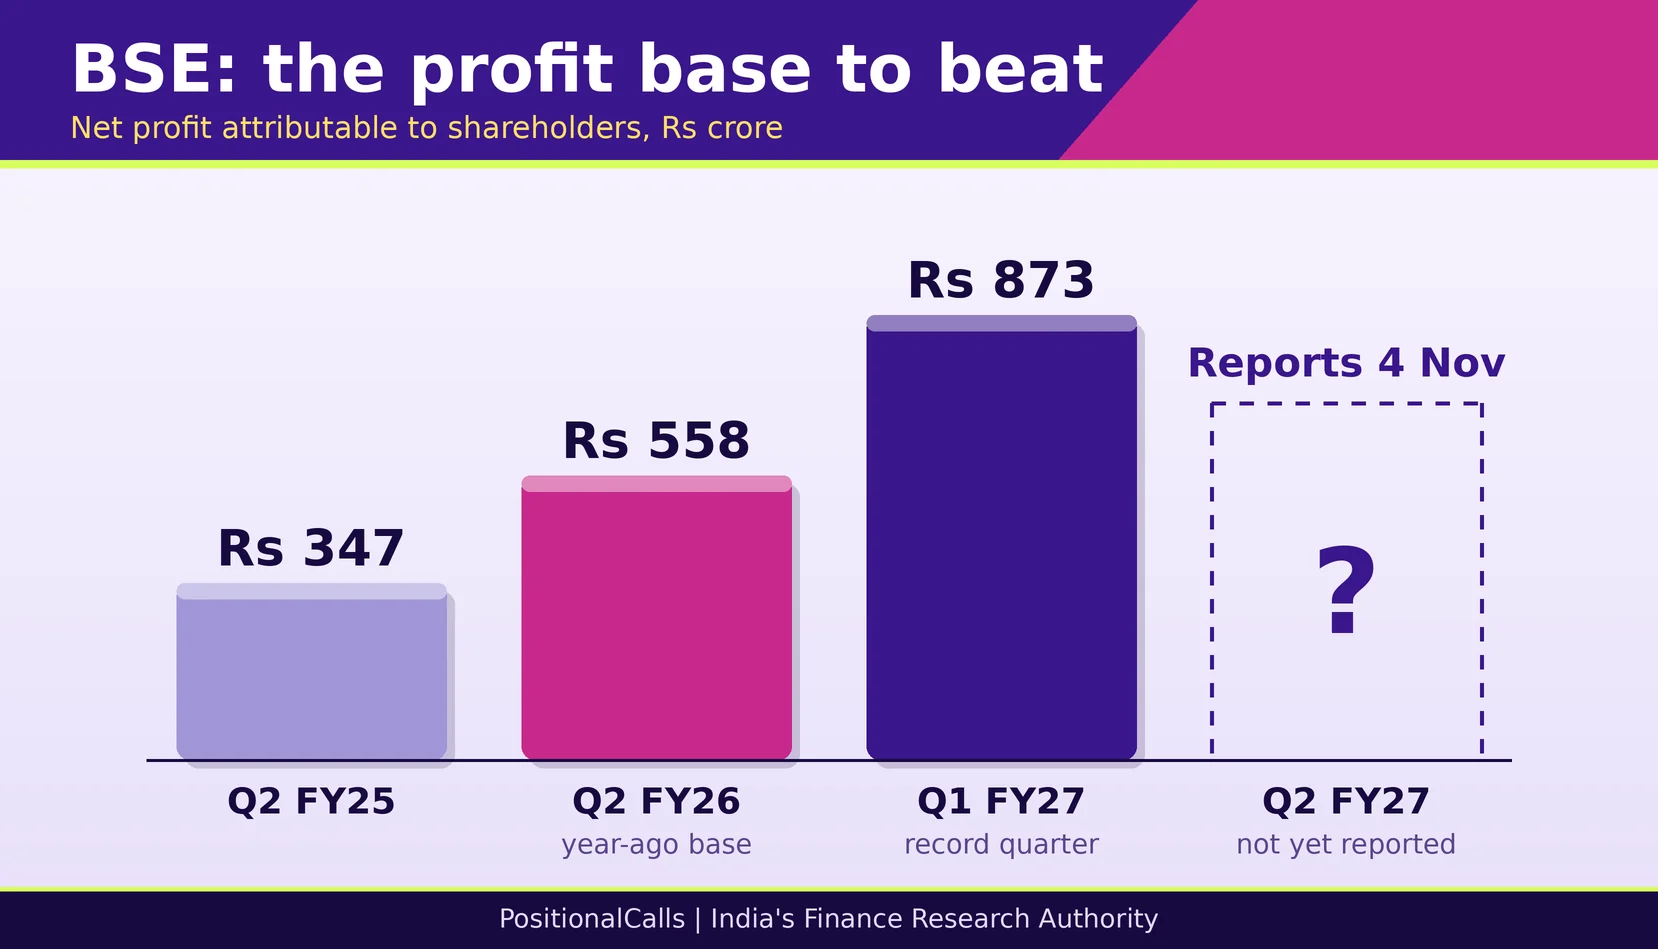
The Q2 FY26 base is operating revenue of Rs 1,068 crore, operating EBITDA of Rs 680 crore at a 64% margin and net profit attributable to shareholders of Rs 558 crore, up 61% from Rs 347 crore.
| Consolidated, Rs crore | Q2 FY25 | Q2 FY26 (base) | Change | Why it matters |
|---|---|---|---|---|
| Operating revenue | 741 | 1,068 | +44% | Core exchange income |
| Total revenue (incl. investment and other income) | about 814 (derived) | 1,139 | +40% | Call headline |
| Operating EBITDA | about 386 (derived) | 680 | +76% (my calculation) | Margin rose to 64% |
| Operating EBITDA margin | 52% | 64% | +12 points | Operating leverage |
| Net profit attributable to shareholders | 347 | 558 | +61% | The base for growth rates |
| Profit before tax | 457 | 739 | +62% | Before tax of about Rs 180 crore |
Cite this table: PositionalCalls, “BSE Q2 FY26 Base-to-Beat Table, as of 31 October 2026”.
The “derived” figures work backward from reported margins and growth rates and are rounded. Operating EBITDA of Rs 680 crore on operating revenue of Rs 1,068 crore gives 63.7% (my calculation), which the company rounds to 64%. H1 FY26 operating revenue was about Rs 2,030 crore, up 50% year on year, as reported.
Which BSE revenue, EBITDA and profit figure is right? The definitions trap
Name the line before you call a beat or a miss: Q1 FY27 revenue appears as Rs 1,566, 1,707 and 1,726 crore, EBITDA as Rs 1,046, 1,187 and 1,210 crore, and profit growth as +62%, +66% and even +9.7%.
| Line | Figures in circulation | What it likely means | What to do |
|---|---|---|---|
| Q1 FY27 revenue | Rs 1,566 crore; Rs 1,707 crore; Rs 1,726 crore | Revenue from operations; total income incl. other income; a third aggregator line | Use revenue from operations for like-for-like |
| Q1 FY27 EBITDA | Rs 1,046 crore (67%); Rs 1,187 crore; about Rs 1,210 crore (71%) | Operating EBITDA; EBITDA including other income; a brokerage’s definition | Use the company’s operating EBITDA |
| Q1 FY27 net profit | Rs 872.66 crore; Rs 873 crore; Rs 874.02 crore | Rounding and source differences | Quote Rs 873 crore with the source |
| Q1 FY27 profit growth | +62%; +66% (continuing operations); +9.7% | Reported growth; growth excluding discontinued operations; the QoQ figure mislabelled | +9.7% is the quarter-on-quarter rise (872.66 / 795.47, my calculation) |
| Q1 FY26 profit base | Rs 538 crore; Rs 539 crore; Rs 527 crore | Different sources and bases | Use the company call figure |
| Q2 FY26 revenue growth | +44% (company); +31% (one results page) | Different revenue lines | Use the company figure |
Cite this table: PositionalCalls, “BSE Definitions Table, as of 31 October 2026”.
This table is why results-night headlines disagree. A brokerage that adds other income to EBITDA reports a higher margin than the exchange’s operating EBITDA. A profit growth rate that excludes discontinued operations will differ from the headline growth. Before you compare Q2 FY27 with any base, check which of these lines the number uses.
What bar did Q1 FY27 set for BSE?
Q1 FY27 was a record: revenue from operations of Rs 1,566 crore (+63%), operating EBITDA of Rs 1,046 crore (+67%) and net profit of Rs 873 crore (+62%), with a 67% margin and about 51% net margin.
| Consolidated, Rs crore | Q1 FY26 | Q1 FY27 | Change | Note |
|---|---|---|---|---|
| Revenue from operations | 958 | 1,566 | +63% | Transaction charges up about 80%, as reported |
| Total income | 1,044 | 1,707 | +63% | Includes other income |
| Operating EBITDA | 625 | 1,046 | +67% | Margin 65% to 67% |
| Profit before tax | 685 | 1,144 | +67% | Before associates, as reported |
| Net profit attributable to shareholders | 539 | 873 | +62% | Record; EPS Rs 21.22 |
| Net margin (my calculation) | about 56% of operating revenue | about 56% of operating revenue | Flat | 873 / 1,566 = 55.7% |
Cite this table: PositionalCalls, “BSE Q1 FY27 Table, as of 31 October 2026”.
Operating expenses grew about 56% to roughly Rs 520 crore, slower than revenue, which is how margin widened. One report notes that revenue from services to corporates, the listing-linked line, fell about 4% year on year. A brokerage note says about 54% of operating expenses are regulatory fees and clearing and settlement costs, which rise with volume, so costs are not fixed. Q1 net profit also rose 9.7% from Q4 FY26’s Rs 795.47 crore (my calculation).
How does BSE turn Rs 1,566 crore of revenue into Rs 873 crore of profit?
Revenue from operations of Rs 1,566 crore less about Rs 520 crore of operating expenses gives operating EBITDA of Rs 1,046 crore; adding about Rs 141 crore of other income gives the Rs 1,187 crore some sites call EBITDA (my calculations).
| Q1 FY27 bridge, Rs crore | Amount | How derived |
|---|---|---|
| Revenue from operations | 1,566 | Reported |
| Less: operating expenses | about 520 | Reported as about Rs 520 crore (+56%) |
| Operating EBITDA | 1,046 | Reported; 1,566 less 520 (my calculation) |
| Add: other income | about 141 | Aggregator figure |
| EBITDA including other income | about 1,187 | The figure one results page calls EBITDA |
| Less: depreciation, finance cost and other items | about 43 | Balancing figure (my calculation) |
| Profit before tax | 1,144 | Reported |
| Less: tax and other items | about 271 | Balancing figure (my calculation) |
| Net profit attributable to shareholders | 873 | Reported |
Cite this table: PositionalCalls, “BSE Q1 FY27 Profit Bridge, as of 31 October 2026”.
The bridge shows why two EBITDA figures exist: Rs 1,046 crore excludes other income and Rs 1,187 crore includes it. The gap of Rs 141 crore is investment and other income, which is not the exchange’s core business. When Q2 FY27 arrives, rebuild this bridge with the filing’s own lines; the balancing figures here are my approximations.
How have BSE’s last five quarters looked?
Operating profit rose from Rs 625 crore in the June 2025 quarter to Rs 1,046 crore in June 2026, with the biggest step in the March 2026 quarter (aggregator figures).
| Quarter | Operating profit (Rs crore) | Profit before tax (Rs crore) | Note |
|---|---|---|---|
| Jun 2025 (Q1 FY26) | 625 | 713 | Aggregator basis |
| Sep 2025 (Q2 FY26, base) | 680 | 739 | Matches the company figure of Rs 680 crore |
| Dec 2025 (Q3 FY26) | 732 | 795 | Bonus share issue quarter, as reported |
| Mar 2026 (Q4 FY26) | 1,041 | 1,063 | Profit Rs 795.47 crore, as reported |
| Jun 2026 (Q1 FY27) | 1,046 | 1,164 | Aggregator PBT includes other items |
Cite this table: PositionalCalls, “BSE Five-Quarter Run Table, as of 31 October 2026”.
The aggregator’s June 2026 profit before tax of Rs 1,164 crore sits above the Rs 1,144 crore reported elsewhere, likely because it includes associates and other items. Use the company filing for the exact line. The pattern, a step up in the March 2026 quarter and a flat June quarter, shows that Q1 FY27 did not repeat the sharp sequential jump of Q4. Q2 FY27 will show whether activity held.
PositionalCalls WhatsApp channel
BSE results, in plain words
- The base, the record Q1 and the right definitions
- A same-evening summary of the filing
- Corrections flagged openly if numbers change
What drives BSE’s profit, and what changed in 2026?
Transaction charges on derivatives, mainly Sensex index options, drive most of BSE’s profit, so trading volumes, the securities transaction tax and market share decide the quarter.
- Transaction charges: up about 80% in Q1 FY27, the main source of the revenue jump.
- Derivatives share: one report puts BSE’s share of index options near 35% and August 2026 derivatives turnover close to NSE’s. Treat both as single-source.
- Regulation: brokerage notes cite a rise in securities transaction tax in April 2026 and new guidelines on proprietary trading as headwinds to volumes. I have not verified the exact changes.
- Listing income: 13 mainboard IPOs raised Rs 18,348 crore in July 2026, as reported by one source, which supports listing-related income.
- Other lines: StAR MF mutual fund transactions, market data and colocation add smoother income.
The share price reaction has not followed profit. After Q2 FY26 the stock rose as much as 7% intraday on 12 November 2025, as reported. After Q1 FY27 it opened lower despite a record quarter. Profit and price are different questions, and this page covers the profit side.
What does the H1 FY27 arithmetic look like for BSE?
Q1 FY27 already gives H1 operating revenue of Rs 1,566 crore, so even a Q2 equal to Q1 would put H1 revenue up about 54% on the reported Rs 2,030 crore, while H1 profit would be up about 30% if Q2 profit only equals the Rs 558 crore base (my calculations).
| Q2 FY27 operating revenue case | Q2 vs Rs 1,068 cr | H1 FY27 (Rs crore) | H1 vs Rs 2,030 cr |
|---|---|---|---|
| Rs 1,400 crore | +31.0% | 2,966 | +46.1% |
| Rs 1,566 crore (equal to Q1) | +46.6% | 3,132 | +54.3% |
| Rs 1,700 crore | +59.1% | 3,266 | +60.9% |
| Q2 FY27 profit case | Q2 vs Rs 558 cr | H1 FY27 profit (Rs crore) | H1 vs Rs 1,097 cr |
|---|---|---|---|
| Rs 558 crore (flat) | 0% | 1,431 | +30.4% |
| Rs 700 crore | +25.4% | 1,573 | +43.4% |
| Rs 873 crore (equal to Q1) | +56.5% | 1,746 | +59.2% |
| Rs 1,000 crore | +79.2% | 1,873 | +70.7% |
Cite this table: PositionalCalls, “BSE H1 FY27 Scenario Tables, as of 31 October 2026”.
Assumptions: H1 FY26 operating revenue of Rs 2,030 crore (reported) and H1 FY26 profit of Rs 1,097 crore, which adds Q1 FY26 profit of Rs 539 crore to Q2 FY26 profit of Rs 558 crore (my calculation). These are arithmetic illustrations, not forecasts.
What is each point of BSE margin worth in rupees?
On Rs 1,566 crore of revenue, one point of operating EBITDA margin is worth about Rs 15.7 crore, so a move from the Q2 FY26 margin of 64% to Q1 FY27’s 67% is worth about Rs 47 crore (my calculations).
| Operating EBITDA margin | EBITDA on Rs 1,566 crore revenue | Reading |
|---|---|---|
| 64% | Rs 1,002 crore | Q2 FY26 margin |
| 67% | Rs 1,049 crore | Q1 FY27 margin (company: Rs 1,046 crore) |
| 70% | Rs 1,096 crore | Illustrative upper case |
Cite this table: PositionalCalls, “BSE Margin in Rupees Table, as of 31 October 2026”.
The revenue figure is Q1 FY27’s, used only to size the effect. For an exchange, margin moves less than for most businesses because costs are partly volume-linked, so revenue growth matters more than margin.
Is there an analyst estimate for BSE Q2 FY27?
No Q2 FY27 profit estimate was found as of 31 October 2026, so compare the result with the Rs 558 crore base and with Q1’s Rs 873 crore.
I looked for brokerage previews and found only an older consensus snapshot on an aggregator, which I have not used because it was out of date. A brokerage note after Q1 FY27 trimmed its FY27 operating revenue estimate by about 0.8% for regulatory changes, but gave no Q2 figure that I could verify. When a preview appears this page will show its source, date and base.
How should you read the BSE filing on results day?
Read operating revenue and operating EBITDA on the company’s definition first, then transaction charges, then the services-to-corporates line and costs.
| What to read | Mark to compare | Question to ask |
|---|---|---|
| Operating revenue | Rs 1,068 crore (Q2 FY26); Rs 1,566 crore (Q1 FY27) | Is growth coming from transaction charges? |
| Operating EBITDA and margin | Rs 680 crore (64%); Rs 1,046 crore (67%) | Did the margin hold above 64%? |
| Net profit | Rs 558 crore; Rs 873 crore | Which profit line does the headline use? |
| Services to corporates | Down about 4% in Q1 FY27 | Did listing income recover? |
| Clearing, settlement and regulatory costs | About 54% of operating expenses (brokerage note) | Did costs outpace revenue? |
| Other income | Rs 141 crore in Q1 FY27 (aggregator) | How much of profit is non-operating? |
Cite this table: PositionalCalls, “BSE Results-Day Decoder, as of 31 October 2026”.
Which capital-market results are near BSE’s?
The rival exchange and brokers move with the same trading volumes, so read BSE alongside NSE-linked coverage and the other large results in the window.
| Company | Date reported | Our page |
|---|---|---|
| SBI | Tue, 3 Nov 2026 (single source) | SBI Q2 results FY27 |
| BSE | Wed, 4 Nov 2026, call 6:30 PM IST | This page |
| Apollo Hospitals | Wed, 4 Nov 2026 | Apollo Hospitals Q2 results FY27 |
| Hindalco | Fri, 6 Nov 2026 | Hindalco Q2 results FY27 |
| NSE | Not a listed company | NSE Q3 results and IPO path |
For BSE’s earlier-quarter detail read the BSE Q3 results FY26 analysis.
What do most people miss about the BSE Q2 results FY27?
Most miss that the base is Q2 FY26 and not Q1’s record, that revenue and EBITDA each come in several versions, and that costs rise with volume.
- Compare Q2 FY27 with Q2 FY26 first, then with Q1 FY27.
- Note which revenue and EBITDA line the headline uses.
- Check transaction charges and the services-to-corporates line.
- Check costs against revenue growth.
- Confirm the date and call time in the exchange filing.
What do you need to know about costs, tax and safety?
Trading costs and your holding period matter more than one quarter’s headline; never pay anyone for results alerts or tips.
- What you need: a demat and trading account; settlement is T+1.
- Costs: check your broker’s current charges for brokerage, securities transaction tax, GST and stamp duty on each trade.
- Tax angle: gains on shares are taxed by holding period; see capital gains tax on shares and ask a tax adviser if unsure.
- NRI note: non-residents invest through specific accounts; see NRI investment in the Indian stock market.
- Trading calendar: markets hold a special session on Sunday, 8 November 2026; see Muhurat trading 2026.
- Scam warning: fake results alerts, paid “sure-shot” tips and KYC links on messaging apps are common. Never share an OTP.
Analyst’s note
- What stands out: in the BSE Q2 results FY27, the base is moderate at Rs 558 crore but the bar is high, because Q1 delivered Rs 873 crore.
- Easy to miss: H1 profit growth is already large on any Q2 outcome, so the half-year headline will look strong even if Q2 falls from Q1.
- What would change the view: a fall in transaction charges or a sharp rise in regulatory and clearing costs would point to pressure beneath the headline.
- Caution: this is reasoning from reported numbers, not a forecast. No outcome is assured.
- Reader action: match the definition before comparing any number.
Bottom line
BSE Q2 results FY27 are due on 4 November 2026. The base is Rs 558 crore profit on Rs 1,068 crore operating revenue; Q1 FY27 set a record at Rs 873 crore; and revenue and EBITDA come in several versions. No estimate was found. Confirm the date and definitions in the filing.
Part of the Earnings series. The earlier quarter is covered on the BSE Q3 results page.
PositionalCalls WhatsApp channel
Exchange results, without the noise
- BSE and NSE-linked numbers side by side
- Plain-language summaries of each filing
- Dates and corrections flagged the moment they change
Frequently asked questions
When are the BSE Q2 results FY27?
BSE has scheduled its Q2 FY27 results call for Wednesday, 4 November 2026 at 6:30 PM IST, per an intimation dated 27 October 2026, as reported. Confirm the board meeting and filing time in the exchange announcement.
What is the BSE Q2 results FY27 profit base?
The Q2 FY26 base is net profit attributable to shareholders of Rs 558 crore, up 61% from Rs 347 crore, on operating revenue of Rs 1,068 crore. Operating EBITDA was Rs 680 crore at a 64% margin.
What did BSE report in Q1 FY27?
BSE reported a record Q1 FY27: revenue from operations of Rs 1,566 crore (+63%), operating EBITDA of Rs 1,046 crore and net profit of Rs 873 crore (+62%), with transaction charges up about 80%, as reported.
Is there an analyst estimate for BSE Q2 profit?
No Q2 FY27 estimate was found as of 31 October 2026. Compare with the base of Rs 558 crore and with Q1’s Rs 873 crore. This page will show a source, date and base if a preview appears.
Why do BSE revenue and EBITDA figures differ across reports?
Q1 FY27 revenue appears as Rs 1,566, 1,707 and 1,726 crore because sources use operating revenue, total income or another line. EBITDA also differs. Match the definition on both sides of any comparison.
How much did BSE profit rise from Q4 FY26 to Q1 FY27?
Net profit rose 9.7% quarter on quarter, from Rs 795.47 crore to Rs 872.66 crore (my calculation). Some sites mislabel this as year-on-year growth; the year-on-year rise was about 62%.
What drives BSE’s profit?
Mainly transaction charges on derivatives, especially Sensex index options, plus listing income, StAR MF, market data and colocation. Volumes, tax changes and market share therefore decide each quarter, as reported.
Shares rose as much as 7% intraday on 12 November 2025 after Q2 FY26 and opened lower after the record Q1 FY27, as reported. Price reaction does not follow profit growth reliably.
What is the H1 FY27 profit arithmetic for BSE?
If Q2 FY27 profit only equals the Rs 558 crore base, H1 profit would be Rs 1,431 crore, up about 30% on Rs 1,097 crore (my calculation). It is an illustration, not a forecast.
Where do I check the official BSE results?
Open BSE’s corporate announcements for the company (scrip code 543918) or its investor page at bseindia.com. News reports differ on definitions, so use the filing as the final source.
Sources
- BSE Limited corporate announcements and investor information
- PL Capital research note on BSE Q1 FY27, 5 August 2026
- Business Standard, Kotak Neo, Quartr, Kalkine, Goodreturns, Swastika, CompoundingAI and Screener (secondary and aggregator, not linked)
Editorial disclosure. PositionalCalls.com is not a SEBI-registered research analyst or investment adviser. Investments in securities markets are subject to market risks. Read all related documents carefully before investing. Returns are never guaranteed. This page is educational, is independent and was written by Shubham Chaudhary, founder of PositionalCalls. How I researched this: I compared reported BSE results with brokerage notes and news reports, recomputed every derived number and labelled conflicting figures. Corrections are published in the Data note.

Shubham Chaudhary is the founder of PositionalCalls, an independent Indian stock market research website. He writes company fundamentals, quarterly results analysis, IPO analysis and sector research for NSE and BSE listed companies, with a focus on banking stocks, insurance and long-term value investing. Every article is built from primary sources such as RBI, SEBI, NSE and BSE filings and company annual reports, and states its risks plainly in simple language for retail investors.
Coverage areas Our research standards- Numbers checked against NSE, BSE and SEBI filings
- Risks and limits stated in every article
- No paid promotions or broker tie-ups
- Articles updated when new filings arrive