
Earnings · FMCG · Marico Limited
Marico Q2 results of 2 November 2026: profit up about 31%, EBITDA up 27% at an 18.2% margin, FY27 EBITDA guidance raised and the shares up about 8% on 3 November. Numbers, the two profit pairs, the base change and the price reaction.
Quick answer
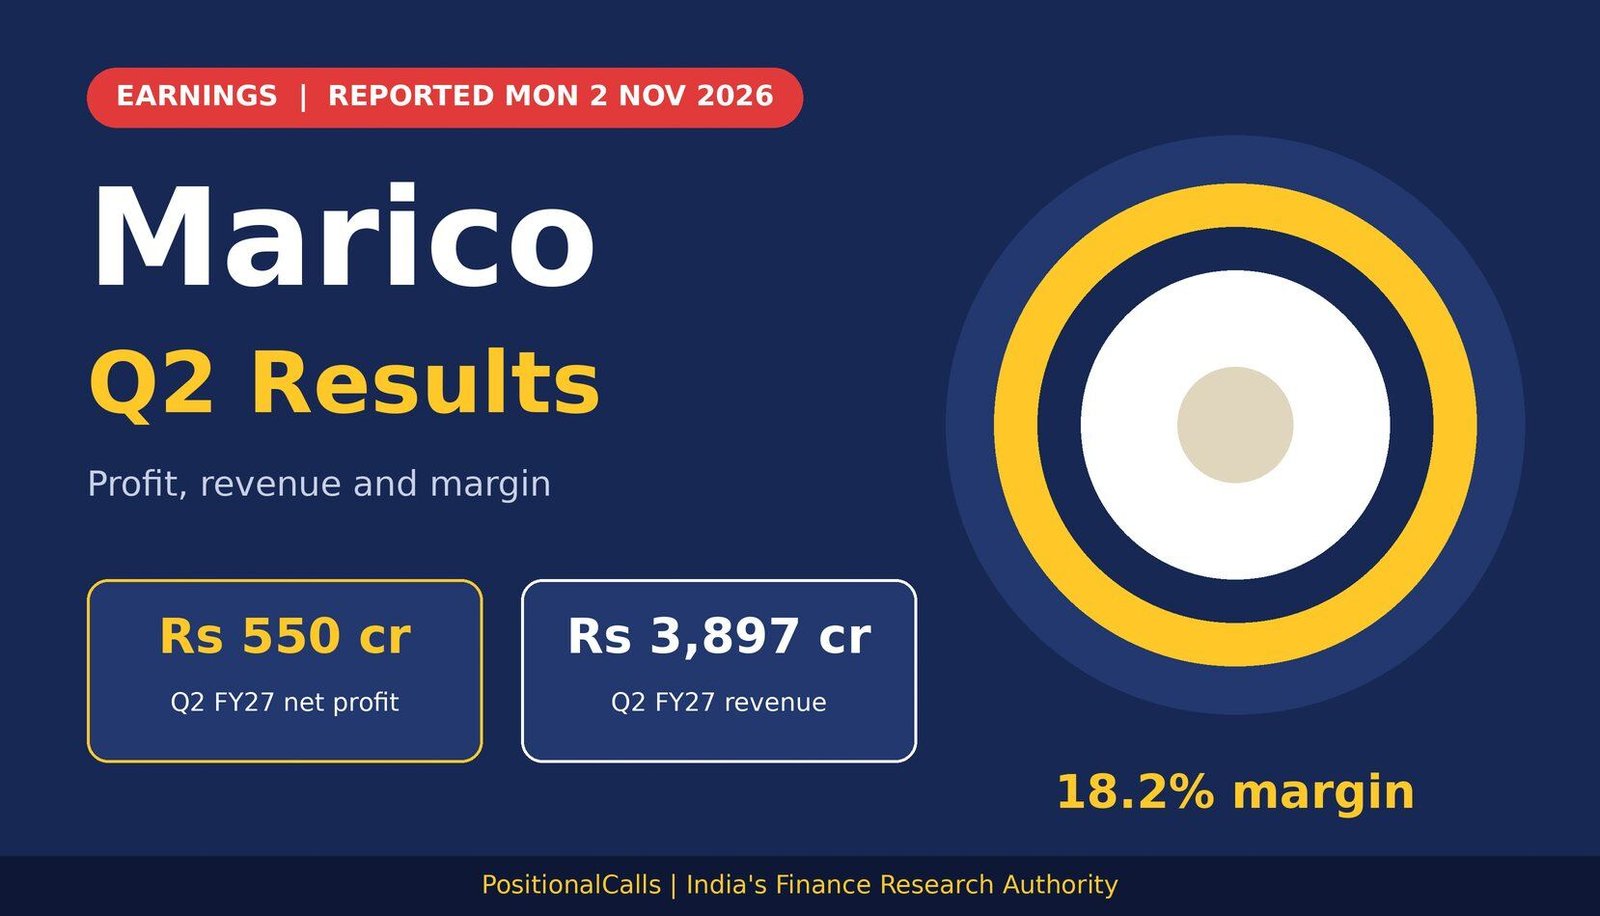
Marico Q2 results, reported on Monday, 2 November 2026, showed revenue of Rs 3,897 crore, up 13%, EBITDA of Rs 709 crore at an 18.2% margin and profit of Rs 550 crore, up 31%. FY27 EBITDA growth guidance rose to the mid-twenties, and the shares touched Rs 865 on 3 November, as of 14 November 2026.
Latest update (Saturday, 14 November 2026, 4:00 AM IST): Added the 3 November share reaction, the raised FY27 guidance and brokerage views as reported by Business Today and Upstox. The Rs 865 high is an intraday figure; I did not find the 3 November close or any later close. I did not open the company’s own filing, so check the exchange filing.
Earlier entries:
- Tuesday, 3 November 2026, morning session: the shares touched Rs 865, up 8.4% on the previous close, and brokerages reacted to the raised FY27 guidance.
- Monday, 2 November 2026, 5:00 PM IST: the page carried the reported Q2 FY27 numbers in place of the preview.
- Saturday, 31 October 2026, 7:45 PM IST: The preview was published with the base figures, the 5 October update and the date check.
- Monday, 5 October 2026: Marico released its Q2 FY27 business update, as carried by Business Today.
Key takeaways
- Profit: Rs 550 crore (+31%) against Rs 420 crore; a second pair, Rs 558 crore against Rs 432 crore, also circulates.
- Revenue: Rs 3,897 crore (+13%) on a restated base of Rs 3,450 crore.
- EBITDA: Rs 709 crore (+27%), margin 18.2% (+200 bps), below Q1’s 20.7%.
- India: revenue +10%, underlying volume +10% (Q1 was 11%).
- Against the update: revenue and EBITDA growth both landed in the guided ranges.
- Guidance: FY27 EBITDA growth raised to the mid-twenties from about 20%; Rs 20,000 crore revenue goal brought forward to FY29.
- Shares: after the Marico Q2 results, Rs 797.90 previous close to a Rs 865 intraday high on 3 November (+8.4%); no close found.
In plain words: Marico makes Parachute coconut oil, Saffola cooking oil and Livon hair care. When coconut costs fall, its margin improves. This page shows what it reported, why the headline profit differs between reports, and how the quarter compares with what the company had said it expected.
Data note: Figures are as of Saturday, 14 November 2026, 4:00 AM IST. The Marico Q2 results numbers come from Investywise, Whalesbook and Upstox reports of 2 November; share prices, guidance and brokerage views come from Business Today, Upstox and Angel One reports of 3 November. I did not open the filing or the investor presentation. Derived numbers are my calculation. Analysis only.
What did the Marico Q2 results show?
The Marico Q2 results show consolidated revenue of Rs 3,897 crore, up 13%, EBITDA of Rs 709 crore, up 27%, an 18.2% margin and net profit of Rs 550 crore, up 31%.
| Measure (consolidated) | Q2 FY26 (restated) | Q1 FY27 (Jun 2026) | Q2 FY27 (Sep 2026) |
|---|---|---|---|
| Revenue from operations, Rs crore | 3,450 (3,482 as first reported) | 3,957 | 3,897 (+13%) |
| EBITDA, Rs crore | About 558 (560 as first reported) | 819 | 709 (+27%) |
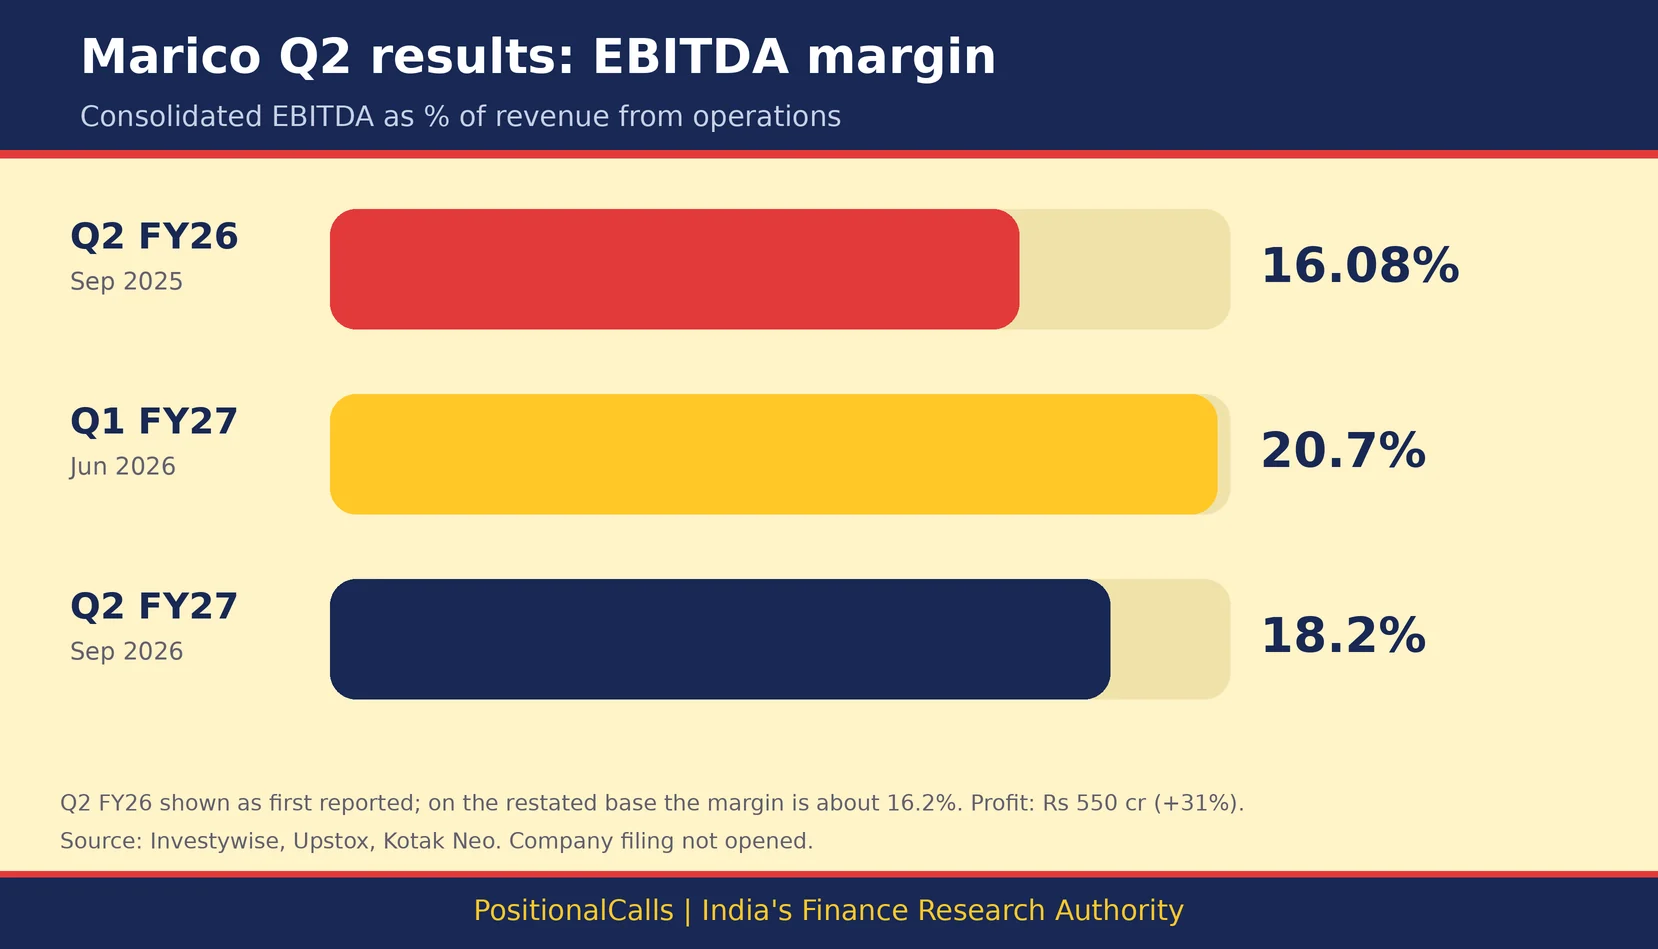
| EBITDA margin | About 16.2% (16.08% first reported) | 20.7% | 18.2% |
| Net profit, first pair, Rs crore | 420 | 630 | 550 (+31%) |
| Net profit, second pair, Rs crore | 432 | 652 | 558 (+29%, my calculation) |
| India underlying volume growth | Not reported in source | 11% | 10% |
Cite this table: PositionalCalls, “Marico Q2 FY27 Results Table, as of 2 November 2026”.
Here is the first useful sum. EBITDA of Rs 709 crore is -13.4% on Q1 FY27’s Rs 819 crore, and revenue is -1.5% on Rs 3,957 crore (my calculations). Against last year the picture is the reverse: EBITDA is +27.1% and revenue +13.0%. Read the quarter-on-quarter and year-on-year lines separately, because the quarter that ended in June was unusually strong.
Profit of Rs 550 crore is -12.7% on Q1’s Rs 630 crore, matched to the same first pair (my calculation). Investywise described the 31% rise as the fastest profit growth in 51 quarters; I could not check that claim against the filing.
Marico EBITDA Q2 FY27: the margin against the base
EBITDA of Rs 709 crore on revenue of Rs 3,897 crore is a margin of 18.2% (my calculation). Against the restated base margin of about 16.2% (558 divided by 3,450) that is about 2 points higher, which matches the 200 basis points reported. Against Q1’s 20.7% it is about 2.5 points lower, so the margin recovered on the year but did not hold the Q1 level.
What is the Marico Q2 results date and filing time?
Marico reported on Monday, 2 November 2026, as listed in Kotak Neo’s weekly list. Reports of the figures carry timestamps from 3:42 PM IST, and the exact filing time is not in the sources I opened.
Whalesbook’s article is stamped 3:42 PM IST, and Upstox’s profit and revenue entries carry stamps of 3:47 PM and 3:50 PM. Investywise also reported that the board named a new lead independent director, which is separate from the numbers. Confirm the filing time on the BSE or NSE page before you stamp anything with it.
Which Marico Q2 net profit pair is right?
For the Marico Q2 results use one pair: Rs 550 crore against Rs 420 crore (up about 31%), or Rs 558 crore against Rs 432 crore (up about 29%). Do not mix them.
| Figure | Pair A | Pair B | The trap |
|---|---|---|---|
| Q2 FY27 net profit, Rs crore | 550 (Upstox, Investywise) | 558 (Whalesbook) | Rs 8 crore apart |
| Q2 FY26 net profit, Rs crore | 420 | 432 | Rs 12 crore apart |
| Growth | +31% (30.95% in Upstox) | +29% (my calculation) | Different bases |
| Q1 FY27 net profit, Rs crore | 630 (+25%) | 652 (+27%) | Same pattern in the earlier quarter |
| Q2 FY26 revenue, Rs crore | 3,450 (restated) | 3,482 (first reported) | Advertising reclassified from expense to revenue |
Cite this table: PositionalCalls, “Marico Definition-Trap Table, as of 2 November 2026”.
The preview flagged both pairs for the earlier quarters and noted that the second pair may be profit before the minority share, which is my inference and not a reported fact. The new reports do not label the pairs, so the safest approach is to quote one pair and name its source.
The accounting change in the base
Whalesbook reported that Marico reclassified some advertisement and promotion expenses as a reduction in revenue, retrospectively, with no effect on total profit. That is why the year-ago revenue is Rs 3,450 crore in the new reports against Rs 3,482 crore in the original. On the old base the growth would be about 11.9%, not 13% (3,897 divided by 3,482, my calculation).
Marico net profit Q2 FY27: EBITDA versus profit
EBITDA grew 27% while profit grew 31%, a reversal of Q2 FY26, when EBITDA rose 7.3% and profit fell 1%. EBITDA is earnings before interest, tax, depreciation and amortisation, so a lower tax or finance cost line, or higher other income, can lift profit faster than EBITDA. The reports I opened do not say which.
How did the Marico Q2 results preview compare with the actuals?
The 5 October update guided double-digit revenue growth and mid-twenties operating profit growth. Revenue rose 13% and EBITDA 27%, so both landed in or at the top of the guided ranges.
| Item | Update or view (5 Oct 2026) | Reported | Read (my calculation) |
|---|---|---|---|
| Revenue growth | Double digits | +13% | In range |
| Operating profit growth | Mid-twenties | EBITDA +27% | At the top of the range |
| India volume | Double digits; Nuvama about +10% | +10% | At the lower edge; below Q1’s 11% |
| Parachute volume | Early teens; Nuvama about +14% | +13% (rigids) | In line |
| Value-added hair oils | Twenties; Nuvama +23% | +21% value | In range, slightly below Nuvama |
| International | Nuvama about +15% constant currency | +13% constant currency | Below that view |
| Saffola oils | Mid-single-digit value, volume down | +6% revenue, high-single-digit volume decline | In line |
Cite this table: PositionalCalls, “Marico Q2 FY27 Update versus Reported Table, as of 2 November 2026”.
There was no market consensus I could find for the Marico Q2 results, and the Nuvama figures are one house’s view as carried by Business Today. The reported EBITDA of Rs 709 crore is also close to the Rs 700 crore that a mid-twenties rise on Rs 560 crore implied, which the preview flagged as a sequential dip from Q1’s Rs 819 crore.
How did the shares react to the Marico Q2 results, and what changed in the FY27 guidance?
After the Marico Q2 results, the shares opened at Rs 833 on 3 November, up from Rs 797.90, and touched Rs 865, up 8.4%, while management raised its FY27 EBITDA growth guidance to the mid-twenties from about 20%.
| Price point (NSE) | Rs | Move | Source |
|---|---|---|---|
| Close, Monday 5 October | 790.65 | +1.35% | Business Today |
| 10:39 AM, Monday 2 November (before the results) | 796.25 | -0.47% | Upstox |
| Previous close, Monday 2 November | 797.90 | Base for 3 November | Business Today |
| Open, Tuesday 3 November | 833.00 | +4.4% on the previous close (my calculation) | Business Today |
| Intraday low, Tuesday 3 November | 828.10 | +3.8% (my calculation) | Business Today |
| 10:22 AM, Tuesday 3 November | 861.95 | +7.94% | Angel One |
| 10:48 AM, Tuesday 3 November | 862.90 | +8.06% | Upstox |
| Intraday high, Tuesday 3 November | 865.00 | +8.40% | Business Today |
Cite this table: PositionalCalls, “Marico Share Price Around the Q2 FY27 Results, as of 14 November 2026”.
Upstox lists the 52-week high as Rs 889.10 (30 July 2026) and the low as Rs 705.80 (7 November 2025), with a market value of about Rs 1.12 lakh crore on 3 November. The Rs 865 high is 2.7% below the 52-week high and 9.4% above the 5 October close (my calculation). I did not find the 3 November close or any later price, so this table stops at the morning session.
What did Marico raise in its FY27 guidance?
Business Today and Angel One report that, with the Marico Q2 results, the company lifted its FY27 EBITDA growth guidance to the mid-twenties from around 20%. Business Today adds that revenue growth is expected in the mid-teens, India volume growth in double digits, and revenue above Rs 15,000 crore in FY27. The Rs 20,000 crore revenue goal, set for FY30, has moved to FY29. Upstox cites CLSA saying Marico expects to comfortably cross Rs 15,000 crore in FY27. I did not open the company’s release, so confirm the wording there.
| Guidance line | Earlier | Latest | Source |
|---|---|---|---|
| FY27 EBITDA growth | Around 20% | Mid-twenties | Business Today; Angel One |
| FY27 revenue growth | Not in sources | Mid-teens | Business Today |
| FY27 revenue level | Not in sources | Above Rs 15,000 crore | Business Today; Angel One |
| Rs 20,000 crore revenue goal | FY30 | FY29 | Business Today; Angel One |
| India volume growth | Not in sources | Double digits | Business Today |
Cite this table: PositionalCalls, “Marico FY27 Guidance Changes, as reported on 3 November 2026”.
Upstox reports H1 FY27 net profit of Rs 1,180 crore against Rs 924 crore (+28%) and revenue of Rs 7,854 crore against Rs 6,671 crore (+18%). Angel One shows Rs 1,210 crore for H1 profit, which is the second profit pair again. The Rs 7,854 crore matches Q1’s Rs 3,957 crore plus Q2’s Rs 3,897 crore. If revenue is to cross Rs 15,000 crore, the second half needs only about Rs 7,146 crore, which is 9.0% below the first half (my calculation); I cannot say from these reports whether that is caution or seasonality. Upstox also reports advertising and promotion spend up 44% on the year, which helps explain why EBITDA margin rose by 200 basis points when gross margin rose by about 600.
PositionalCalls WhatsApp channel
Get the Marico Q2 numbers on WhatsApp
- The Marico filing time and headline numbers, stamped
- Base-to-beat tables for the next company results
- Links to updated Q2 FY27 pages
What did brokerages say after the Marico Q2 results?
Business Today, 3 November 2026, lists four views, and this is a single source. They are the brokerages’ views on the Marico Q2 results, not PositionalCalls targets.
| Brokerage | Rating as reported | Target, Rs | Gap to Rs 865 (my calculation) |
|---|---|---|---|
| Jefferies | Buy, maintained | 1,035 (raised) | +19.7% |
| Macquarie | Outperform, maintained | 965 | +11.6% |
| Morgan Stanley | Overweight, retained | 954 | +10.3% |
| CLSA | Hold, upgraded from Underperform | 737 (from 703) | -14.8% |
Cite this table: PositionalCalls, “Marico Brokerage Views After Q2 FY27, as reported by Business Today on 3 November 2026; gap to the intraday high”.
The gap column uses the Rs 865 intraday high, not a close, so it only shows scale. Upstox adds that Goldman Sachs called the quarter ahead of its estimates, with Parachute up 13% and a reset in Saffola edible oil; Jefferies called Marico a compounding machine; JPMorgan pointed to 13% constant-currency international growth despite soft Bangladesh; and CLSA cited procurement benefits and improving profitability in newer businesses. Upstox gives no ratings or targets for those four notes. This page gives no targets, ratings or recommendations of its own, and PositionalCalls is not SEBI-registered.
How did the preview scenarios compare with the Marico Q2 net profit?
The preview’s update-at-face-value case, with revenue of Rs 4,004 crore and EBITDA of Rs 700 crore at 17.5%, was above actual revenue of Rs 3,897 crore and below actual EBITDA margin of 18.2%.
| Preview scenario | Scenario figure, Rs crore | Reported, Rs crore | Gap (my calculation) |
|---|---|---|---|
| Revenue +15% on Rs 3,482 crore | 4,004 | 3,897 | -2.7% |
| EBITDA +25% on Rs 560 crore | 700 | 709 | +1.3% |
| Margin at update face value | 17.5% | 18.2% | +0.7 points |
| Profit if Q2 FY26 pattern repeats | About 523 | 550 | +5.2% |
| Flat Q1 profit | 630 | 550 | -12.7% |
Cite this table: PositionalCalls, “Marico Q2 FY27 Scenario Review, as of 2 November 2026”.
The scenarios in our Marico Q2 results preview were never forecasts. They show that growth in revenue was a little lower than the 15% case, while the margin was better than the 17.5% case, so EBITDA landed on the scenario even with lower revenue. The “flat Q1 profit” scenario is above the actual, because Q1 was an unusually strong quarter.
What did Marico’s India volume and brand lines show?
In the Marico Q2 results, India underlying volume growth was 10%, below Q1’s 11%, but more than 95% of the business gained or held market share, and Parachute rigids volume rose 13%, its fastest in 22 quarters.
| Line | Q1 FY27 | Q2 FY27 | Source |
|---|---|---|---|
| India revenue | Not in sources | Rs 2,916 crore, +10% | Investywise |
| India underlying volume | +11%, highest in 20 quarters | +10% | Kotak Neo; Investywise |
| Parachute rigids volume | Not in sources | +13%; market share at a record 60% | Investywise |
| Value-added hair oils | Not in sources | +21% value; share +80 bps | Investywise |
| Saffola edible oils | Not in sources | Revenue +6%; high-single-digit volume decline | Investywise |
| Foods portfolio | Not in sources | +45%; run rate above Rs 1,500 crore | Investywise |
| Gross margin (India) | Up 30 bps | Up about 600 bps | Kotak Neo; Investywise |
Cite this table: PositionalCalls, “Marico Volume and Brand Marks, as of 2 November 2026”.
Investywise attributed the roughly 600 basis points of gross-margin gain to portfolio mix and lower copra prices. That is a large move, and the 200 basis points of group EBITDA margin gain shows part of it was spent on advertising and other costs, though the reports do not give the advertising line.
Premium personal care reached an annualised run rate above Rs 500 crore, and digital-first brands about Rs 1,150 crore, per Investywise. Those are annualised company figures, not reported quarterly revenue lines.
How did Marico’s international business do?
In the Marico Q2 results, international revenue grew 13% in constant currency and 23% in rupees, with Vietnam at 22% and Bangladesh at 5%.
| Region | Constant-currency growth | Comment |
|---|---|---|
| Bangladesh | 5% | The slowest region |
| Vietnam | 22% | The fastest region |
| MENA | 15% | Matches Nuvama’s overall view |
| South Africa | 15% | In line |
| NCD and exports | 17% | Includes exports |
| Total international | 13%; 23% in rupees | The rupee figure is higher because of currency |
Cite this table: PositionalCalls, “Marico International Business Table, as of 2 November 2026”.
The gap between 13% and 23% is a currency effect, not extra demand. Compare the constant-currency figure with the Nuvama view of about 15%, and the rupee figure only with other rupee figures.
Which other results are around the same time as Marico?
Around the Marico Q2 results, ITC and Petronet LNG reported on Monday, 2 November, with Bajaj Finserv on Tuesday and Dabur on Wednesday, per Kotak Neo’s weekly list.
The list is partial and dates may change. For the same FMCG context, see our posts on ITC Q2 results and Dabur Q2 results. They cover other companies, so only the method carries over. The Q2 results calendar and the earnings calendar list the companies that have reported.
If you hold Marico shares and plan to sell later, our guide to capital gains tax on shares covers how gains are taxed. It is general information, not tax advice.
How to read the Marico Q2 results in 10 minutes
To read the Marico Q2 results quickly, go through seven lines in order: revenue, EBITDA, EBITDA margin, India volume, both profit pairs, brand lines and the notes on the accounting change.
| What to read | Mark to compare | Question to ask |
|---|---|---|
| Revenue from operations | Rs 3,897 crore; base Rs 3,450 crore restated | Is the base restated? |
| EBITDA | Rs 709 crore | Is it consolidated? |
| EBITDA margin | 18.2%; 16.08% or about 16.2% a year ago | Which base? |
| India volume | 10% against 11% in Q1 | Did growth slow? |
| Net profit | 550 and 420; or 558 and 432 | Which pair does the filing use? |
| Brand lines | Parachute +13%; VAHO +21% | Did the mix hold? |
| Notes | Reclassification, one-offs, currency | Is any line unusual? |
Cite this table: PositionalCalls, “Marico Results-Day Decoder, as of 2 November 2026”.
How to read the Marico filing on NSE or BSE
For the Marico Q2 results, open the exchange announcement, find the consolidated statement and compare each line with the tables above, same measure, same basis.
- Open the BSE corporate announcements page or the NSE corporate filings page and search for Marico.
- Choose the financial results announcement for the quarter ended 30 September 2026.
- Find the consolidated statement first.
- Check the unit and whether a column is for the quarter or six months.
- Read revenue, EBITDA, total profit and profit attributable to owners.
- Open the investor presentation for volume, margin and brand lines.
- Check the notes for the advertising reclassification and exceptional items.
- Compare every figure with the tables above.
What it costs: reading a filing is free. If you trade the stock, brokerage, securities transaction tax and other charges apply, so check your broker’s current schedule. Scam warning: on results day, fake “result alert” groups and sure-shot tips circulate. Nobody can guarantee a gain, and official filings are free.
What is the results checklist for Marico?
- Confirm the figures on the BSE or NSE announcement page.
- Note the filing time and stamp what you read with it.
- Open the consolidated statement of the Marico Q2 results before any headline.
- Check revenue against Rs 3,897 crore and the restated Rs 3,450 crore base.
- Check EBITDA against Rs 709 crore and the margin against 18.2%.
- Check which profit pair a headline quotes.
- Check India volume against 10%.
- Read the notes on the reclassification.
- Write your own plan before the price moves.
What are the risks around the Marico Q2 results?
What do most people miss about the Marico Q2 net profit?
- The base moved. Revenue of Rs 3,450 crore replaces Rs 3,482 crore after a reclassification.
- EBITDA fell from Q1. Rs 709 crore against Rs 819 crore, a 13% dip on the quarter.
- The margin is far above last year, but below Q1. 18.2% against about 16.2% and 20.7%.
- India volume slowed. 10% against 11% in the first quarter.
- Two profit pairs exist. Rs 550 and 420 crore, and Rs 558 and 432 crore.
- The guidance moved. With the Marico Q2 results, FY27 EBITDA growth went to the mid-twenties from about 20%, which is what the shares reacted to.
Analyst’s note: how to think about this quarter
- What stands out (reasoning): in the Marico Q2 results the margin recovery from a low base did most of the work, with revenue growth in the low teens.
- Easy to miss: the restated base lowers the comparison revenue and slightly raises growth rates.
- What would change the view: a filing that shows a different profit pair, release wording on guidance that differs from the reports, or India volume that proves lower than 10%.
- Caution: one quarter does not fix a long-term value. This page gives no target or recommendation.
- Reader action: choose one profit pair, compare the same lines, and check the filing.
Bottom line
Known: the Marico Q2 results show revenue of Rs 3,897 crore, EBITDA of Rs 709 crore at 18.2% and profit of Rs 550 crore on one pair, or Rs 558 crore on another.
Not known yet: the exact filing time, any close after the 3 November morning session and which profit pair the filing headlines.
Your move: use the decoder table, compare same-basis figures and read the guidance wording in the company release.
Next read: ITC Q2 results FY27, another FMCG result from the same day.
Part of the earnings coverage.
PositionalCalls WhatsApp channel
Results day, in one WhatsApp channel
- Filing alerts for Marico and other large companies
- The profit figures explained
- The next company on the results calendar
Marico Q2 results: frequently asked questions
When did Marico report its Q2 FY27 results?
The Marico Q2 results came on Monday, 2 November 2026. News reports of the numbers carry timestamps from 3:42 PM IST. The sources I opened do not give the exact filing time, so confirm it on the BSE or NSE announcement page before you stamp anything with it.
What was the Marico Q2 net profit?
In the Marico Q2 results, consolidated net profit attributable to owners was Rs 550 crore, up about 31% from Rs 420 crore, according to Upstox and Investywise. Whalesbook shows Rs 558 crore against Rs 432 crore, up about 29% (my calculation). Match each profit to its own base.
What was Marico revenue in Q2 FY27?
In the Marico Q2 results, revenue from operations was Rs 3,897 crore, up 13% from Rs 3,450 crore. Marico has reclassified some advertising and promotion expenses as a reduction in revenue, so the year-ago base is Rs 3,450 crore, not the Rs 3,482 crore reported at the time.
What was the Marico EBITDA margin in Q2 FY27?
EBITDA was Rs 709 crore, up 27%, at a margin of 18.2%, up 200 basis points, according to Investywise, which cites the BSE filing. The year-ago margin was 16.08% as first reported and about 16.2% on the restated base (my calculation).
Did Marico meet its 5 October update?
Yes. On 5 October the company guided double-digit revenue growth and mid-twenties operating profit growth, and the Marico Q2 results landed in both ranges. Revenue rose 13% and EBITDA 27%. India volume growth was 10%, at the lower edge of double digits and below Q1’s 11%.
How did Marico’s India business do?
India revenue was Rs 2,916 crore, up 10%, with underlying volume growth of 10%. Gross margin expanded about 600 basis points year on year on mix and lower copra prices. Parachute rigids volume rose 13%, its fastest in 22 quarters.
Did Marico raise its FY27 guidance with the Q2 results?
Yes. With the Marico Q2 results, Business Today and Angel One report that FY27 EBITDA growth guidance rose to the mid-twenties from around 20%, with revenue above Rs 15,000 crore and the Rs 20,000 crore goal brought forward to FY29. I did not open the company release, so confirm the wording there.
What happened to the Marico shares after the Marico Q2 results?
Business Today reports that the shares opened at Rs 833 on 3 November against a previous close of Rs 797.90 and touched Rs 865, up 8.4%. Upstox shows Rs 862.90 at 10:48 AM. I did not find the 3 November close or any later price, so no closing reaction is given.
Why do two Marico profit figures circulate?
Upstox and Investywise show Rs 550 crore against Rs 420 crore, while Whalesbook shows Rs 558 crore against Rs 432 crore. The same gap appeared in the earlier quarters. The reports do not label the second pair, so I treat the difference as unexplained.
What changed in Marico’s accounting this quarter?
Whalesbook reported that Marico reclassified some advertisement and promotion expenses as a reduction in revenue. The change is retrospective and has no effect on total profit, but it lowers revenue in the comparison periods. On the old base, revenue growth would be about 11.9% instead of 13% (my calculation).
Sources
- BSE corporate announcements: where the Marico filing appears.
- NSE corporate filings: financial results: the same filing on NSE.
- Kotak Neo: weekly Q2 results list, 30 October 2026.
- Investywise: Marico Q2 FY27 earnings update, 2 November 2026.
- Whalesbook: Marico Q2 FY27 net profit, 2 November 2026.
- Upstox: Q2 results live updates, 2 November 2026.
- Business Today: Marico Q2 update and Nuvama view, 5 October 2026.
- Business Today: Marico shares jump after Q2 results, brokerage targets, 3 November 2026.
- Upstox: Marico shares jump as company raises FY27 growth guidance, 3 November 2026.
- Angel One: Marico share price gains post Q2 FY27 results, 3 November 2026.
- Kotak Neo, Q1 FY27 article, and Upstox, Q2 FY26 article: base figures from the preview.

Shubham Chaudhary is the founder of PositionalCalls, an independent Indian stock market research website. He writes company fundamentals, quarterly results analysis, IPO analysis and sector research for NSE and BSE listed companies, with a focus on banking stocks, insurance and long-term value investing. Every article is built from primary sources such as RBI, SEBI, NSE and BSE filings and company annual reports, and states its risks plainly in simple language for retail investors.
Coverage areas Our research standards- Numbers checked against NSE, BSE and SEBI filings
- Risks and limits stated in every article
- No paid promotions or broker tie-ups
- Articles updated when new filings arrive