
Sector outlook · Banking
Looking for the best bank stocks in India 2026? This page replaces the earlier ranked list with a side-by-side of nine large banks on reported Q2 FY27 profit, margin, asset quality and loan growth, and shows how to compare them yourself. It names no winners.
Quick answer
The best bank stocks in India 2026 cannot be named from data alone, because “best” depends on your goal. Nine large banks reported Q2 FY27 profit growth from 4.7% (HDFC Bank) to 38% (Axis Bank), and gross NPA ratios from 1.04% to 2.55%. This page compares them with no picks.
Latest update (Saturday, 14 November 2026, 4:30 PM IST): Rebuilt around Q2 FY27 results, replacing the Q3 FY26 table, the unsourced strength scores and the valuation bands. Posts on long-term, safe and high-return bank stocks redirect here. I could not open any bank filing, so figures are headline-level from press reports.
Key takeaways
- No picks: there is no ranked list, rating, score or price target here. The earlier “Fast Picks” and strength-matrix scores had no method behind them and are removed.
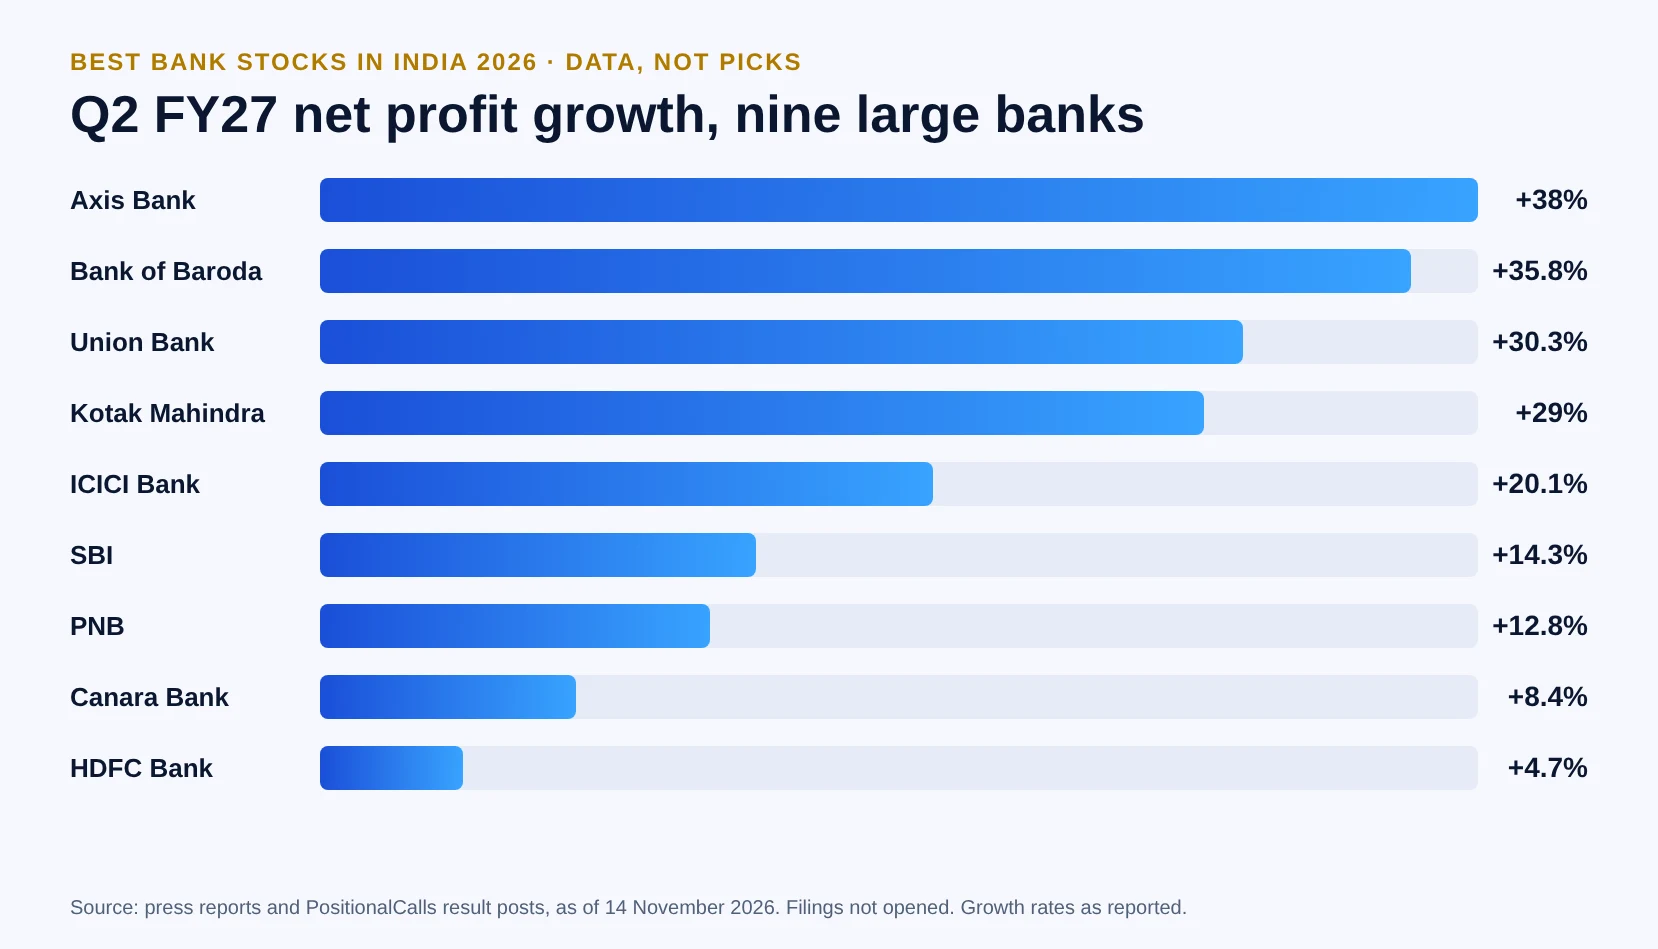
- Profit growth: Axis Bank +38%, Bank of Baroda +35.8%, Union Bank +30.3%, Kotak +29%, ICICI Bank +20.1%, SBI +14.3%, PNB +12.8%, Canara +8.4%, HDFC Bank +4.7%.
- Asset quality: gross NPA was 1.04% at Kotak, 1.11% at HDFC Bank, 1.16% at Axis and 1.20% at ICICI, against 2.42% at Union Bank and 2.55% at PNB.
- Margins: NIM fell year on year at ICICI (4.18%), Axis (3.36%) and Kotak (4.31%) and rose at HDFC Bank (3.32% on earning assets).
- Quality of growth: FCNR(B) lending adds 4 to 6 points to reported loan growth at banks that disclose it, and lower provisions lifted profit at Axis.
- Group view: about Rs 91,382 crore of combined profit, up about 16.8% (my calculation); public sector +17.8%, private +15.8%.
In plain words: every large bank I checked earned more than a year ago. The differences that matter for a stock buyer are in the details: how clean the loans are, how thin the margin is, and how much of the profit came from lower provisions or one-off gains.
Data note: Figures are as of 14 November 2026, 4:30 PM IST and cover the quarter to 30 September 2026, standalone unless stated. They follow Upstox, 5paisa, Investywise, Multibagg, PSU Connect, The Week and Free Press Journal, and my own SBI and Bank of Baroda posts. I could not open the exchange filings. Derived numbers are my calculation. Where sources differ I show both.
1. What can a data page say about the best bank stocks in India 2026?
A data page can show which banks grew profit fastest, which have the cleanest loans and which earn the widest margin, but it cannot name the best bank stocks in India 2026, because the best stock for a dividend seeker differs from the best for a long-term compounder.
Searches for the best bank stocks in India 2026 usually want one name. That is a recommendation, and PositionalCalls is not SEBI registered and gives no buy or sell calls. What I can do is put the reported numbers side by side so you can apply your own goal. The table below maps the common goals to the measure that actually tests them.
| If your goal is | Check this measure | Q2 FY27 evidence on this page | Caution |
|---|---|---|---|
| Safety | Gross and net NPA, slippage ratio, capital adequacy | Gross NPA from 1.04% (Kotak) to 2.55% (PNB); capital adequacy found only for Bank of Baroda (16.61%) | Capital adequacy is missing for most banks |
| Growth | Advances growth, adjusted for FCNR(B) lending | Reported 16.3% to 30%; adjusted 13.5% to 24.1% where disclosed | Reported growth is flattered by foreign-currency swap lending |
| Profitability | Net interest margin, profit growth and its source | NIM from 2.58% to 4.31%; profit +4.7% to +38% | Lower provisions and one-off gains lift some figures |
| Dividends | Payout history and capital buffers | Not covered here; no dividend figures were checked | See the dividend-focused page and the tax guide |
| Long-term holding | Consistency of ROE, NIM and NPA over several years | Only one quarter is shown | A single quarter is not a track record |
| Value | Price-to-book against return on equity | No price or valuation data used | Valuation needs live prices, which this page does not use |
Cite this table: Goal-to-measure map by PositionalCalls; evidence from the Q2 FY27 figures in the tables below, as of 14 November 2026, 4:30 PM IST.
What changed from the earlier version
The earlier page was titled as a “whitepaper” and led with a “Fast Picks” list naming a safest, fastest-growing and best-dividend bank. It also carried a strength matrix with scores such as 9.8 out of 10, price-to-book bands of 2.5 to 4 times, and a Q3 FY26 table. None of the scores or bands had a stated method or source, and the quarter was out of date, so I removed them. Three older posts on long-term, safe and high-return bank stocks overlapped this intent and redirect here.
2. What did nine large banks report in Q2 FY27?
All nine banks grew profit. Axis Bank rose 38%, Bank of Baroda 35.8%, Union Bank 30.3%, Kotak 29%, ICICI Bank 20.1%, SBI 14.3%, PNB 12.8%, Canara 8.4% and HDFC Bank 4.7%, while margins and asset quality differed more than profit.
| Bank (Q2 FY27) | Net profit (Rs crore) | Profit change | NIM | Gross NPA |
|---|---|---|---|---|
| SBI | 23,038 | +14.3% | 2.94% | 1.39% |
| HDFC Bank | 19,510 | +4.7% | 3.32% (earning assets) | 1.11% |
| ICICI Bank | 14,843 | +20.1% | 4.18% | 1.20% |
| Axis Bank | 7,003 | +38% | 3.36% | 1.16% |
| Kotak Mahindra Bank | 4,212 | +29% | 4.31% | 1.04% |
| Bank of Baroda | 6,531.5 | +35.8% | 2.74% | 1.78% |
| Union Bank of India | 5,537 (consolidated 5,781) | +30.3% | 2.86% | 2.42% |
| Punjab National Bank | 5,532 | +12.8% | 2.58% | 2.55% |
| Canara Bank | 5,175 | +8.4% | Not found | Not found |
Cite this table: Q2 FY27 results per Upstox, 5paisa, Multibagg, Investywise, Free Press Journal and PositionalCalls result posts; growth rates as reported; filings not opened.
Adding the nine profits gives about Rs 91,382 crore against about Rs 78,239 crore a year earlier, a rise of about 16.8% (my calculation). The four private banks add to about Rs 45,568 crore, up about 15.8%, and the five public sector banks to about Rs 45,814 crore, up about 17.8%. Year-ago profit for PNB, Canara and Union is back-calculated from reported growth rates, so the totals are approximate. For the sector-level reading of these numbers, see my banking sector outlook 2026 and banking sector earnings pages.
3. What do the numbers show bank by bank?
Each card below lists only reported Q2 FY27 facts and one thing to verify in the filing. None is a rating.
SBI
Net profit Rs 23,038 crore (+14.3%) on a year-ago base that included a Rs 4,593 crore gain, per my SBI post. NIM 2.94% (domestic 3.11%), gross NPA 1.39%, net NPA 0.36%, credit cost 0.22%, slippage 0.41%. Advances grew 17.84% and deposits 12.27%. Operating profit rose 7.28% against net profit 14.28%. Check in the filing: Whether the base-year gain distorts the growth rate.
HDFC Bank
Net profit Rs 19,510 crore (+4.7%); the Upstox headline contains a typing error on this figure, so check it. NIM 3.32% on earning assets (3.16% on total assets), gross NPA 1.11% against 1.24%. Period-end gross advances grew about 16.3% and deposits about 18.8%, per provisional disclosures, giving a credit-deposit ratio near 96.8% (my calculation). Check in the filing: The slower profit growth and its drivers; a headline mentions weaker treasury income, which I did not open.
ICICI Bank
Net profit Rs 14,843 crore (+20.1%), net interest income Rs 25,339 crore (+17.7%), NIM 4.18% against 4.30% a year earlier and 4.36% in Q1, gross NPA 1.20% against 1.58%, net NPA 0.30%. Loans grew 30% as reported and 24.1% excluding FCNR(B). Check in the filing: How much of loan growth is swap-funded and at what spread.
Axis Bank
Net profit Rs 7,003 crore (+38%), NIM 3.36% against 3.73% (3.47% excluding FCNR(B)), gross NPA 1.16%, down 30 bps, gross slippage 1.48% annualised. Provisions fell to Rs 1,693 crore from Rs 3,547 crore, down 52.2%. Advances grew 23% (19% adjusted) and deposits 21%. Check in the filing: Profit growth that depends on lower provisions.
Kotak Mahindra Bank
Net profit Rs 4,212 crore (+29%), NIM 4.31% against 4.54%, gross NPA 1.04% against 1.39%. Loans grew 25%, or 19% excluding FCNR(B) and a portfolio acquisition. Check in the filing: Margin down 23 bps year on year despite the profit rise.
Bank of Baroda
Net profit Rs 6,531.5 crore (+35.8%, a record), NIM 2.74%, gross NPA 1.78%, net NPA 0.37%, capital adequacy 16.61%. Treasury income was Rs 4,093 crore against Rs 1,086 crore, linked to an NSE share sale; loans grew 18% (13.5% adjusted). See my Bank of Baroda Q2 results FY27 post. Check in the filing: How much of the profit rise is the one-time treasury gain.
Union Bank of India
Net profit Rs 5,537 crore (+30.3%; consolidated Rs 5,781 crore), NIM 2.86% (3.03% excluding a tax refund), gross NPA 2.42% against 3.29%, net NPA 0.42% against 0.55%. Domestic advances grew 17.35% and deposits 6.87%. Check in the filing: The gap between loan and deposit growth.
Punjab National Bank
Net profit Rs 5,532 crore (+12.8%), NIM 2.58% (2.50% in Q1), gross NPA 2.55%, down 90 bps, slippage ratio 0.77% against 0.71%. Advances grew 14.7% and deposits 9.9%. Check in the filing: Why slippage rose while the NPA ratio fell.
Canara Bank
Net profit Rs 5,175 crore (+8.4%), from a headline only. I did not find margin or NPA figures. Check in the filing: Everything beyond the headline profit.
4. How clean are the loans behind the bank stocks?
Gross NPA ratios fell at every bank where I found a year-ago figure. Private banks sit between 1.04% and 1.20%, and public sector banks between 1.39% and 2.55%, so asset quality is good across the group and weakest at Union Bank and PNB.
PositionalCalls WhatsApp channel
Follow bank results as they are filed
- Quarterly bank results explained in plain words
- NPA, margin and loan-growth numbers without tips
- A message when this page is updated
| Bank | Gross NPA Q2 FY27 | Year-ago or change | Other asset-quality data |
|---|---|---|---|
| HDFC Bank | 1.11% | 1.24% | Not found |
| ICICI Bank | 1.20% | 1.58% (down 38 bps) | Net NPA 0.30% |
| Axis Bank | 1.16% | Down 30 bps | Gross slippage 1.48% annualised; provisions down 52.2% |
| Kotak Mahindra Bank | 1.04% | 1.39% | Not found |
| SBI | 1.39% | Not found | Net NPA 0.36%; credit cost 0.22%; slippage 0.41% |
| Bank of Baroda | 1.78% | Not compared | Net NPA 0.37%; capital adequacy 16.61% |
| Union Bank | 2.42% | 3.29% | Net NPA 0.42% from 0.55% |
| PNB | 2.55% | Down 90 bps | Slippage ratio 0.77% from 0.71% |
Cite this table: Asset quality per Upstox, 5paisa, Multibagg and my Bank of Baroda post; definitions and the exact year-ago base vary by source; filings not opened.
The public sector banks started from higher ratios and have moved further: Union Bank’s gross NPA fell 87 bps and PNB’s 90 bps (my calculation for Union: 3.29% less 2.42%). Private banks fell 13 to 38 bps from a lower base. A buyer who defines safety as the lowest NPA ratio would read the table one way, and one who defines it as the biggest improvement would read it another way. That is the reason I do not rank.
Best bank stocks in India 2026 and capital adequacy: the gap in the data
Capital adequacy is the measure that shows how much loss a bank can absorb, and I found it for only one bank, Bank of Baroda at 16.61%. The earlier page listed capital ratios for five banks from the Q3 FY26 quarter. Because those were for an older quarter and I could not re-verify them, I did not carry them over. If safety matters to you, read the capital adequacy line in each bank’s Q2 filing and the RBI minimum for its category.
5. How fast are banks growing, and what is behind it?
Loan growth is 14.7% to 23% reported at the banks with figures, with deposit growth lagging at several public sector banks, and FCNR(B) swap lending adds 4 to 6 points to reported growth at the four banks that disclose it.
| Bank | Advances growth | Deposit growth | Gap, points (my calculation) |
|---|---|---|---|
| SBI | 17.84% | 12.27% | 5.6 |
| Punjab National Bank | 14.7% | 9.9% | 4.8 |
| Union Bank (domestic advances) | 17.35% | 6.87% | 10.5 |
| HDFC Bank (gross advances) | 16.3% | 18.8% | -2.5 |
| Axis Bank (reported) | 23% | 21% | 2 |
Cite this table: Advances and deposit growth per 5paisa (9 November), Multibagg and PSU Connect; definitions differ by bank; provisional where noted.
| Bank | Loan growth reported | Excluding FCNR(B) effect | Gap, points (my calculation) |
|---|---|---|---|
| ICICI Bank | 30% | 24.1% | 5.9 |
| Kotak Mahindra Bank | 25% | 19% (also excludes a portfolio acquisition) | 6 |
| Axis Bank | 23% | 19% | 4 |
| Bank of Baroda | 18% | 13.5% | 4.5 |
Cite this table: FCNR(B)-adjusted loan growth per 5paisa (9 November) and my Bank of Baroda post.
FCNR(B) is a foreign-currency deposit that banks can swap with RBI. Lending funded this way adds to reported loan growth at a thin spread, which is one reason margins and growth can move in opposite directions. I did not find the spread on these loans, so I do not quantify the effect on profit. At the system level, RBI fortnightly data reported by The Week shows bank credit up 17.94% against deposits up 16.60% on 15 October 2026, a gap of 1.34 points (my calculation).
6. Where does profit growth come from in the best bank stocks in India 2026 comparison?
At Axis, lower provisions explain much of the profit rise, at Bank of Baroda a treasury gain from an NSE share sale does, and at SBI a one-time gain in the year-ago base lowers the growth rate. The source of profit matters as much as its size.
| Bank | Profit growth | Item that affects it | Direction of effect |
|---|---|---|---|
| Axis Bank | +38% | Provisions fell Rs 1,854 crore (Rs 3,547 crore to Rs 1,693 crore) | Lifts profit; may not repeat |
| Bank of Baroda | +35.8% | Treasury income up about Rs 3,007 crore on an NSE share sale | Lifts profit; one-time |
| SBI | +14.3% | Year-ago base included a Rs 4,593 crore gain | Lowers reported growth |
| Union Bank | +30.3% | NIM 3.03% excluding a tax refund | Refund lifts reported NIM |
| HDFC Bank | +4.7% | Headline cites weaker treasury income (not opened) | Lowers profit growth |
Cite this table: Items per my SBI and Bank of Baroda posts, Upstox, Multibagg and an Asianet News headline (not opened); differences are my calculation and are before tax where provisions are concerned.
Axis’s provisions fell by Rs 1,854 crore, almost as large as its Rs 1,914 crore rise in profit, although provisions are before tax and profit is after tax (my calculation). That does not make the profit low quality, but it does mean the same growth rate may not repeat once provisions stop falling. Bank of Baroda’s treasury income rose about Rs 3,007 crore, more than its Rs 1,722 crore rise in net profit, again with the before-and-after-tax caveat.
7. How do you compare the best bank stocks in India 2026 yourself?
Pick your goal first, then compare banks on the matching measures from the latest filing, adjust for one-time items, and look at more than one quarter before you form a view.
- Fix the goal: safety, growth, dividends or a long holding period each need different measures, as the table in section 1 shows.
- Read the filing, not the headline: open the results on the NSE or BSE site and find net profit, NIM, gross and net NPA and capital adequacy.
- Strip one-offs: look for treasury gains, tax refunds, base-year gains and provision write-backs.
- Adjust growth: check whether loan growth includes FCNR(B) lending or an acquisition.
- Compare at least four quarters: one quarter is not a track record.
- Add price last: a bank can be strong and expensive. Valuation needs live prices, which I do not use on this page.
- Think about tax: gains are taxed under the rules in my capital gains tax on shares guide, and dividends under my dividend tax in India guide.
If your question is narrower, see my PSU bank stocks in India 2026 page, my bank stocks under Rs 100 page and my PSU banks capital rotation explainer. Each keeps to its own question, so this page does not repeat them.
8. What are the risks when you pick the best bank stocks in India 2026?
The main risks are margin pressure after the repo rate rose to 5.50%, deposit competition as loans outgrow deposits, provisions that stop falling, the quality of FCNR(B)-aided growth, and slippages at banks with higher NPA ratios.
A second set of risks is in the process. Stock prices can fall even when profit rises, because prices reflect expectations. This page uses no price data, so it cannot tell you whether a bank’s results were already reflected in its price. Brokerage ratings were also not used, because a rating is an opinion and not a company fact.
9. What most people miss about the best bank stocks in India 2026
- What stands out: the fastest profit growers (Axis, Bank of Baroda, Union) each have an item that flatters growth, so the ranking by growth is not a ranking by quality.
- Easy to miss: a headline NIM can differ by measure, as HDFC Bank’s 3.32% on earning assets against 3.16% on total assets shows.
- What would change the picture: December-quarter margins after the rate rise, and capital adequacy lines for each bank.
- Caution: this page does not say which bank to buy. It shows what each reported and where the data is thin.
Bottom line
The best bank stocks in India 2026 depend on your goal, and the data does not name one winner. In Q2 FY27 all nine large banks grew profit, asset quality improved, and margins narrowed at three of four private banks, while some of the profit growth came from lower provisions and one-off gains. Compare banks on the measure that matches your goal, and read the filings.
Next read: see the sector view in our banking sector outlook 2026.
Part of the Sector Outlook series on PositionalCalls.
PositionalCalls WhatsApp channel
Keep the banking data in one place
- Sector outlook and earnings updates
- RBI decisions and what they mean for banks
- Updates when the next quarter is filed
FAQs on the best bank stocks in India 2026
What are the best bank stocks in India 2026?
This page does not name them, because PositionalCalls gives no buy or sell calls and the best bank stocks in India 2026 depend on your goal. It compares nine large banks on Q2 FY27 profit, margin and NPA, and shows the measures to check for safety, growth and dividends.
Which bank grew profit fastest in Q2 FY27?
Axis Bank grew net profit fastest among the nine banks I compared, up 38% to Rs 7,003 crore. Bank of Baroda followed at 35.8% and Union Bank at 30.3%. Axis also cut provisions by 52.2%, so part of the rise reflects lower provisions, not only higher operating profit.
Which bank had the lowest gross NPA in Q2 FY27?
Among the nine banks, Kotak Mahindra Bank reported the lowest gross NPA at 1.04%, followed by HDFC Bank at 1.11%, Axis Bank at 1.16% and ICICI Bank at 1.20%. PNB was highest at 2.55%. I found no figure for Canara Bank, and definitions vary by source.
Which bank has the highest net interest margin?
Of the banks with a figure, Kotak Mahindra Bank reported the widest NIM at 4.31%, followed by ICICI Bank at 4.18%. SBI, Union Bank and PNB were between 2.58% and 2.94%. Margins are only one input, not a ranking of quality.
Are bank stocks safe for long-term investors?
No share is risk free. Bank stocks can fall when margins narrow, provisions rise or the market reprices them. A safety check uses gross and net NPA, slippage and capital adequacy from the filing. Read several quarters before you judge the best bank stocks in India 2026 for a long holding.
How do I define a safe bank stock using data?
Use gross NPA, net NPA, slippage ratio, provision coverage and capital adequacy from the latest filing, then compare them across at least four quarters. In Q2 FY27 gross NPA ranged from 1.04% to 2.55% among nine banks, but I found capital adequacy for only one bank.
Are PSU banks different from private banks on this data?
On profit growth the five public sector banks grew about 17.8% and the four private banks about 15.8% (my calculation). Margins were lower at public sector banks, at 2.58% to 2.94%, and gross NPA was higher, at 1.39% to 2.55%. One-time items affect both groups.
How did FCNR(B) lending affect bank growth?
At the four banks that disclose it, loan growth excluding FCNR(B) was 4 to 6 points lower than reported: ICICI 30% against 24.1%, Kotak 25% against 19%, Axis 23% against 19% and Bank of Baroda 18% against 13.5%. I did not find the spread on these loans.
Why does this page not rank the best bank stocks in India 2026?
A ranking would be a recommendation, which PositionalCalls does not give, and the earlier scores had no stated method. Rankings by profit growth also mislead, because Axis, Bank of Baroda and Union each had an item that lifted growth. The page shows the evidence so you can apply your own goal.
What should I monitor each quarter for bank stocks?
Track net profit and its source, NIM, gross and net NPA, slippage ratio, capital adequacy, advances against deposit growth and FCNR(B) lending. For the next update, the December-quarter results will show the first effect of the October rate rise, per secondary reports, on margins.
Sources
- Upstox: HDFC, ICICI, Axis and Kotak Q2 FY27, 26 October 2026; contains a typing error on HDFC profit.
- 5paisa: banking stocks after Q2 FY27, 9 November 2026.
- Investywise: SBI Q2 FY27, 3 November 2026; basis not stated.
- PSU Connect: HDFC Bank Q2 FY27 advances and deposits, 5 October 2026; provisional.
- Multibagg: Union Bank Q2 FY27; an automated summary with internal inconsistencies.
- Free Press Journal: Canara Bank Q2 FY27; headline only.
- The Week: bank credit grows 17.94%, 30 October 2026; RBI data.
- PositionalCalls: Bank of Baroda Q2 results FY27 (my result post).
- Reserve Bank of India: policy statements and statistics.
- Named, not linked: Asianet News headline on HDFC Bank treasury income, DSIJ headline on SBI provisions, Outlook Money and aggregator coverage of the RBI repo decision, as read for my banking sector posts, as of 14 November 2026, 4:30 PM IST. No BSE or NSE filing was opened.

Shubham Chaudhary is the founder of PositionalCalls, an independent Indian stock market research website. He writes company fundamentals, quarterly results analysis, IPO analysis and sector research for NSE and BSE listed companies, with a focus on banking stocks, insurance and long-term value investing. Every article is built from primary sources such as RBI, SEBI, NSE and BSE filings and company annual reports, and states its risks plainly in simple language for retail investors.
Coverage areas Our research standards- Numbers checked against NSE, BSE and SEBI filings
- Risks and limits stated in every article
- No paid promotions or broker tie-ups
- Articles updated when new filings arrive