
Earnings · Berger Paints India
The Berger Paints Q2 results, reported on 5 November 2026, show consolidated sales up 13% but profit up only 5%, with standalone profit lower. Here is what changed, why margins slipped, how the shares reacted and what to watch next.
Quick answer
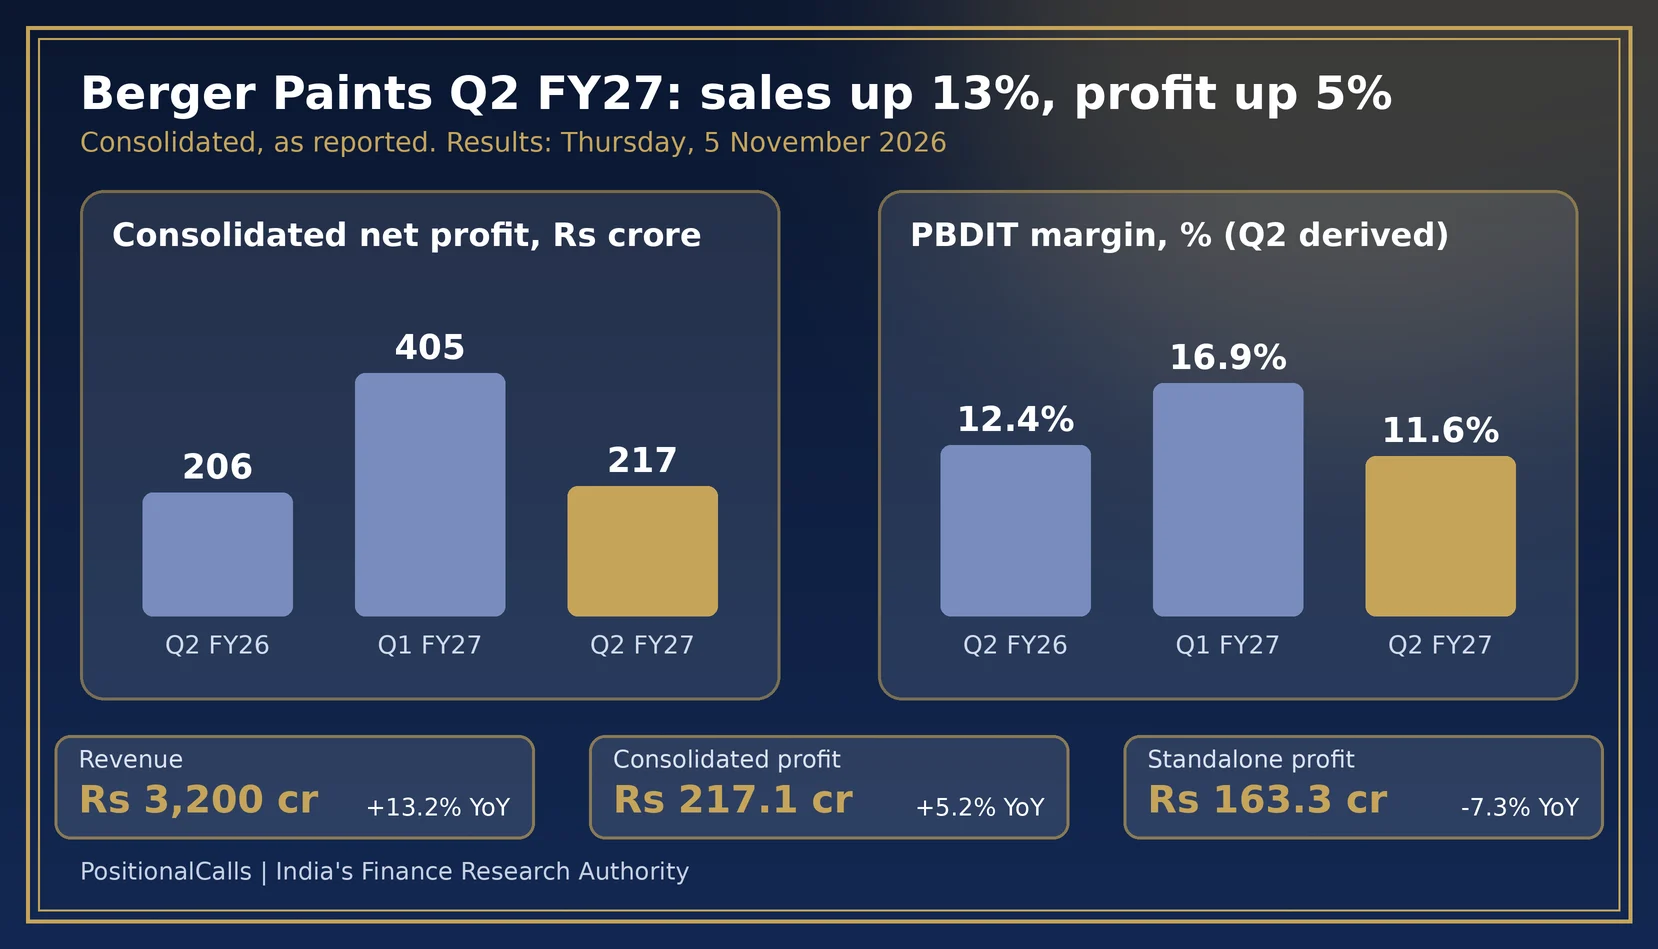
Berger Paints Q2 results: consolidated profit rose 5.2% to Rs 217.1 crore on 5 November 2026, with revenue up 13.2% to Rs 3,200.4 crore. Standalone profit fell 7.3% to Rs 163.31 crore. The operating margin slipped to about 11.6% from 12.4% (my calculation).
Latest update (Thursday, 5 November 2026, 5:30 PM IST): The results are out and this page is now the full analysis. I found conflicting closing-price figures and no estimate changes yet; both will be added when confirmed.
Earlier entries:
- Thursday, 5 November 2026: Berger Paints reported Q2 FY27; first reports appeared around 2:46 PM IST.
- Sunday, 1 November 2026, 10:30 AM IST: Preview published with a base of Rs 206 crore profit and a 12.4% margin.
Key takeaways
- Profit: the Berger Paints Q2 results show consolidated profit of Rs 217.1 crore (+5.2%) and standalone Rs 163.31 crore (-7.3%).
- Revenue: consolidated Rs 3,200.4 crore, up 13.2%, above the preview’s 10% to 15% band.
- Margin: Q2 PBDIT margin about 11.6% against 12.4% a year ago and 16.9% in Q1 (my calculation).
- First half: revenue Rs 6,784.1 crore (+12.5%) and profit Rs 622.1 crore (+19.3%).
- Shares: reports differ on the close; price increases are planned from November.
In plain words: The Berger Paints Q2 results show a company that sold 13% more but kept only a little more profit. Raw materials and advertising cost more, and the company has not yet raised prices enough to cover them. It plans price rises from November.
Data note: Figures are as of Thursday, 5 November 2026, 5:30 PM IST. Results come from reports by Business Today, Whalesbook, Investywise, Sahi and NewsBytes, which quote the company’s filing; I did not open the exchange filing. Q1 FY27 profit of Rs 405 crore plus Q2 profit of Rs 217.1 crore equals the reported H1 profit of Rs 622.1 crore, so the figures reconcile. Q2 PBDIT and margin are my derivation from half-year figures. Derived numbers are my calculation.
What were the Berger Paints Q2 results for FY27?
Berger Paints reported consolidated revenue of Rs 3,200.4 crore (+13.2%), profit before tax of about Rs 285 crore (+4%) and net profit of Rs 217.1 crore (+5.2%) for the quarter ended 30 September 2026.
| Measure (consolidated) | Q2 FY26 (Sep 2025) | Q1 FY27 (Jun 2026) | Q2 FY27 (Sep 2026) | Change |
|---|---|---|---|---|
| Revenue, Rs crore | 2,827 | 3,583.8 | 3,200.4 | +13.2% YoY; -10.7% QoQ |
| PBDIT, Rs crore | 352 | 607.4 | About 370.7 (derived) | +5.3% YoY; -39% QoQ |
| PBDIT margin | 12.4% | 16.9% | About 11.6% (derived) | -0.8 points YoY |
| Net profit, Rs crore | About 206 | 405 | 217.1 | +5.2% YoY; -46.4% QoQ |
| Standalone net profit, Rs crore | 176.3 | 368.7 | 163.31 | -7.3% YoY; -55.7% QoQ |
| H1 revenue, Rs crore | 6,028.3 | Not applicable | 6,784.1 | +12.5% YoY |
| H1 net profit, Rs crore | 521.4 | Not applicable | 622.1 | +19.3% YoY |
Cite this table: PositionalCalls, “Berger Paints Q2 FY27 Results Table, as of 5 November 2026”.
The Berger Paints Q2 results date was Thursday, 5 November 2026, as listed in Kotak Neo’s weekly list. The preview said the margin level would tell more than the growth rate, and it did: revenue growth of 13.2% sat in the middle of the 10% to 15% band, but profit grew only 5.2% because the margin slipped below even last September’s weak 12.4%.
The first half still looks healthy: H1 profit of Rs 622.1 crore is up 19.3% because Q1 FY27 was strong. Q2 on its own is the soft spot. Managing Director Abhijit Roy described a consistent performance in a seasonally soft quarter, according to the reports I read.
Berger Paints net profit Q2 FY27: why did profit grow only 5% on 13% sales growth?
In the Berger Paints Q2 results, extra revenue added about Rs 47 crore of PBDIT at last year’s margin, but a 0.8-point margin fall took back about Rs 28 crore, leaving PBDIT up only Rs 19 crore (my calculation).
Berger Paints EBITDA Q2 FY27: the bridge
| PBDIT bridge, Rs crore | Amount | How I got it |
|---|---|---|
| Q2 FY26 PBDIT | 352 | 12.4% of Rs 2,827 crore |
| Sales effect | +47 | Extra revenue of Rs 373 crore at last year’s 12.4% margin |
| Margin effect | -28 | Rs 3,200 crore times the 0.8-point margin fall |
| Q2 FY27 PBDIT (derived) | About 371 | H1 PBDIT Rs 978.11 crore less Q1 Rs 607.4 crore |
Cite this table: PositionalCalls, “Berger Paints PBDIT Bridge, as of 5 November 2026”.
How I derived Q2 PBDIT. The company reported H1 PBDIT of Rs 978.11 crore, up 11.1% from Rs 880.66 crore. Q1 FY27 PBDIT was Rs 607.4 crore (Kotak Neo). The difference is Rs 370.7 crore. Last year’s Q1 plus Q2 (about Rs 528 crore and Rs 352 crore) sums to the H1 FY26 figure, so the method reconciles. Check it against the Q2 column in the filing.
Why the margin slipped. Reports cite input-cost inflation that has not eased and heavy marketing spend on the company’s festive campaign. The company says it will take price increases from November. Industrial and construction chemicals supported growth, per Whalesbook.
Worked example: what each point of margin is worth
On revenue of Rs 3,200 crore, one percentage point of margin is Rs 32 crore of PBDIT. Q2 FY27’s 11.6% is 5.3 points below Q1 FY27’s 16.9%, which is about Rs 170 crore of PBDIT (my calculation). That gap, not revenue, explains most of the fall in profit from Q1.
How did the Berger Paints share price react to the Q2 results?
Reports disagree. Business Today gave a close of Rs 510.20 against a previous close of Rs 484.50 but described a rise of just over 2%, while NewsBytes said the shares jumped 4%.
| 5 Nov 2026 | What was reported | Implied move vs Rs 484.50 | Source |
|---|---|---|---|
| Previous close | Rs 484.50 | Not applicable | Business Today |
| Close | Rs 510.20 (text says “over 2%”) | +5.3% (my calculation) | Business Today |
| Intraday | “Jumped 4%” | About +4% | NewsBytes |
| Market value | About Rs 57,822 crore | Not used | Business Today |
Cite this table: PositionalCalls, “Berger Paints Results-Day Price Reports, as of 5 November 2026”.
The numbers in the Business Today report do not agree with each other: Rs 510.20 against Rs 484.50 is a 5.3% rise, not a rise of just over 2%. I did not confirm the official NSE close, the volume or the intraday high, so I am showing the conflict instead of picking a figure. I will add the verified close on Friday, 6 November.
Either way, the shares rose on a quarter where profit growth was modest. That is a reaction to expectations, not a forecast, and this page carries no ratings or targets. I found no brokerage estimate changes when I wrote this.
Did the Berger Paints Q2 results beat or miss expectations?
I found no Q2 FY27 consensus estimate, so I cannot call a beat or miss. Against my own preview guide, revenue growth read in line while margin, EBITDA growth and profit growth read weaker.
| Mark | Preview guide (stronger / in line / weaker) | Actual Q2 FY27 | Reading |
|---|---|---|---|
| Revenue growth | Above 15% / 10-15% / below 10% | +13.2% | In line |
| Operating margin | 16.5%+ / 14.0-16.5% / below 14.0% | About 11.6% (derived) | Weaker |
| EBITDA (PBDIT) growth | Above 30% / 15-30% / below 15% | About +5.3% (derived) | Weaker |
| Volume growth | 9%+ / 7-9% / below 7% | Not found | Not scored |
| Consolidated profit growth | Above 40% / 20-40% / below 20% | +5.2% | Weaker |
Cite this table: PositionalCalls, “Berger Paints Preview Guide Versus Actual, as of 5 November 2026”.
The preview scenarios had a +12% revenue case at the lowest margin of 13.5% giving EBITDA of Rs 427 crore (+21%). Actual PBDIT of about Rs 371 crore (+5.3%) fell below that weakest corner. One outlet put profit at Rs 220 crore, which matches no other report, so I use Rs 217.1 crore. The scenarios were illustrations, and I publish the comparison so you can judge how they held up.
PositionalCalls WhatsApp channel
Berger results, then the next company
- The Berger price reaction once verified
- Base-to-beat tables for results still due
- Links to every updated Q2 FY27 page
What do standalone and half-year numbers show for Berger Paints?
Standalone profit fell 7.3% to Rs 163.31 crore while consolidated rose 5.2%, so subsidiaries and associates added about Rs 54 crore against about Rs 30 crore a year ago (my calculation).
| Line | Q2 FY26 | Q2 FY27 | Change |
|---|---|---|---|
| Standalone net profit, Rs crore | 176.3 | 163.31 | -7.3% |
| Consolidated net profit, Rs crore | About 206 | 217.1 | +5.2% |
| Consolidated minus standalone, Rs crore | About 30 | About 54 | About +79% |
| Standalone revenue growth | Not applicable | +11.9% | Slower than consolidated +13.2% |
| H1 standalone profit, Rs crore | 470.0 | 532.0 | +13.2% |
Cite this table: PositionalCalls, “Berger Paints Standalone Versus Consolidated, as of 5 November 2026”.
The parent paint business is growing revenue at 11.9% but profit is lower, which fits the margin squeeze. The extra contribution from subsidiaries lifts the consolidated figure. I did not find a segment breakdown, so I do not say which subsidiary drove it.
Which Berger Paints figures differ across sources?
The Berger Paints Q2 results appear as profit of Rs 217.1, Rs 217 and Rs 220 crore, and the share close as Rs 510.20 or a rise of 2% or 4%. Use the exact filing line and one source.
| Figure | Version A | Version B | What to do |
|---|---|---|---|
| Q2 FY27 net profit | Rs 217.1 crore (+5.2%; Investywise, Business Today) | Rs 220 crore (Sahi headline) | Use Rs 217.1 crore |
| Profit basis | Consolidated Rs 217.1 crore | Standalone Rs 163.31 crore | Say which one you quote |
| Q2 PBDIT | About Rs 370.7 crore (my derivation) | Not in the reports I read | Check the filing |
| Q2 FY26 profit base | Rs 206.4 crore (+5.2% implies this) | Rs 206 crore (rounded in my preview) | Rounding only |
| Share close | Rs 510.20 (Business Today) | “Over 2%” in the same report | Wait for the NSE close |
| H1 profit | Rs 622.1 crore | Q1 405 plus Q2 217.1 equals Rs 622.1 crore | Reconciles |
Cite this table: PositionalCalls, “Berger Paints Definition-Trap Table, as of 5 November 2026”.
What changed and when: on 5 November 2026 the consolidated base moved from about Rs 206 crore to a reported Rs 217.1 crore. Quote Q2 growth as +5.2% consolidated and -7.3% standalone, and never mix the two.
EBITDA versus profit
Berger reports PBDIT, profit before depreciation, interest and tax, which is close to EBITDA. PBDIT rose about 5.3% while consolidated profit also rose 5.2%, so below-the-line costs did not change the picture this quarter.
What did Berger Paints management say about prices and costs?
Management plans price increases from November, said raw material prices are not easing and called the performance consistent in a seasonally soft quarter, as reported by Whalesbook and Sahi.
| Item | What was reported | Source | Check in the filing |
|---|---|---|---|
| Pricing | Price increases planned from November 2026 | Sahi; Whalesbook | Size and timing in the call |
| Costs | Input-cost inflation; no easing in raw materials | Whalesbook | Gross margin line |
| Marketing | Heavy spend on the festive campaign | Whalesbook | Other expenses |
| Growth driver | Industrial and construction chemicals | Whalesbook | Segment note |
| Volume growth | Not found | Not applicable | Investor presentation |
Cite this table: PositionalCalls, “Berger Paints Management Commentary, as of 5 November 2026”.
How do the Berger Paints Q2 results compare with other paint and consumer results?
Compare Berger on the same measures as other paint companies: revenue growth, PBDIT margin and profit basis. Raw-material costs and festive spending affect the whole sector.
Berger’s sales rose about 13% while profit grew about 5%, and the paint sector outlook page compares it with the other listed paint makers and the new entrant. See our pages on Asian Paints Q2 results, Marico Q2 results and Titan Q2 results; they cover other companies, so only the method carries over. The Q2 results calendar and the earnings calendar list the companies that have reported.
If you plan to sell shares after a move like this, our guide to capital gains tax on shares explains how gains and losses are taxed. It is general information, not tax advice.
What should you watch next after the Berger Paints Q2 results?
After the Berger Paints Q2 results, watch six lines: the margin against 11.6%, the November price increases, raw-material costs, volume growth, standalone profit and the Q3 results date.
| What to watch | Mark to compare | Why it matters |
|---|---|---|
| PBDIT margin | About 11.6% in Q2; 16.9% in Q1; 12.4% a year ago | The line that held profit back |
| Price increases | Planned from November 2026 | Margin recovery depends on them |
| Raw material costs | No easing, per reports | Biggest swing factor |
| Volume growth | Not found for Q2 | Check the investor presentation |
| Standalone profit | Rs 163.31 crore, -7.3% | Parent business under pressure |
| Q3 FY27 results date | Not announced as of 5 November 2026 | Confirm on the exchange page |
Cite this table: PositionalCalls, “Berger Paints Next-Quarter Watchlist, as of 5 November 2026”.
Results-day checklist for the next quarter
- Confirm the date on the BSE or NSE announcement page.
- Open the consolidated statement before any headline.
- Take both periods from the same source and basis.
- Check PBDIT margin against 11.6% and 12.4%.
- Check whether profit is consolidated or standalone.
- Read the notes for exceptional items.
- Write your own plan before the price moves.
What it costs: reading a filing is free; trading adds brokerage, securities transaction tax and other charges, so check your broker’s current schedule. Scam warning: on results days fake “result alert” groups and sure-shot tips circulate. Nobody can guarantee a gain.
What do most people miss about the Berger Paints Q2 results?
- Sales growth hid a margin fall. Revenue rose 13.2% but the margin slipped below last year’s weak base.
- H1 looks better than Q2. H1 profit is up 19.3%, Q2 only 5.2%.
- Standalone fell. The 7.3% fall is hidden if you read only consolidated profit.
- Q2 is seasonally weak. Profit fell 46.4% from Q1, against about 34.6% a year ago.
- The price reports conflict. Rs 510.20 does not match a rise of just over 2%.
- My PBDIT is derived. Open the filing before quoting it.
Analyst’s note: how to think about this quarter
- What stands out (reasoning): in the Berger Paints Q2 results the margin, not volume or revenue, set the outcome.
- Easy to miss: the quarter-on-quarter profit fall of 46.4% is sharper than last year’s, which points to a larger cost squeeze this time.
- What would change the view: price increases lifting the margin above 14% in Q3.
- Caution: one quarter does not fix a long-term value. This page gives no target or recommendation.
- Reader action: match each profit line to its basis before comparing.
Bottom line
Known: the Berger Paints Q2 results show consolidated profit of Rs 217.1 crore (+5.2%), revenue of Rs 3,200.4 crore (+13.2%) and standalone profit of Rs 163.31 crore (-7.3%), reported on 5 November 2026.
Not known yet: the verified close, volume growth, estimate changes and the Q3 date.
Next read: the Q2 results calendar, which lists the companies reporting next.
Part of the earnings coverage.
PositionalCalls WhatsApp channel
Never miss the next results summary
- Filing-day numbers, stamped and sourced
- Base-to-beat tables before results
- Price reactions and corrections as they happen
Berger Paints Q2 results: frequently asked questions
What was Berger Paints net profit in the Q2 results for FY27?
Berger Paints reported consolidated net profit of Rs 217.1 crore for the quarter ended 30 September 2026, up 5.2% from about Rs 206 crore. Consolidated revenue rose 13.2% to Rs 3,200.4 crore. Standalone profit fell 7.3% to Rs 163.31 crore.
When were the Berger Paints Q2 results announced?
The Berger Paints Q2 results came on Thursday, 5 November 2026, matching the date in Kotak Neo’s weekly list. The first reports I found carry timestamps around 2:46 PM IST. I could not confirm the exact filing time.
Why do the Berger Paints Q2 results show only 5% profit growth on 13% sales growth?
The margin slipped. My calculation from the half-year figures puts Q2 PBDIT near Rs 370.7 crore, an 11.6% margin against 12.4% a year ago. Reports cite input-cost inflation and higher marketing spend. Price increases are planned from November.
How did the Berger Paints share price react to the Q2 results?
Business Today reported a close of Rs 510.20 against Rs 484.50 but called the rise over 2%; those numbers imply about 5.3% (my calculation). NewsBytes said shares jumped 4% intraday. I did not confirm the official NSE close.
Why is Berger Paints standalone profit down while consolidated profit is up?
Standalone profit fell 7.3% to Rs 163.31 crore, while consolidated rose 5.2% to Rs 217.1 crore. The gap between them is about Rs 54 crore, against about Rs 30 crore a year ago (my calculation), so subsidiaries and associates contributed more.
What was Berger Paints EBITDA and margin in Q2 FY27?
Berger reports PBDIT, which is close to EBITDA. H1 PBDIT was Rs 978.11 crore (up 11.1%); less Q1’s Rs 607.4 crore, Q2 is about Rs 370.7 crore (+5.3%) at an 11.6% margin. This is my derivation, so check it against the filing.
How did Berger Paints perform in the first half of FY27?
H1 consolidated revenue was Rs 6,784.1 crore (+12.5%) and profit Rs 622.1 crore (+19.3%). Standalone H1 profit was Rs 532.0 crore (+13.2%). Q1’s Rs 405 crore plus Q2’s Rs 217.1 crore equals the reported Rs 622.1 crore.
What did Berger Paints management say about prices and costs?
As reported by Whalesbook and Sahi, the company plans price increases from November because raw material prices are not easing, and cited heavy marketing spend. Managing Director Abhijit Roy called the performance consistent in a seasonally soft quarter.
Did the Berger Paints Q2 results beat estimates?
I found no Q2 FY27 consensus estimate, so I cannot call a beat or miss. Against my own preview guide, revenue read in line and the margin, EBITDA and profit growth read weaker. One outlet’s Rs 220 crore profit does not match other reports.
Why is Berger Paints Q2 profit so much lower than Q1?
Q2 is seasonally weaker because of the monsoon. Revenue fell 10.7% from Q1 and profit 46.4% (my calculation). Last year revenue fell 11.7% and profit about 34.6%, so the fall in profit was sharper this year.
Sources
- BSE corporate announcements: where the Berger Paints filing appears.
- NSE corporate filings: financial results: the same filing on NSE.
- Business Today: Berger Paints Q2 earnings, 5 November 2026.
- Whalesbook: Berger Paints Q2 net profit rises 5.2%, 5 November 2026.
- Investywise: Berger Paints Q2 FY27 results, 5 November 2026.
- Sahi: Berger Paints Q2 net profit and price hikes, 5 November 2026.
- NewsBytes: Berger Paints shares jump 4%, 5 November 2026.
- multibagg.ai: Berger Paints Q2 FY27 board meeting, November 2026.
- Also named, not linked: Kotak Neo, Upstox, Free Press Journal.
Disclosure: PositionalCalls.com is not a SEBI-registered research analyst or investment adviser. Investments in securities markets are subject to market risks. Read all related documents carefully before investing. Returns are never guaranteed. PositionalCalls is an independent research and education site founded by Shubham Chaudhary. Nothing here is a recommendation, target or investment advice. How I researched this: for the Berger Paints Q2 results I read reports by Business Today, Whalesbook, Investywise, Sahi and NewsBytes, noted where sources differ, and marked every derived number as my calculation. I did not open the exchange filing. Figures are as of Thursday, 5 November 2026, 5:30 PM IST.

Shubham Chaudhary is the founder of PositionalCalls, an independent Indian stock market research website. He writes company fundamentals, quarterly results analysis, IPO analysis and sector research for NSE and BSE listed companies, with a focus on banking stocks, insurance and long-term value investing. Every article is built from primary sources such as RBI, SEBI, NSE and BSE filings and company annual reports, and states its risks plainly in simple language for retail investors.
Coverage areas Our research standards- Numbers checked against NSE, BSE and SEBI filings
- Risks and limits stated in every article
- No paid promotions or broker tie-ups
- Articles updated when new filings arrive