
Earnings · Zydus Lifesciences Limited
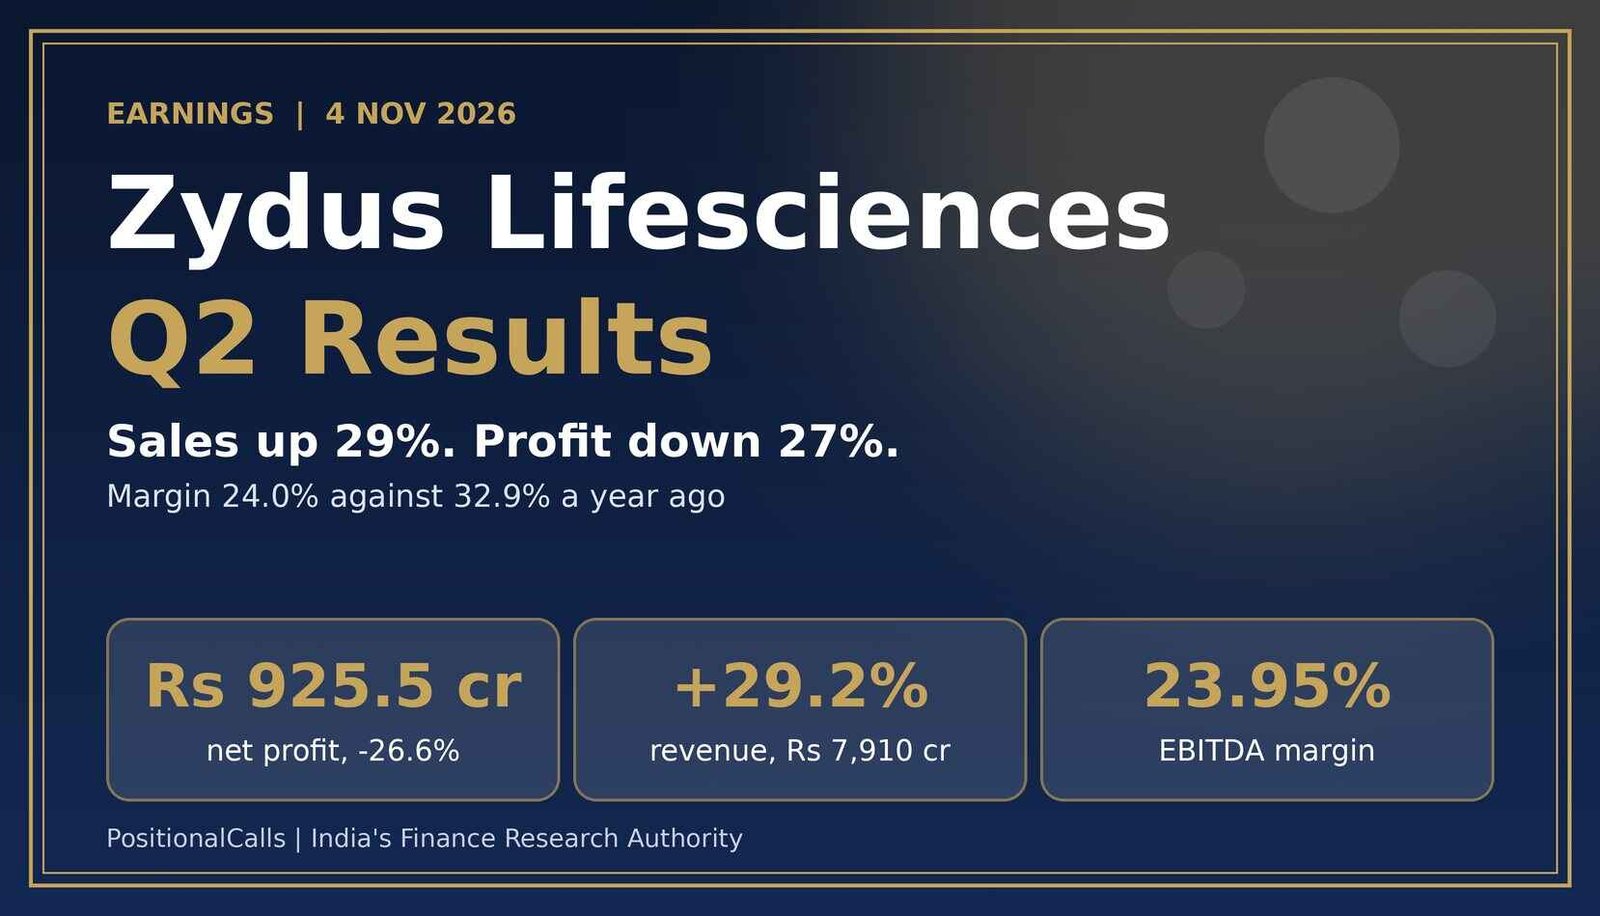
The Zydus Lifesciences Q2 results, reported on 4 November 2026, show sales up 29% and profit down 27%. Here is what changed, why the margin fell, how the shares moved, and what to watch next.
Quick answer
Zydus Lifesciences Q2 results: consolidated net profit fell 26.6% to Rs 925.5 crore on 4 November 2026, even as revenue rose 29.2% to Rs 7,909.6 crore. The EBITDA margin dropped to 23.95% from 32.9%. The shares fell about 4% that day after touching a 52-week high.
Latest update (Thursday, 5 November 2026, 11:00 AM IST): The results are out and this page is now the full analysis. Profit was Rs 925.5 crore, EBITDA about Rs 1,895 crore and the margin 23.95%. I found no 5 November share price or brokerage estimate changes yet; both will be added when they appear.
Earlier entries:
- Wednesday, 4 November 2026: Zydus Lifesciences reported Q2 FY27; shares fell about 4% from a 52-week high.
- Sunday, 1 November 2026, 4:20 PM IST: Preview published with a base of about Rs 1,259 crore profit and a margin near 33%.
Key takeaways
- Profit: the Zydus Lifesciences Q2 results show Rs 925.5 crore, down 26.6% year on year and 1.5% below Q1 FY27 (my calculation).
- Revenue: Rs 7,909.6 crore, up 29.2%, led by North America (+21%), India (+18%) and international markets (+33%).
- Margin: EBITDA margin 23.95% against 32.9%; management cites about 25.5% adjusted for saroglitazar launch costs.
- Shares: high of Rs 1,266.60, then about Rs 1,188 at 3:59 PM, down 4.2% (Trendlyne snapshot).
- Watch: FY27 margin guidance of 24% or higher, the saroglitazar approval and FDA observations at Moraiya.
In plain words: The Zydus Lifesciences Q2 results show much more medicine sold, but it kept a smaller share of each rupee as profit. The company is spending more on research, staff and the launch of a new drug, so the profit fell even though sales jumped. A margin is simply profit before interest, tax and depreciation divided by sales.
Data note: Figures are as of Thursday, 5 November 2026, 11:00 AM IST. Results come from the company’s press release dated 4 November as published by Orissa Diary, and from reports by Upstox, Business Standard, Zeebiz, Equitypandit, Investing.com and Whalesbook; I did not open the exchange filing itself. Correction: the 1 November preview used Rs 1,258.6 crore profit and Rs 2,018 crore EBITDA for Q2 FY26, taken from 2025 reports. The comparatives in this year’s results are Rs 1,260.9 crore and about Rs 2,015 crore, and this page uses them. Derived numbers are my calculation.
What were the Zydus Lifesciences Q2 results for FY27?
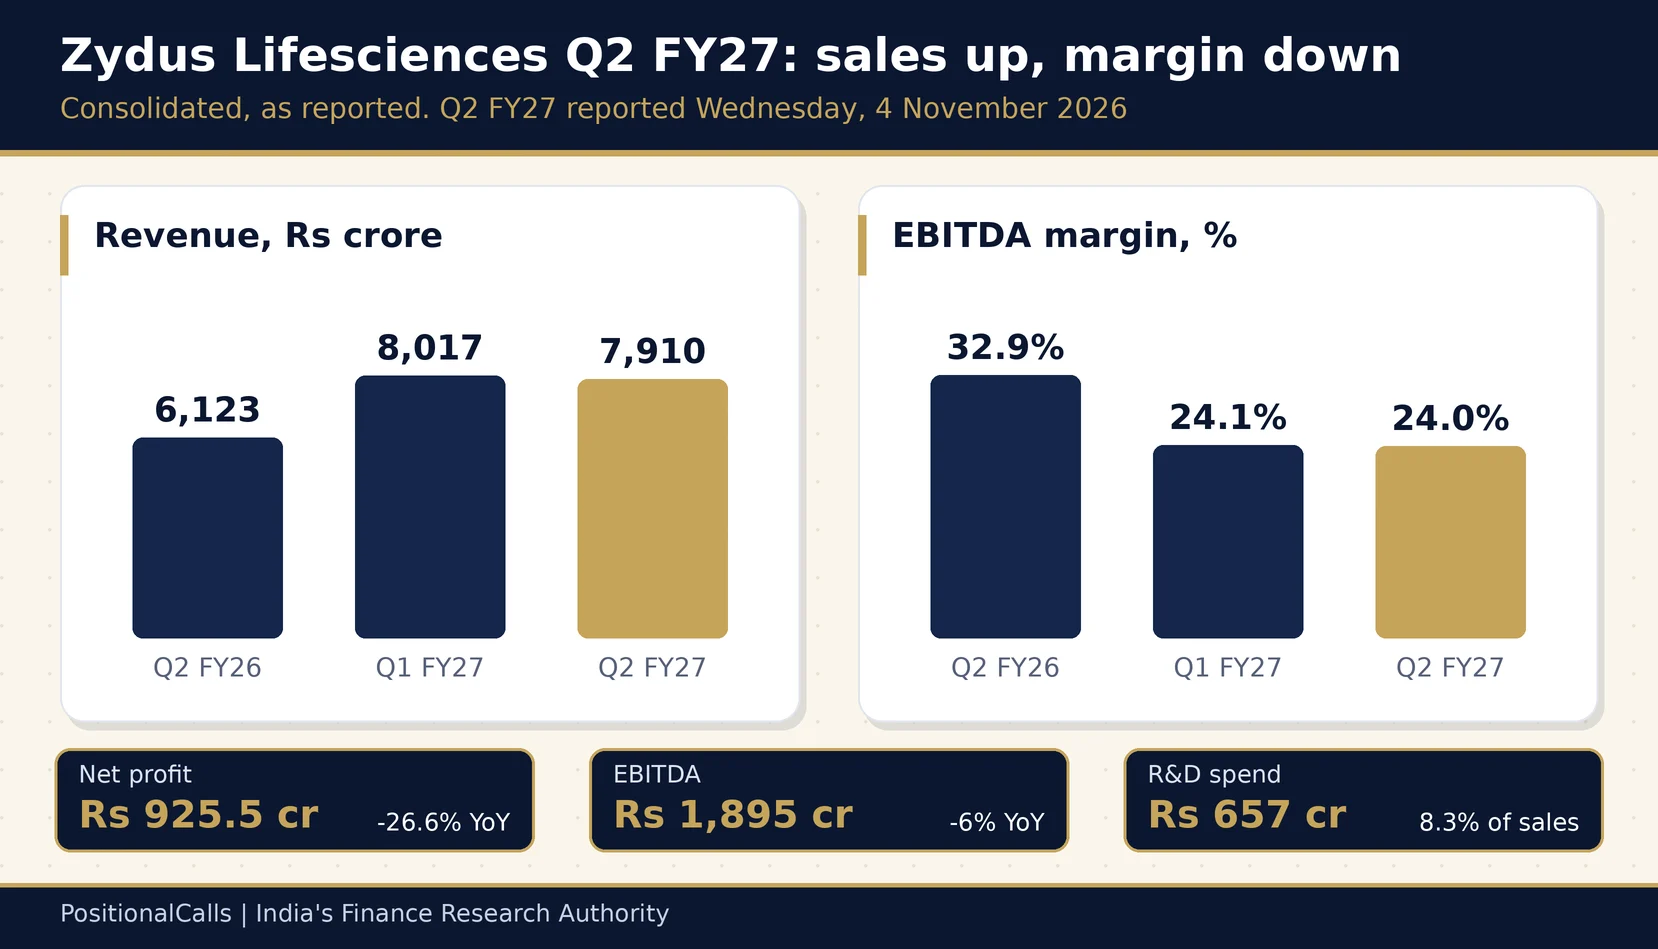
Zydus Lifesciences reported revenue of Rs 7,909.6 crore (+29.2%), EBITDA of about Rs 1,895 crore (-6%) and net profit of Rs 925.5 crore (-26.6%) for the quarter ended 30 September 2026.
| Measure (consolidated) | Q2 FY26 (Sep 2025) | Q1 FY27 (Jun 2026) | Q2 FY27 (Sep 2026) | Change |
|---|---|---|---|---|
| Revenue from operations, Rs crore | 6,123.2 | 8,017 | 7,909.6 | +29.2% YoY; -1.3% QoQ |
| EBITDA, Rs crore | about 2,015 | 1,929.4 | about 1,894.5 | -6.0% YoY; -1.8% QoQ |
| EBITDA margin | 32.9% | 24.1% | 23.95% | -8.95 points YoY |
| Net profit, Rs crore | 1,260.9 | 939.8 | 925.5 | -26.6% YoY; -1.5% QoQ |
| R&D spend, Rs crore | 482 | Not in sources | 657.3 | +36.4% YoY |
| Half-year (H1) net profit, Rs crore | 2,727.7 | Not applicable | 1,885.9 | -30.9% YoY |
Cite this table: PositionalCalls, “Zydus Lifesciences Q2 FY27 Results Table, as of 5 November 2026”.
The Zydus Lifesciences Q2 results date was Wednesday, 4 November 2026, as listed in Kotak Neo’s weekly list, and the company’s press release carries the same date.
In my calculation, the Zydus Lifesciences Q2 results show revenue 1.3% lower than in Q1 FY27 and profit 1.5% lower, so the quarter looks like a flat follow-on from Q1 rather than a new low. The year-on-year fall looks large because Q2 FY26 was an unusually profitable base, which the preview flagged.
H1 FY27 revenue was Rs 15,926.6 crore (Rs 8,017 crore plus Rs 7,909.6 crore, my calculation), up 25% per the company. H1 profit of Rs 1,885.9 crore is 30.9% below the Rs 2,727.7 crore of H1 FY26. One report printed the prior-year figure as Rs 2,722.7 crore; adding Q1 FY26’s Rs 1,466.8 crore and Q2 FY26’s Rs 1,260.9 crore gives Rs 2,727.7 crore, so that is the one used here.
Zydus Lifesciences net profit Q2 FY27: why did it fall 27% when revenue rose 29%?
In the Zydus Lifesciences Q2 results, the EBITDA margin fell 8.95 points to 23.95%, which cost about Rs 708 crore of EBITDA and outweighed the Rs 588 crore the extra sales added (my calculation).
Zydus Lifesciences EBITDA Q2 FY27: the bridge
| EBITDA bridge, Rs crore | Amount | How I got it |
|---|---|---|
| Q2 FY26 EBITDA | about 2,015 | 32.9% of Rs 6,123.2 crore |
| Sales effect | +588 | Extra revenue of Rs 1,786.4 crore at last year’s 32.9% margin |
| Margin effect | -708 | Rs 7,909.6 crore times the 8.95-point margin fall |
| Q2 FY27 EBITDA | about 1,895 | Rs 2,015 crore plus 588 minus 708, rounded |
Cite this table: PositionalCalls, “Zydus Lifesciences EBITDA Bridge, as of 5 November 2026”.
Costs. Whalesbook reported that total expenses rose about 51% in the quarter, and the company said R&D rose to Rs 657.3 crore, which is 36.4% above Rs 482 crore a year earlier (my calculation). Whalesbook also pointed to higher employee costs. Management says launch spending for saroglitazar, its first self-discovered new chemical entity, weighs on the margin, and that the margin would be about 25.5% without it (as summarised by Investing.com).
Below EBITDA. The gap between EBITDA and profit also widened. In Q2 FY27 profit was 48.9% of EBITDA (Rs 925.5 crore on Rs 1,894.5 crore); a year earlier it was 62.6% (Rs 1,260.9 crore on Rs 2,015 crore). The Rs 969 crore gap this time is 28% larger than last year’s Rs 754 crore (my calculation). I did not find the split between depreciation, interest, tax, other income and one-offs, so open the statement to see which line grew.
Worked example: what each point of margin is worth
On Q2 FY27 revenue of Rs 7,909.6 crore, one percentage point of margin is Rs 79.1 crore of EBITDA. The 8.95-point fall is therefore about Rs 708 crore. The 1.55 points that management attributes to saroglitazar launch costs (25.5% less 23.95%) are about Rs 123 crore (my calculation).
How did the Zydus Lifesciences share price react to the Q2 results?
After the Zydus Lifesciences Q2 results, the shares touched a 52-week high of Rs 1,266.60 on 4 November, then fell about 6% from that peak and were near Rs 1,188 in a 3:59 PM snapshot, down 4.2% on the previous close of Rs 1,240.60.
| Time on 4 Nov 2026 | Price, Rs | Move vs previous close | Source |
|---|---|---|---|
| Early session high | 1,266.60 | +2.1% | Upstox (NSE) |
| 12:50 PM | 1,185.20 | -4.34% (vs 1,239.00) | DSIJ |
| 1:00 PM | 1,192.90 | -3.84% | Upstox (NSE) |
| 1:25 PM | 1,197.50 | -3.35% (vs BSE close 1,239.00) | Business Standard (BSE) |
| 1:40 PM | 1,197.20 | -3.50% | Equitypandit (NSE) |
| About 2:00 PM | 1,182.05 | -4.59%, intraday low in that report | The Hawk |
| 3:59 PM snapshot | 1,188.10 | -4.23% | Trendlyne |
Cite this table: PositionalCalls, “Zydus Lifesciences Results-Day Price Path, as of 5 November 2026”.
The previous close differs by exchange: Rs 1,240.60 on the NSE and about Rs 1,239.00 on the BSE, which is why the percentage falls differ slightly. From the high of Rs 1,266.60 to Rs 1,188.10, the fall was 6.2% (my calculation). The NSE market value was about Rs 1.19 lakh crore, and the stock was still up about 30% in 2026 on 4 November.
The 3:59 PM figure is a data-site snapshot and not the official closing price. I did not find a 5 November price, any volume figure or a brokerage estimate change when I wrote this, so this section will be updated when they are published. This is a description of the move, not a forecast and not a recommendation.
Why did a stock at a 52-week high fall?
Before the Zydus Lifesciences Q2 results the shares were near their 52-week high, so the market had priced in a good quarter. A profit fall of 27% and a margin below 24% gave buyers less to defend the price. The July 2026 pattern was different: shares rose on Q1 results, per Kotak Neo, despite a 36% profit fall, because that profit was close to what was expected. A price move reflects expectations as much as results.
Did the Zydus Lifesciences Q2 results beat or miss expectations?
One aggregator reported profit of about Rs 930 crore against an estimate of Rs 900 crore, a modest beat of about 3%. I found no second estimate, so this is not a consensus.
The preview gave a reading guide with cut-offs built from the Q1 FY27 and Q2 FY26 marks. Here is how the Zydus Lifesciences Q2 results score against it. The guide was an illustration, and I am publishing the comparison so you can see how it held up.
| Mark | Preview guide (stronger / in line / weaker) | Actual Q2 FY27 | Reading |
|---|---|---|---|
| Revenue growth | Above 35% / 25-35% / below 25% | +29.2% | In line |
| EBITDA margin | Above 27% / 24-27% / below 24% | 23.95% | Weaker, by 0.05 points |
| EBITDA | Above Rs 2,100 cr / 1,900-2,100 / below 1,900 | Rs 1,894.5 cr | Weaker, by Rs 5.5 crore |
| Net profit | Above Rs 1,100 cr / 900-1,100 / below 900 | Rs 925.5 cr | In line |
| Exceptional items | Net gain / small net expense / large net expense | Teva receipt and Astellas payment reported; net effect not found | Unclear |
Cite this table: PositionalCalls, “Zydus Lifesciences Preview Guide Versus Actual, as of 5 November 2026”.
The honest reading is mixed: revenue and profit landed inside the middle band, while the margin and EBITDA sat just under the weaker line. Profit of Rs 925.5 crore is also 2.8% above the one reported Rs 900 crore estimate (my calculation). Q1 FY27 was different: profit of Rs 940 crore missed an estimate of about Rs 1,000 crore, according to Sahi.
PositionalCalls WhatsApp channel
Zydus Lifesciences results, then the next company
- The Zydus price reaction as it updates
- Base-to-beat tables for results still due
- Links to every updated Q2 FY27 page
What drove Zydus Lifesciences revenue growth in Q2 FY27?
In the Zydus Lifesciences Q2 results, North America formulations grew 21% to Rs 3,315 crore, India formulations 18% to Rs 1,884 crore and international markets 33% to Rs 1,001 crore; together they were about 79% of revenue (my calculation).
| Segment | Q2 FY27, Rs crore | Growth YoY | Share of revenue |
|---|---|---|---|
| North America formulations | 3,315 (US$347 million in constant currency) | +21%; +7% QoQ | 41.9% |
| India formulations | 1,884.4 | +18%; branded +19% | 23.8% |
| International markets formulations | 1,001 | +33% | 12.7% |
| API | 149 | +1% | 1.9% |
| Alliances and others | 59.2 | +374% | 0.7% |
| Rest (wellness, medtech, other) | about 1,501 | Not in sources | 19.0% |
Cite this table: PositionalCalls, “Zydus Lifesciences Segment Table, as of 5 November 2026”.
The last row is my calculation by subtraction: Rs 7,909.6 crore less the five lines above. Consumer wellness and medtech were reported as growing, but I did not find their rupee figures, so this row also holds anything not named. Management said branded sales are now 16% of US revenue, which it reads as a shift towards a more differentiated portfolio.
North America grew 7% on Q1 FY27 and is now 41.9% of revenue, against 40% in the Q1 mix the preview used (my calculation). That is a small step back towards the US-heavy mix of Q2 FY26, when it was 45%. India’s share of 23.8% is close to Q1’s 23%.
Which Zydus Lifesciences figures differ across sources?
The Zydus Lifesciences Q2 results appear as profit of Rs 925.5, 926 and 930 crore, and the year-ago base as Rs 1,258.6, 1,260.9 and 1,261 crore. Use one source for both periods and say whether the figure is rounded.
| Figure | Version A | Version B | What to do |
|---|---|---|---|
| Q2 FY27 net profit | Rs 925.5 crore (press release: Rs 9,255 million) | Rs 926 crore (Upstox); Rs 930 crore (Sahi, rounded) | Use Rs 925.5 crore |
| Q2 FY26 net profit | Rs 1,260.9 crore (this year’s comparative) | Rs 1,258.6 crore (2025 reports; used in my preview) | Use Rs 1,260.9 crore; the preview base was slightly off |
| Q2 FY26 EBITDA | About Rs 2,015 crore (32.9% margin) | Rs 2,018 crore (32.96%, 2025 report) | Use about Rs 2,015 crore |
| H1 FY26 net profit | Rs 2,727.7 crore (Equitypandit; sums from the two quarters) | Rs 2,722.7 crore (Zeebiz) | Use Rs 2,727.7 crore |
| H1 FY27 versus Q1 plus Q2 | Rs 1,885.9 crore reported | Rs 939.8 crore plus Rs 925.5 crore is Rs 1,865.3 crore | Rs 20.6 crore gap in my calculation; check the filing |
| Margin | 23.95% reported (24.0% rounded) | 25.5% adjusted for saroglitazar costs (management) | Compare reported with reported |
Cite this table: PositionalCalls, “Zydus Lifesciences Definition-Trap Table, as of 5 November 2026”.
What changed and when: on 4 November 2026 the base for Q2 FY26 profit became Rs 1,260.9 crore in the company’s comparison, up from the Rs 1,258.6 crore quoted in 2025 coverage. The difference is Rs 2.3 crore, small but visible in growth rates: the fall is 26.6% on the new base and 26.5% on the old one (my calculation).
The H1 gap is the one to check. If Q1 FY27 profit was Rs 939.8 crore, H1 should be Rs 1,865.3 crore, not Rs 1,885.9 crore. A restatement, a different profit line or a typo could explain it. I have not opened the statement, so I am not guessing the reason.
EBITDA versus profit
EBITDA leaves out interest, depreciation and tax, so profit moves at its own pace. In Q2 FY27 EBITDA fell 6% but profit fell 26.6%. That gap is why the statement of profit and loss matters more than the EBITDA headline on this result.
What did management say about margin, guidance and the saroglitazar launch?
Management kept FY27 EBITDA margin guidance at 24% or higher, expects about US$100 million of annual saroglitazar commercialisation spend and targets a US launch in March 2027, per Investing.com’s summary.
I read this from Investing.com’s summaries of the call and slides, not the transcript or presentation themselves, so treat the wording as secondary. Management said it is among the first filers on saroglitazar in the US, the FDA has accepted the filing for review and launch timing depends on patent litigation. It does not expect meaningful revenue from the product in FY28, with a larger ramp from FY29 and more realistically FY30.
What does a 24% FY27 margin imply for the second half?
Assumptions: H1 FY27 revenue Rs 15,926.6 crore and EBITDA Rs 3,823.9 crore (Q1 plus Q2, my calculation); H2 revenue of Rs 15,800 crore, which is about twice Q2’s revenue and is my illustration, not a forecast. H1 margin is 24.0%.
| H2 FY27 EBITDA margin | H2 EBITDA, Rs crore | FY27 EBITDA, Rs crore | FY27 margin |
|---|---|---|---|
| 22% | 3,476 | 7,300 | 23.0% |
| 24% | 3,792 | 7,616 | 24.0% |
| 26% | 4,108 | 7,932 | 25.0% |
Cite this table: PositionalCalls, “Zydus Lifesciences FY27 Margin Scenarios, as of 5 November 2026”.
Because H1 is already at 24.0%, a 24% full-year margin needs H2 at 24% or better on this revenue. A 22% half would pull the year to 23.0%, below the guided floor. That is the line to test when Q3 FY27 results arrive. The scenarios hold everything else constant and are not predictions.
Astellas, Teva and FDA: which items in the Zydus Lifesciences Q2 results sit outside the margin story?
Three items need a look in the notes: a US$120 million payment to Astellas, a Rs 146.8 crore Teva settlement receipt and five FDA observations at Moraiya.
| Item | What was reported | Source | Check in the filing |
|---|---|---|---|
| Astellas | Agreed to pay US$120 million: US$45 million one-time costs and US$75 million licence fees | Equitypandit, citing the filing | Where it sits: expense, intangible or both |
| Teva settlement | Zydus Worldwide DMCC received Rs 146.8 crore (about US$15.5 million) | Equitypandit | Exceptional item or other income |
| FDA, Moraiya | Five observations after inspection of 5 to 13 October; under 30% of US revenue; no filings from the site | Equitypandit; Investing.com call summary | Observation closure timeline |
| FDA, SEZ II Ahmedabad | One observation | Zeebiz | Closure timeline |
| Transdermal approval | Approval received 21 October 2026 | Investing.com slides summary | Product and launch date |
| Pembrolizumab biosimilar | US FDA accepted the BLA, reported as the first Keytruda biosimilar filing | Whalesbook | Filing date and review goal date |
Cite this table: PositionalCalls, “Zydus Lifesciences Non-Operating Items, as of 5 November 2026”.
The Astellas and Teva items are single-source here and I could not tell whether they hit the Q2 profit line. Please read them in the exceptional-items and notes sections before using them in your own estimate. Net debt to equity was 0.19 times and net debt to EBITDA 0.62 times at 30 September 2026, per the company.
How do the Zydus Lifesciences Q2 results compare with other pharma results?
Compare Zydus on the same measures as other pharma companies: revenue growth, EBITDA margin and profit definition. Margin pressure from launch and R&D spending is not unique to one company.
Pharma results this season include Sun Pharma Q2 results, with Divi’s Laboratories Q2 results listed for Saturday, 7 November. For Zydus’s own history, the earlier Zydus Lifesciences Q3 results page covers the Q3 FY26 quarter. The Q2 results calendar and the earnings calendar list the companies that have reported.
If you plan to sell shares after a result like this, our guide to capital gains tax on shares explains how gains and losses are taxed. It is general information, not tax advice.
What should you watch next after the Zydus Lifesciences Q2 results?
After the Zydus Lifesciences Q2 results, watch six lines: the H2 EBITDA margin against the 24% floor, the saroglitazar approval, FDA closure at Moraiya, North America growth, R&D intensity and the notes on Astellas and Teva.
| What to watch | Mark to compare | Why it matters |
|---|---|---|
| EBITDA margin | 23.95% in Q2; 24.0% in H1 | Guidance is 24% or higher for FY27 |
| Saroglitazar decision | Regulatory goal date in November 2026; targeted March 2027 launch | Launch spend rises before sales do |
| North America formulations | Rs 3,315 crore; US$347 million | About 42% of revenue |
| R&D spend | Rs 657.3 crore; 8.3% of revenue | Up 36% on a year ago |
| Moraiya observations | Five observations; under 30% of US revenue | A resolution removes a regulatory overhang |
| Q3 FY27 results date | Not announced as of 5 November 2026 | Confirm on the exchange page |
Cite this table: PositionalCalls, “Zydus Lifesciences Next-Quarter Watchlist, as of 5 November 2026”.
Results-day checklist for the next quarter
- Confirm the date on the BSE or NSE announcement page.
- Open the consolidated statement before any headline.
- Take both periods from the same source.
- Compare EBITDA margin with 23.95% and the 24% guidance floor.
- Read exceptional items and the notes.
- Check whether Rs 1,260.9 crore is still the year-ago base.
- Write your own plan before the price moves.
What it costs: reading a filing is free; trading adds brokerage, securities transaction tax and other charges, so check your broker’s current schedule. Scam warning: on results days fake “result alert” groups and sure-shot tips circulate. Nobody can guarantee a gain.
What do most people miss about the Zydus Lifesciences Q2 results?
- Profit was near the preview’s middle band. The margin, not revenue, was the miss.
- Q2 matched Q1. Profit was only 1.5% lower than the previous quarter.
- The base was high. A margin of 32.9% a year ago set a hard comparison.
- Sources differ slightly. Rs 925.5, 926 and 930 crore describe the same profit.
- The H1 sum does not match. Q1 plus Q2 is Rs 20.6 crore below the reported half-year profit.
- The price is a snapshot. There is no official close in my sources.
Analyst’s note: how to think about this quarter
- What stands out (reasoning): in the Zydus Lifesciences Q2 results sales rose 29% but the margin fell 8.95 points, and that alone cost about Rs 708 crore of EBITDA.
- Easy to miss: the second-half margin must hold 24% for the guidance to stand, and H1 is already at that line.
- What would change the view: a margin below 24% in Q3, or an FDA action at Moraiya.
- Caution: one quarter does not fix a long-term value, and this page gives no target or recommendation.
- Reader action: match each figure to one source and open the notes on Astellas and Teva.
Bottom line
Known: the Zydus Lifesciences Q2 results show profit of Rs 925.5 crore (-26.6%), revenue of Rs 7,909.6 crore (+29.2%) and a 23.95% EBITDA margin on 4 November 2026.
Not known yet: the official closing price, the 5 November reaction, estimate changes, the exact one-off line items and the Q3 date.
Next read: the Q2 results calendar, which lists the companies reporting next.
Part of the earnings coverage, including pharma results.
PositionalCalls WhatsApp channel
Never miss the next results summary
- Filing-day numbers, stamped and sourced
- Base-to-beat tables before results
- Price reactions and corrections as they happen
Zydus Lifesciences Q2 results: frequently asked questions
What was Zydus Lifesciences net profit in the Q2 results for FY27?
Zydus Lifesciences reported consolidated net profit of Rs 925.5 crore for the quarter ended 30 September 2026, down 26.6% from Rs 1,260.9 crore a year earlier. Revenue from operations rose 29.2% to Rs 7,909.6 crore. Profit was 1.5% below Q1 FY27 (my calculation).
When were the Zydus Lifesciences Q2 results announced?
The Zydus Lifesciences Q2 results came on Wednesday, 4 November 2026, matching the date in Kotak Neo’s weekly list. The company’s press release is dated 4 November. I could not confirm the exact filing time from the reports I read.
Why do the Zydus Lifesciences Q2 results show a profit fall when revenue rose 29%?
The EBITDA margin fell to 23.95% from 32.9%, and total expenses rose about 51% according to one report. R&D rose 36% to Rs 657.3 crore (my calculation). Management says saroglitazar launch spending is part of the gap and puts the adjusted margin near 25.5%.
How did the Zydus Lifesciences share price react to the Q2 results?
The shares hit a 52-week high of Rs 1,266.60 early on 4 November, then fell. A 3:59 PM snapshot on Trendlyne showed Rs 1,188.10, down 4.23% from Rs 1,240.60. That is a last-traded snapshot, not the official close. I found no 5 November price yet.
What was Zydus Lifesciences EBITDA and margin in Q2 FY27?
EBITDA was about Rs 1,895 crore (Rs 18,945 million), down 6% from about Rs 2,015 crore, at a margin of 23.95% against 32.9%. Q1 FY27 EBITDA was Rs 1,929.4 crore at 24.1%, so the margin was almost flat on the previous quarter.
Did the Zydus Lifesciences Q2 results beat estimates?
One aggregator, Sahi, reported profit of about Rs 930 crore against an estimate of Rs 900 crore, a modest beat. I found no second estimate, so treat it as one house’s figure, not a consensus. Compare any estimate on the same profit line before you judge.
What is Zydus Lifesciences FY27 margin guidance?
Management kept FY27 EBITDA margin guidance at 24% or higher, per Investing.com’s summary of the presentation, and said the adjusted Q2 margin was about 25.5% after saroglitazar launch costs. H1 FY27 margin was 24.0% (my calculation), so H2 needs 24% or better.
What are the Astellas and Teva items in the Zydus Lifesciences filing?
Equitypandit reported that Zydus agreed to pay Astellas US$120 million (US$45 million one-time costs and US$75 million licence fees) and that Zydus Worldwide DMCC received Rs 146.8 crore after settling with Teva. This is single-source, so check the notes to the results.
What did the US FDA find at Zydus Lifesciences’s plants?
Inspections at the SEZ II Ahmedabad and Moraiya formulation facilities ended with one and five observations, per Zeebiz and the call. Management said Moraiya is under 30% of US revenue and has no pending filings. A transdermal product was approved on 21 October 2026.
When is the Zydus Lifesciences saroglitazar launch and the next results date?
Investing.com’s summary says the company targets a March 2027 US launch after a November 2026 regulatory goal date, with little revenue before FY29. The Q3 FY27 results date has not been announced as of 5 November 2026.
Sources
- BSE corporate announcements: where the Zydus Lifesciences filing appears.
- NSE corporate filings: financial results: the same filing on NSE.
- Zydus Lifesciences press release, Q2 and H1 FY27, as published by Orissa Diary, 4 November 2026.
- Upstox: Zydus Lifesciences Q2 results, 4 November 2026.
- Business Standard: Zydus Lifesciences Q2 net profit falls 26.6%, 4 November 2026.
- Zeebiz: Zydus Lifesciences Q2 results, 4 November 2026.
- Equitypandit: Zydus Lifesciences shares slide after Q2 profit drop, 4 November 2026.
- Investing.com: Zydus Q2 FY27 slides, 4 November 2026.
- Also read and named, not linked: DSIJ, The Hawk, Whalesbook, Sahi, Trendlyne, Kotak Neo, Taxguru.
Disclosure: PositionalCalls.com is not a SEBI-registered research analyst or investment adviser. Investments in securities markets are subject to market risks. Read all related documents carefully before investing. Returns are never guaranteed. PositionalCalls is an independent research and education site founded by Shubham Chaudhary. Nothing here is a recommendation, target or investment advice. How I researched this: for the Zydus Lifesciences Q2 results I read the company’s press release text as published by Orissa Diary and reports by Upstox, Business Standard, Zeebiz, Equitypandit, Investing.com and Whalesbook, noted where sources differ, and marked every derived number as my calculation. I did not open the exchange filing. Figures are as of Thursday, 5 November 2026, 11:00 AM IST.

Shubham Chaudhary is the founder of PositionalCalls, an independent Indian stock market research website. He writes company fundamentals, quarterly results analysis, IPO analysis and sector research for NSE and BSE listed companies, with a focus on banking stocks, insurance and long-term value investing. Every article is built from primary sources such as RBI, SEBI, NSE and BSE filings and company annual reports, and states its risks plainly in simple language for retail investors.
Coverage areas Our research standards- Numbers checked against NSE, BSE and SEBI filings
- Risks and limits stated in every article
- No paid promotions or broker tie-ups
- Articles updated when new filings arrive