
Earnings · State Bank of India
State Bank of India reported its September-quarter numbers on 3 November 2026. Here are the profit with its one-off gain, margin, asset quality, the share-price reaction and what changed since the preview.
Quick answer
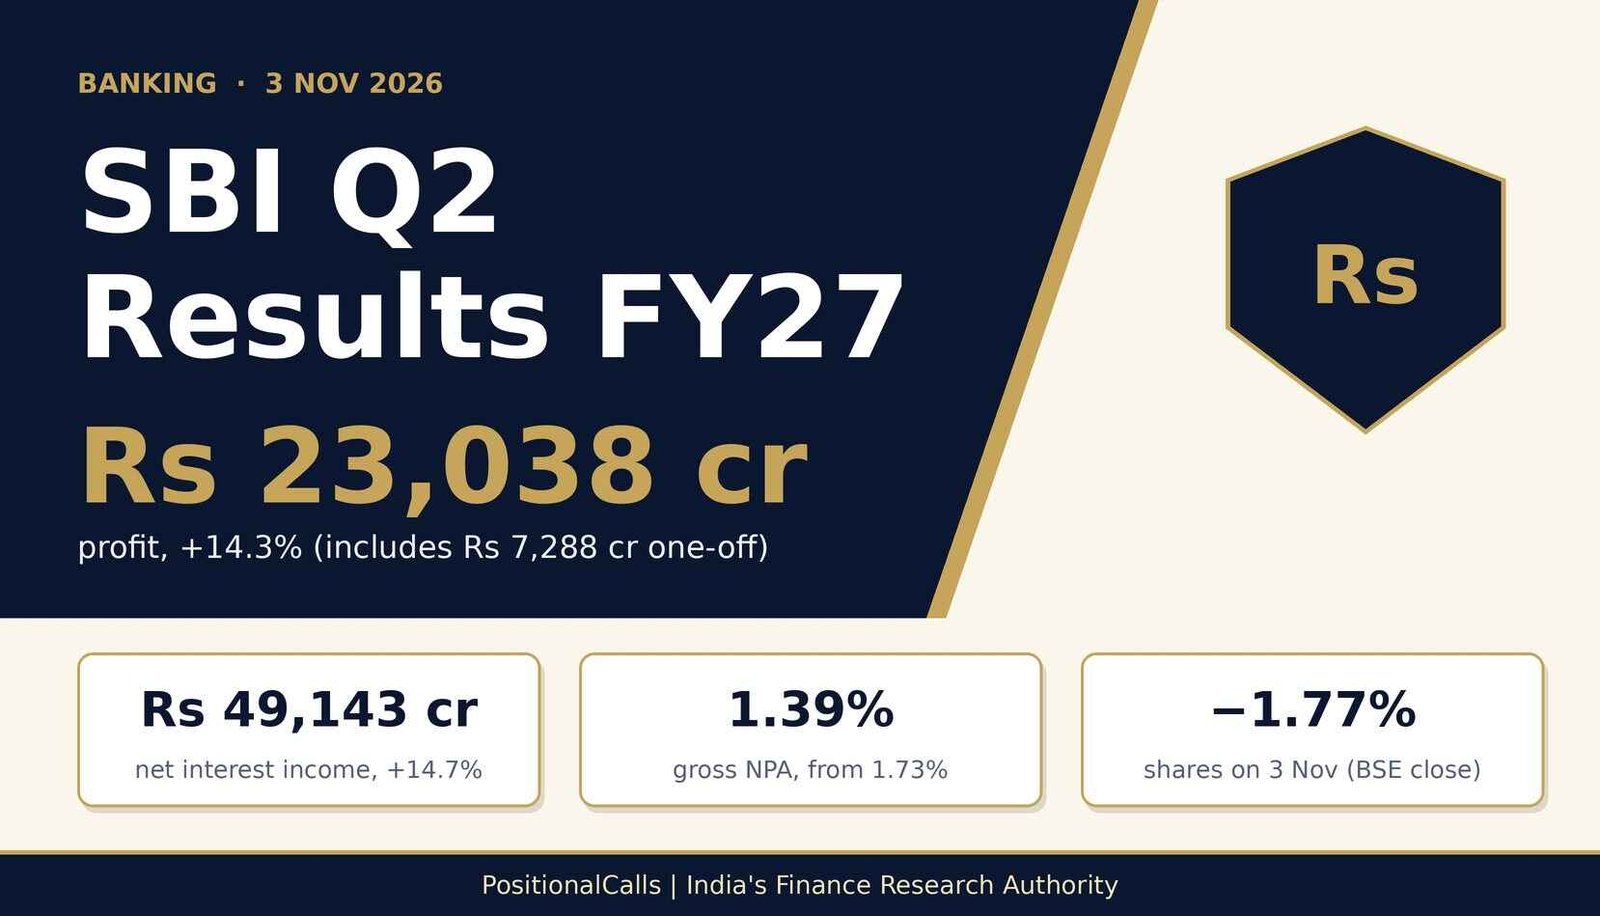
SBI Q2 results were announced on Tuesday, 3 November 2026: standalone net profit rose 14.3% to Rs 23,038 crore, including a Rs 7,288 crore stake-sale gain. Net interest income rose 14.7% to Rs 49,143 crore, gross NPA fell to 1.39%, and the shares closed 1.77% lower at Rs 969.55 on BSE.
Latest update (Wednesday, 4 November 2026, 12:30 PM IST): The results are out. Business Standard published its report at 2:10 PM IST on Tuesday, 3 November: profit Rs 23,038 crore (+14.3%) including a Rs 7,288 crore gain, NII Rs 49,143 crore (+14.7%), gross NPA 1.39%. The shares closed 1.77% lower at Rs 969.55 on BSE. Brokerages kept ratings with target changes in both directions. I found no confirmed price for 4 November.
Earlier entries:
- Tuesday, 3 November 2026, 2:48 PM IST: shares quoted at Rs 973.75 on NSE.
- Friday, 30 October 2026, 3:45 PM IST: preview published with the base to beat.
- Monday, 26 October 2026, 7:19 PM IST: PSU Connect reported the 3 November board meeting.
Key takeaways
- Profit: Rs 23,038 crore, +14.3%, with a Rs 7,288 crore stake-sale gain inside.
- Net interest income: Rs 49,143 crore, +14.7%; domestic NIM 3.11%.
- Asset quality: gross NPA 1.39%, net NPA 0.36%.
- Underlying: removing both years’ gains, growth is about 1% before tax effects (my illustration).
- Shares: closed 1.77% lower at Rs 969.55 on BSE on 3 November.
In plain words: SBI is India’s largest bank. “Standalone” profit is the bank’s own account. A “one-off” is a gain, like selling shares in a subsidiary, that does not repeat every quarter, so it can make profit growth look bigger or smaller than the trend.
Data note: Figures are as of Wednesday, 4 November 2026, 12:30 PM IST. They come from reports of the bank’s results by Business Standard, Zee Business and others; I did not open the filing itself. Correction: the 30 October preview gave Q2 FY26 net interest income as Rs 42,984 crore and the FY27 loan growth guide as 13% to 15%. Reports of the new results show Rs 42,847 crore and 14% to 15%. Derived numbers are my calculation.
What do the SBI Q2 results show?
SBI reported standalone net profit of Rs 23,038 crore (+14.3%), net interest income of Rs 49,143 crore (+14.7%), domestic NIM of 3.11% and gross NPA of 1.39% for the quarter ended 30 September 2026.
| Measure (standalone) | Q2 FY27 | Q2 FY26 | Change | Q1 FY27 (change) |
|---|---|---|---|---|
| Net profit, Rs crore | 23,038 | 20,160 | +14.3% | 21,121 (+9.1%) |
| Net interest income, Rs crore | 49,143 | 42,847 | +14.7% | 46,992 (+4.6%) |
| Interest expense, Rs crore | 82,875.70 | 76,669.87 | +8.1% | Not in sources |
| Domestic NIM | 3.11% | 3.09% | +2 bps | 3.00% (+11 bps) |
| Whole-bank NIM | 2.94% | Not in sources | Not applicable | 2.86% (+8 bps) |
| Gross NPA ratio | 1.39% | 1.73% | −34 bps | 1.47% (−8 bps) |
| Net NPA ratio | 0.36% | 0.42% | −6 bps | 0.38% (−2 bps) |
| Gross advances, Rs lakh crore | 52.08 | Not in sources | About +18% | 50.47 (+3.2%) |
| Deposits, Rs lakh crore | 62.77 | Not in sources | +12.27% | 60.06 (+4.5%) |
Cite this table: PositionalCalls, “SBI Q2 Results: Key Numbers Table, as of 4 November 2026”.
SBI net profit Q2 FY27 is Rs 23,038 crore on a standalone basis, and SBI NIM Q2 FY27 is 3.11% for domestic operations.
The SBI Q2 results beat the preview’s marks on NII, margin and asset quality, but profit growth needs a careful read because both the year-ago quarter and this quarter contain stake-sale gains. The next section sizes them.
Half-year profit was Rs 44,159 crore, which is Q1’s Rs 21,121 crore plus Q2’s Rs 23,038 crore (my calculation). Compared with Rs 39,320 crore in H1 FY26, which the preview built from Rs 19,160 crore and Rs 20,160 crore, that is +12.3%.
Business Standard reports that non-interest income fell nearly 5% to Rs 19,066 crore on lower treasury income, even after the Rs 7,288 crore gain. Interest income did the heavy lifting: interest expense rose 8.1% while NII grew 14.7%.
Is SBI’s Q2 profit growth real? The Rs 7,288 crore one-off
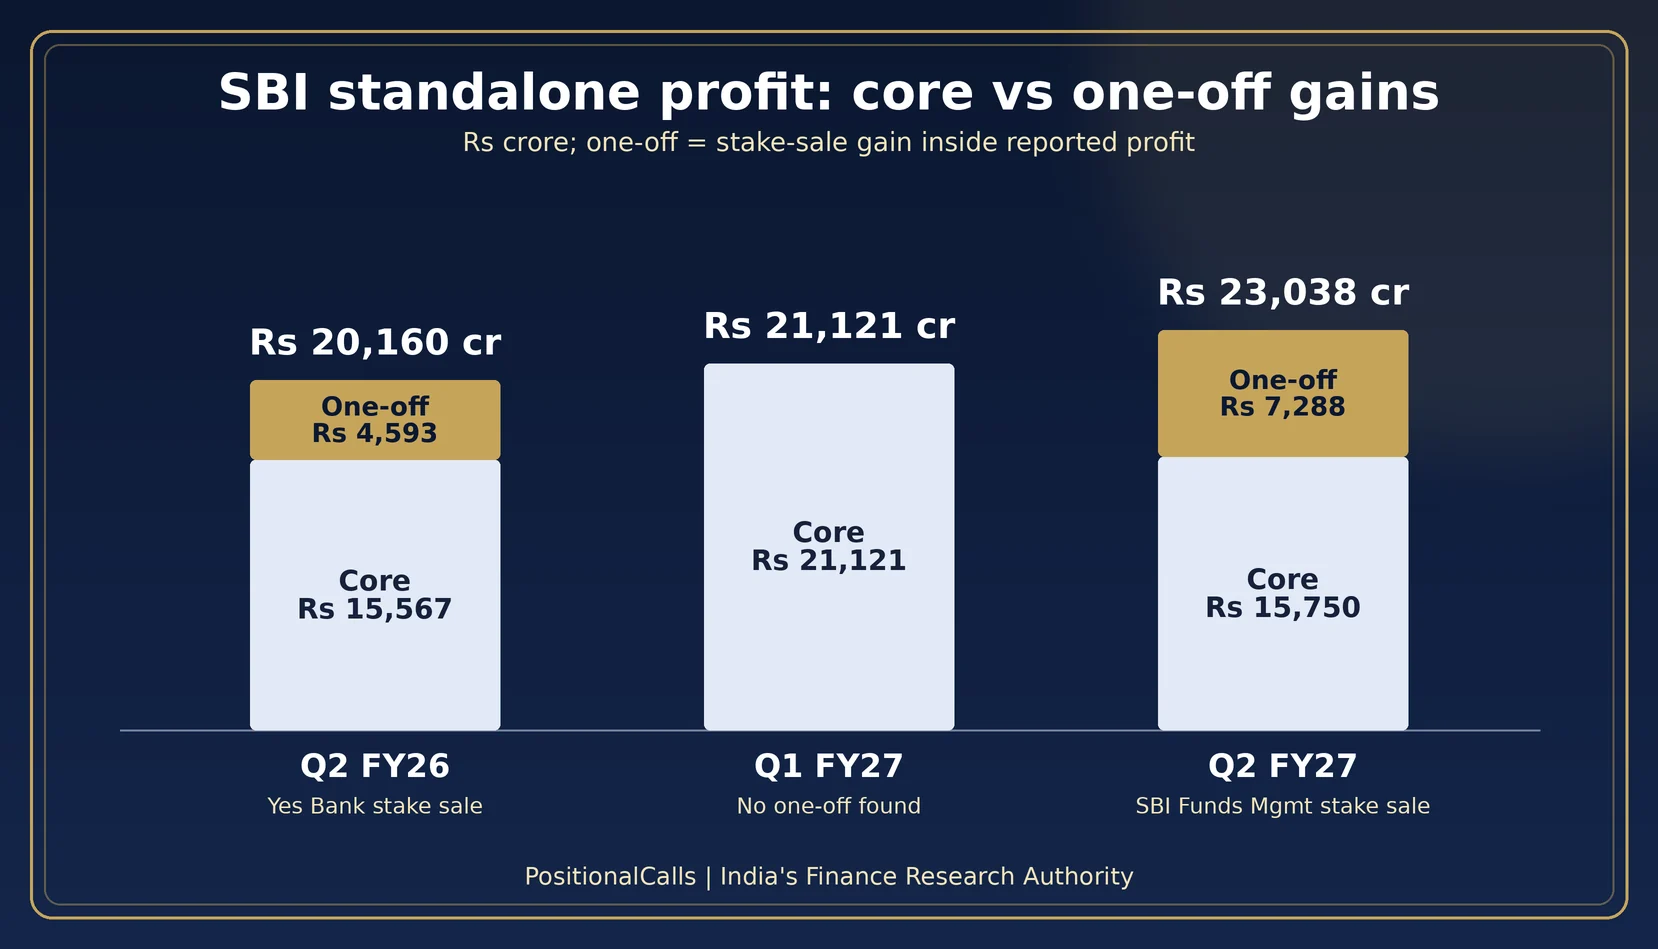
SBI’s Q2 FY27 profit includes a Rs 7,288 crore gain from selling its stake in SBI Funds Management, against Rs 4,593 crore of Yes Bank stake-sale gain in Q2 FY26. Stripping both, profit growth is about 1% before tax effects.
In the preview I warned that the Q2 FY26 base held a Rs 4,593 crore one-off. The new quarter has an even larger one. Business Standard also notes SBI sold shares in the NSE public offering and realised about Rs 2,400 crore, which went to reserves and did not touch the profit and loss account.
| Version | Q2 FY26, Rs crore | Q2 FY27, Rs crore | Growth |
|---|---|---|---|
| As reported | 20,160 | 23,038 | +14.3% |
| Gain removed, no tax effect (illustration) | 15,567 | 15,750 | +1.2% |
| Gain removed after an assumed 25.17% tax (illustration) | 16,723 | 17,584 | +5.1% |
Cite this table: PositionalCalls, “SBI Q2 Results: One-Off Adjusted Profit Illustration, as of 4 November 2026”.
These rows are not SBI’s adjusted profit. The sources do not say whether the Rs 7,288 crore is before or after tax, the tax rate is my assumption, and other items are not adjusted. The point is direction: the reported +14.3% flatters the underlying growth, and the filing notes carry the exact effect.
The cleaner read is net interest income, which carries no stake-sale gain: +14.7% on the year and +4.6% on the quarter. Provisions also helped. Business Standard says provisions for bad loans fell 33% to Rs 2,759 crore, and a separate post cites total provisions of Rs 4,216 crore, 21.9% below the Rs 5,400 crore base in the preview (my calculation).
SBI Q2 results analysis: how did it compare with the base to beat?
Against the preview’s marks, SBI came in stronger on domestic NIM, net interest income, gross NPA and profit, and in line on loan-growth guidance. Profit sat above the top scenario, partly because of the one-off.
| Mark from the preview | Preview cut-off | Actual in Q2 FY27 | Reading |
|---|---|---|---|
| Domestic NIM | Stronger at 3.00% or higher | 3.11% | Stronger |
| Net interest income | Stronger above Rs 47,932 crore | Rs 49,143 crore | Stronger |
| Gross NPA ratio | Stronger at 1.47% or lower | 1.39% | Stronger |
| Standalone net profit | Stronger above Rs 21,755 crore | Rs 23,038 crore (includes one-off) | Stronger |
| FY27 loan growth guide | In line if unchanged | 14% to 15% maintained | In line |
Cite this table: PositionalCalls, “SBI Q2 Results: Reading-Guide Scorecard, as of 4 November 2026”.
The preview’s scenario table topped out at +5% on Q1, or Rs 22,177 crore. The actual Rs 23,038 crore is +9.1% on Q1 (my calculation), above every scenario. The preview also said that if SBI followed the sector it would see a 7 bps margin fall to about 2.93%. Instead domestic NIM rose 11 bps to 3.11%, so SBI went against the sector pattern the previews described.
Did it beat estimates? A CNBC-TV18 poll put profit at Rs 22,859 crore and Business Standard cites Rs 22,619 crore. Rs 23,038 crore is 0.8% and 1.9% above them (my calculation). One Zee Business headline says it missed estimates, without saying which line. I treat the profit beat as dependent on the estimate used. NII of Rs 49,143 crore compares with a reported estimate of Rs 47,901 crore, which is 2.6% higher (my calculation).
The scorecard is a reading aid, not a recommendation. See the Q2 results calendar for how other banks and companies compare.
SBI share price after Q2 results: how did the stock react?
SBI shares closed 1.77% lower at Rs 969.55 on BSE on Tuesday, 3 November 2026 after the results, from a previous close of about Rs 987. I did not find a confirmed price for 4 November.
| Level | Price, Rs | Move | Source |
|---|---|---|---|
| Previous close (implied, my calculation) | About 987 | Not applicable | Derived from the BSE close and its reported fall |
| Intraday, after the results | 979.75 | −0.73% (as reported) | Indian Masterminds |
| Quote at 2:48 PM IST on NSE | 973.75 | About −1.3% (my calculation) | India Infoline |
| BSE close, 3 November | 969.55 | −1.77% | Business Standard |
| Price on 4 November | Not confirmed | Not confirmed | Check NSE or BSE |
Cite this table: PositionalCalls, “SBI Q2 Results: Share Price Reaction Table, as of 4 November 2026”.
What does the fall mean in rupees?
Take 100 shares held through the close, purely as an illustration. From about Rs 987 to Rs 969.55 is a loss of about Rs 1,745 on paper before charges (17.45 times 100, my calculation). It says nothing about whether the quarter was good.
Why did the shares fall after a profit beat?
Reports do not give one reason, so these are my inference. First, the profit includes a Rs 7,288 crore one-off and non-interest income fell. Second, the CASA ratio slipped to 38.32% from 39.63% a year ago. Third, Zee Business reported that HSBC trimmed its forecasts for slower loan growth and lower subsidiary multiples. Fourth, the stock had gained into the results, as Business Today’s preview headline noted, so good news may have been priced in.
What did brokerages say?
Zee Business reported on 4 November that JP Morgan, Morgan Stanley, HSBC, Goldman Sachs and Citi retained their ratings, with target prices moved in both directions. I have not listed their targets: PositionalCalls is not a SEBI-registered research analyst, and this page gives no targets, ratings or recommendations of its own.
SBI NIM Q2 FY27: why did margin rise?
Domestic NIM rose 11 basis points to 3.11% and whole-bank NIM rose 8 basis points to 2.94% because SBI cut its cost of funds, raising $10.9 billion of FCNR(B) deposits to retire dearer borrowings.
| Line | Q2 FY27 | Earlier mark | Note |
|---|---|---|---|
| Domestic NIM | 3.11% | 3.09% (Q2 FY26); 3.00% (Q1 FY27) | Highest of the three |
| Whole-bank NIM | 2.94% | 2.86% (Q1 FY27) | Includes overseas operations |
| H1 FY27 domestic NIM | 3.06% | Not applicable | Zee Business |
| FCNR(B) raised | $10.9 billion | Concessional swap window from June | Business Standard |
| CASA ratio | 38.32% | 39.63% (Q2 FY26) | Down 131 bps on the year |
| Domestic CASA deposits | Rs 22.96 lakh crore | +8.13% on the year | Slower than total deposits |
Cite this table: PositionalCalls, “SBI Q2 Results: Margin and Funding Table, as of 4 November 2026”.
Chairman C S Setty said the fall in the cost of deposits and better yields on advances held up NIM. He also said SBI will keep benefiting from a 25 bps increase in the external-benchmark lending rate, and that further repo hikes could add another 4 to 5 bps, even allowing for deposit-rate adjustments. He said the bank is hopeful of maintaining NIM above 3%.
The funding mix is the caution. Deposits grew 12.27%, but excluding FCNR(B) money growth was about 10.5% to 10.6%, which Setty said is in line with guidance. The ratio of advances to deposits is about 83% (52.08 divided by 62.77, my calculation), and domestic term deposits grew 14.26% against 8.13% for CASA, which pushes the cost of funds up over time. Setty said SBI faces no immediate pressure to raise deposit rates because it holds more than Rs 4 lakh crore of surplus government securities above the statutory minimum.
What do SBI’s asset quality and loan growth look like?
Gross NPA fell to 1.39% and net NPA to 0.36%, both the lowest in more than two decades, while gross advances grew about 18% to Rs 52.08 lakh crore.
| Measure | Q2 FY27 | Q2 FY26 | Q1 FY27 |
|---|---|---|---|
| Gross NPA ratio | 1.39% | 1.73% | 1.47% |
| Net NPA ratio | 0.36% | 0.42% | 0.38% |
| Gross NPAs, Rs crore | 72,529 (−4.9%) | Not in sources | 74,272 (−2.3%) |
| Net NPAs, Rs crore | 18,546 | 18,460 | 19,158 |
| Fresh slippages, Rs crore | 5,227 | 4,754 | 7,046 (single report) |
| Provisions for bad loans, Rs crore | 2,759 (−33%) | About 4,118 (my calculation) | Not in sources |
| Retail gross NPA | 2.06% | Not in sources | 2.16% (single report) |
Cite this table: PositionalCalls, “SBI Q2 Results: Asset Quality Table, as of 4 November 2026”.
Slippages of Rs 5,227 crore are above last year’s Rs 4,754 crore but below Q1’s Rs 7,046 crore, according to one report. Net NPAs in rupee terms were roughly flat on the year (Rs 18,546 crore against Rs 18,460 crore), so the ratio improvement comes mainly from a larger loan base.
| Loan segment | Balance, Rs lakh crore | Growth on the year |
|---|---|---|
| Retail | 18.25 | +14.54% |
| Agriculture | 4.51 | +22.64% |
| SME | 6.61 | +22% |
| Corporate | 14.39 | +16.12% |
| Gross advances | 52.08 | About +18% |
Cite this table: PositionalCalls, “SBI Q2 Results: Loan Growth by Segment Table, as of 4 November 2026”.
Management maintained credit growth guidance of 14% to 15% and deposit growth of 10% to 11%. Setty explained the logic: with nominal GDP growth around 12% to 12.5%, SBI typically grows 3 to 4 points faster. Growth of 18% is well above the guide, so either growth slows or the guide is raised later.
PositionalCalls WhatsApp channel
SBI results, explained in one channel
- Filing alerts with the one-off gains flagged
- Base-to-beat tables for the next banks
- Links to every updated Q2 FY27 page
What changed since the preview: corrections and confirmations
The date and filing window were confirmed, three preview figures were corrected, and the NIM direction turned out opposite to the sector view the preview described.
| Item | Preview (30 Oct 2026) | Now (4 Nov 2026) | Status |
|---|---|---|---|
| Results date | Tuesday, 3 November, one secondary report | Reported on Tuesday, 3 November | Confirmed |
| Filing time | Not announced | Business Standard report at 2:10 PM IST | Partly confirmed |
| Q2 FY26 NII base | Rs 42,984 crore | Rs 42,847 crore in the new comparative | Corrected |
| FY27 loan growth guide | 13% to 15% | 14% to 15%, maintained | Corrected |
| Q2 NIM direction | Sector expected a fall of about 7 bps | Domestic NIM rose 11 bps to 3.11% | Opposite |
| Consolidated profit | Sources conflicted | Not found for Q2 FY27 | Still open |
| SBI-specific estimate | None found | Poll Rs 22,859 crore; Business Standard Rs 22,619 crore | Conflicted |
Cite this table: PositionalCalls, “SBI Q2 Results: Preview-to-Results Changes, as of 4 November 2026”.
I used Rs 42,984 crore as the Q2 FY26 NII in the preview because earlier reports carried it. The new comparative column is Rs 42,847 crore, which makes growth 14.7%; on the old base it would be 14.3% (my calculation). The preview also gave the loan growth guide as 13% to 15% from an August report; Business Standard now reports 14% to 15%. Both are corrected throughout this page.
What did the first half of FY27 show?
Half-year standalone profit was Rs 44,159 crore, up 12.3% on Rs 39,320 crore, and the second quarter supplied 52.2% of it.
| Measure | H1 FY27 | H1 FY26 | Change |
|---|---|---|---|
| Standalone profit, Rs crore | 44,159 | 39,320 | +12.3% |
| Q1 FY27, Rs crore | 21,121 | 19,160 | +10.2% |
| Q2 FY27, Rs crore | 23,038 | 20,160 | +14.3% |
| Q2 share of half-year profit | 52.2% | 51.3% | My calculation |
Cite this table: PositionalCalls, “SBI Q2 Results: Half-Year Table, as of 4 November 2026”.
Both quarters of the half contain stake-sale effects in different amounts, so the half-year growth is not a clean trend either. NSE’s own consolidated profit rose 23% to Rs 2,578 crore in the same season, and SBI sold some NSE shares in its IPO, which Business Standard says went to reserves.
What comes next, and what is the base for Q3?
The marks for Q3 FY27 start from Rs 23,038 crore profit with a one-off inside it, Rs 49,143 crore NII and domestic NIM of 3.11%.
| Mark to watch in Q3 FY27 | Q2 FY27 base | Why it matters |
|---|---|---|
| Standalone profit, Rs crore | 23,038 | Includes Rs 7,288 crore one-off |
| Net interest income, Rs crore | 49,143 | Cleaner earnings line |
| Domestic NIM | 3.11% | Management hopes to stay above 3% |
| Gross NPA / net NPA | 1.39% / 0.36% | Lowest in over two decades |
| Credit growth | About 18% | Guide is 14% to 15% |
| CASA ratio | 38.32% | Falling on the year |
Cite this table: PositionalCalls, “SBI Q2 Results: Q3 Base-to-Beat Table, as of 4 November 2026”.
Two items could change the story. Business Standard’s Also-Read links report that the RBI is likely to meet bank CEOs on preparedness for the expected-credit-loss rollout, and Setty said the root-cause analysis of a data breach at SBI is still under way. I did not read either story in full; treat both as developing. I found no Q3 FY27 results date. Our earnings calendar lists dates once announced.
How to check the SBI Q2 results on NSE or BSE
Open the exchange announcement, find the standalone statement and compare each line with the tables above, same measure and same basis.
- Open the BSE corporate announcements page or NSE corporate filings page and search for State Bank of India.
- Choose the financial results for the quarter and half-year ended 30 September 2026.
- Read the standalone statement before the consolidated one.
- Check net profit, net interest income, other income and provisions.
- Open the notes for the SBI Funds Management gain and its tax effect.
- Read the analyst presentation for NIM, NPAs, slippages and guidance.
- Compare every figure with the year-ago column in the same filing.
What it costs: reading a filing is free. If you trade the stock, brokerage, securities transaction tax and other charges apply, so check your broker’s current schedule. Tax angle: gains and dividends follow the current rules; see capital gains tax on shares or ask a tax adviser. NRI note: FCNR(B) deposits, which lifted SBI’s funding this quarter, are an NRI account type; see our NRI investment guide. Scam warning: fake result-alert groups and sure-shot tips circulate on results days. Nobody can guarantee a gain, and official filings are free.
Checklist: how to read the SBI Q2 results
- Read standalone profit first and find the Rs 7,288 crore gain in the notes.
- Compare profit with Rs 20,160 crore, but also read net interest income against Rs 42,847 crore.
- Check domestic NIM against 3.09% and 3.00%, not whole-bank NIM.
- Compare gross and net NPA with 1.39% and 0.36%.
- Look at slippages as well as ratios.
- Check whether the 14% to 15% credit growth guide moved.
- Treat intraday and closing prices as quotes, not a verdict, and write your own plan.
What are the risks after the SBI Q2 results?
What most people miss about the SBI Q2 results
- Both quarters have a one-off. Rs 4,593 crore last year, Rs 7,288 crore this year.
- Underlying growth is far below 14.3%. Removing both gains leaves about 1% before tax effects, my illustration.
- Net interest income is the clean line. It grew 14.7%.
- SBI’s margin rose against the sector view. The previews expected a fall.
- Net NPAs in rupees were flat. The ratio improved because loans grew.
- A falling price is not a verdict. The stock fell 1.77% on a quarter that beat the poll.
Analyst’s note: how to think about this quarter
- What stands out (reasoning): operating numbers were strong while reported profit was lifted by a one-off, so the two stories differ.
- Easy to miss: the gain in the new quarter is larger than the gain in the base.
- What would change the view: domestic NIM falling below 3%, or gross NPA rising above 1.5%.
- Caution: one quarter does not fix long-term value. This page gives no target or recommendation.
- Reader action: compare net interest income, not just profit, when judging the trend.
Bottom line
Known: the SBI Q2 results show profit of Rs 23,038 crore (+14.3%) including a Rs 7,288 crore gain, NII of Rs 49,143 crore (+14.7%), domestic NIM of 3.11%, gross NPA of 1.39%, and a 1.77% fall in the shares on 3 November.
Not known yet: the 4 November price, consolidated profit and the filing’s exact tax effect on the gain.
Your move: read net interest income and NIM alongside profit.
Next read: the Q2 results calendar, which lists the companies reporting next.
Part of the banking results series, with more in banking earnings.
PositionalCalls WhatsApp channel
Get the next bank results on WhatsApp
- Quick reads on bank and insurer results
- Share-price reaction updates after filings
- Corrections posted openly when figures change
SBI Q2 results: frequently asked questions
When were the SBI Q2 results announced?
SBI announced its Q2 FY27 results on Tuesday, 3 November 2026 after its Central Board met in Mumbai for the quarter and half-year ended 30 September 2026. Business Standard published its report at 2:10 PM IST, so the numbers came out during market hours. I did not open the exchange filing itself.
What do the SBI Q2 results show for net profit?
Standalone net profit rose 14.3% to Rs 23,038 crore from Rs 20,160 crore. It includes a Rs 7,288 crore gain from selling a stake in SBI Funds Management, while the year-ago figure included a Rs 4,593 crore Yes Bank stake-sale gain. Half-year profit was Rs 44,159 crore.
Why did SBI shares fall after the Q2 results?
SBI shares closed 1.77% lower at Rs 969.55 on BSE on 3 November 2026. Reports do not give one reason. Possible factors, my inference, are the one-off gain inside profit, lower non-interest income, a lower CASA ratio and some brokers trimming forecasts for slower loan growth.
Did SBI beat estimates in the Q2 results?
Mostly yes on profit. Rs 23,038 crore compares with a CNBC-TV18 poll of Rs 22,859 crore and a Business Standard figure of Rs 22,619 crore, which is 0.8% and 1.9% above (my calculation). One Zee Business headline says it missed estimates, without naming which line, so treat the beat as estimate-dependent.
What was SBI’s NIM in Q2 FY27?
Domestic net interest margin was 3.11%, up 11 basis points from 3.00% in Q1 FY27, and whole-bank NIM was 2.94%, up 8 basis points. The Q2 FY26 domestic NIM was 3.09%. The chairman said the bank hopes to keep NIM above 3%.
What is SBI’s gross NPA in Q2 FY27?
Gross NPA was 1.39% against 1.47% in Q1 FY27 and 1.73% a year earlier. Net NPA was 0.36% against 0.38% and 0.42%. Gross NPAs were Rs 72,529 crore, and the bank called the ratios the lowest in more than two decades.
What is SBI’s loan growth guidance for FY27?
Management maintained credit growth guidance of 14% to 15% and deposit growth of 10% to 11%, according to Business Standard. Gross advances grew about 18% to Rs 52.08 lakh crore. My preview had said 13% to 15%; I corrected it here.
What was SBI’s net interest income in Q2 FY27?
Net interest income was Rs 49,143 crore, up 14.7% from Rs 42,847 crore. One Business Standard paragraph prints Rs 49,413 crore, which does not match its own 14.7% growth rate, so I treat it as a typo. NII rose 4.6% from Rs 46,992 crore in Q1 FY27.
What did brokerages say after the SBI Q2 results?
Zee Business reported on 4 November that JP Morgan, Morgan Stanley, HSBC, Goldman Sachs and Citi kept their ratings, with target changes in both directions. HSBC cut its target citing slower loan growth and lower subsidiary multiples. This page gives no targets or ratings of its own.
Where can I read the SBI Q2 results filing?
Open the BSE corporate announcements page or the NSE corporate filings page, search for State Bank of India and choose the financial results for 30 September 2026. Read the standalone statement, the notes for the stake-sale gain and the analyst presentation. Ignore forwarded result images and sure-shot calls.
Sources
- BSE corporate announcements: where the SBI filing appears.
- NSE corporate filings: financial results: the same filing on NSE.
- State Bank of India: the bank’s official site.
- Business Standard, 3 and 4 November 2026: SBI Q2 FY27 results, chairman’s comments and closing price.
- Zee Business, 3 and 4 November 2026: NIM, estimate and brokerage reports.
- Indian Masterminds, India Infoline and Markets Today: figures and intraday prices.
- Business Today, 3 November 2026: pre-results coverage; ANI, Business Today and Multibagg for earlier base figures.
Disclosure: PositionalCalls.com is not a SEBI-registered research analyst or investment adviser. Investments in securities markets are subject to market risks. Read all related documents carefully before investing. Returns are never guaranteed. PositionalCalls is an independent research and education site founded by Shubham Chaudhary. Nothing here is a recommendation, target or investment advice. How I researched this: I read reports of the SBI filing from Business Standard, Zee Business and others, took year-ago comparatives from them, noted where sources differ and marked derived numbers as my calculation. I did not open the filing itself. Figures are as of Wednesday, 4 November 2026, 12:30 PM IST.

Shubham Chaudhary is the founder of PositionalCalls, an independent Indian stock market research website. He writes company fundamentals, quarterly results analysis, IPO analysis and sector research for NSE and BSE listed companies, with a focus on banking stocks, insurance and long-term value investing. Every article is built from primary sources such as RBI, SEBI, NSE and BSE filings and company annual reports, and states its risks plainly in simple language for retail investors.
Coverage areas Our research standards- Numbers checked against NSE, BSE and SEBI filings
- Risks and limits stated in every article
- No paid promotions or broker tie-ups
- Articles updated when new filings arrive