
Earnings · Apollo Hospitals
Apollo Hospitals reported higher profit and a wider margin for the September quarter, led by hospitals. This page shows which figures to trust, how the restated base changes growth, what each business earned and where the share price stands.
Quick answer
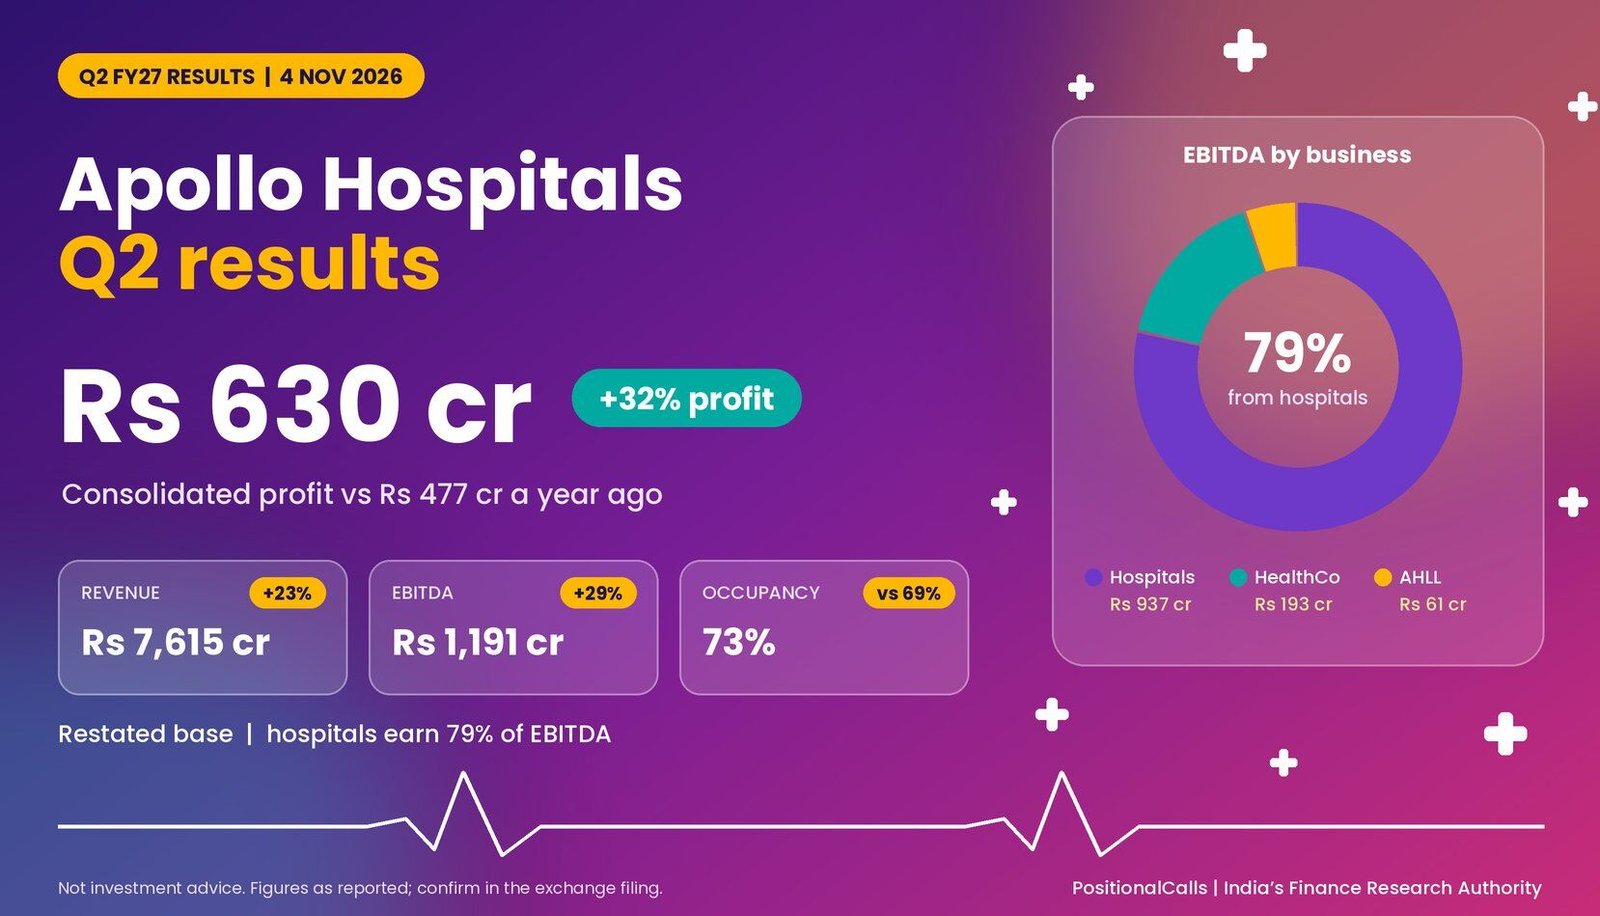
Apollo Hospitals Q2 results for FY27: Apollo Hospitals reported consolidated profit of Rs 630 crore (+32%) on revenue of Rs 7,615 crore (+23%), with EBITDA of Rs 1,191 crore (+29%) at about 15.6%. Occupancy was 73%. Results came on Wednesday, 4 November 2026, after the market closed.
Latest update (Thursday, 5 November 2026, 6:35 AM IST): This page now covers the results announced on Wednesday, 4 November 2026; it replaces the earlier preview. The shares closed at Rs 8,599.50 on 4 November, before the results were public. The market had not opened on 5 November when I wrote this, so there is no confirmed price reaction yet. The analyst and investor call is at 3:00 PM IST on Thursday, 5 November 2026, and I will add its commentary and the first-day price move after the market opens.
Key takeaways
- Profit: Consolidated profit was Rs 630 crore, up 32% from Rs 477 crore. The first half added up to Rs 1,211 crore (+33%), so Q1 was Rs 581 crore.
- Revenue and EBITDA: Revenue was Rs 7,615 crore (+23%). EBITDA was Rs 1,191 crore (+29%), a margin of about 15.6% against 14.9% a year ago (my calculation).
- Hospitals: Healthcare Services gave Rs 937 crore of EBITDA at a 24% margin, about 79% of group EBITDA on 51% of revenue (my calculation). Occupancy was 73% against 69%.
- Restated base: The year-ago revenue now reads Rs 6,189 crore, not the Rs 6,304 crore in last year’s reports. Growth rates on this page use the new base.
- Share price: The shares closed at Rs 8,599.50 on 4 November, up 1.89%, before the results were public. The reaction on 5 November is not available yet.
- Corporate action: The Cloudnine deal for the specialty and fertility businesses was reported as completed, and the hospitals CEO leaves on 14 November.
In plain words: Apollo Hospitals runs hospitals, a pharmacy chain and a digital health platform. EBITDA is profit before interest, tax, depreciation and amortisation. Occupancy is the share of beds in use. A restated figure is an old number rewritten on a new basis, usually after a business is sold or moved out of the results.
Data note: as of Thursday, 5 November 2026, 6:35 AM IST. I could not open the company results filing or presentation, or the Kotak Neo and Zeebiz pages on these results, so figures come from press and data-platform reports of the results. Where sources disagree I show the range and say so. The segment and EBITDA table comes from an AI-generated summary on Multibagg, so I treat single-source lines as reported, not confirmed. The Q1 FY27 base figures of Rs 7,043 crore and Rs 1,092 crore are from August 2026 reports and may have been restated.
Apollo Hospitals Q2 results FY27: key numbers at a glance
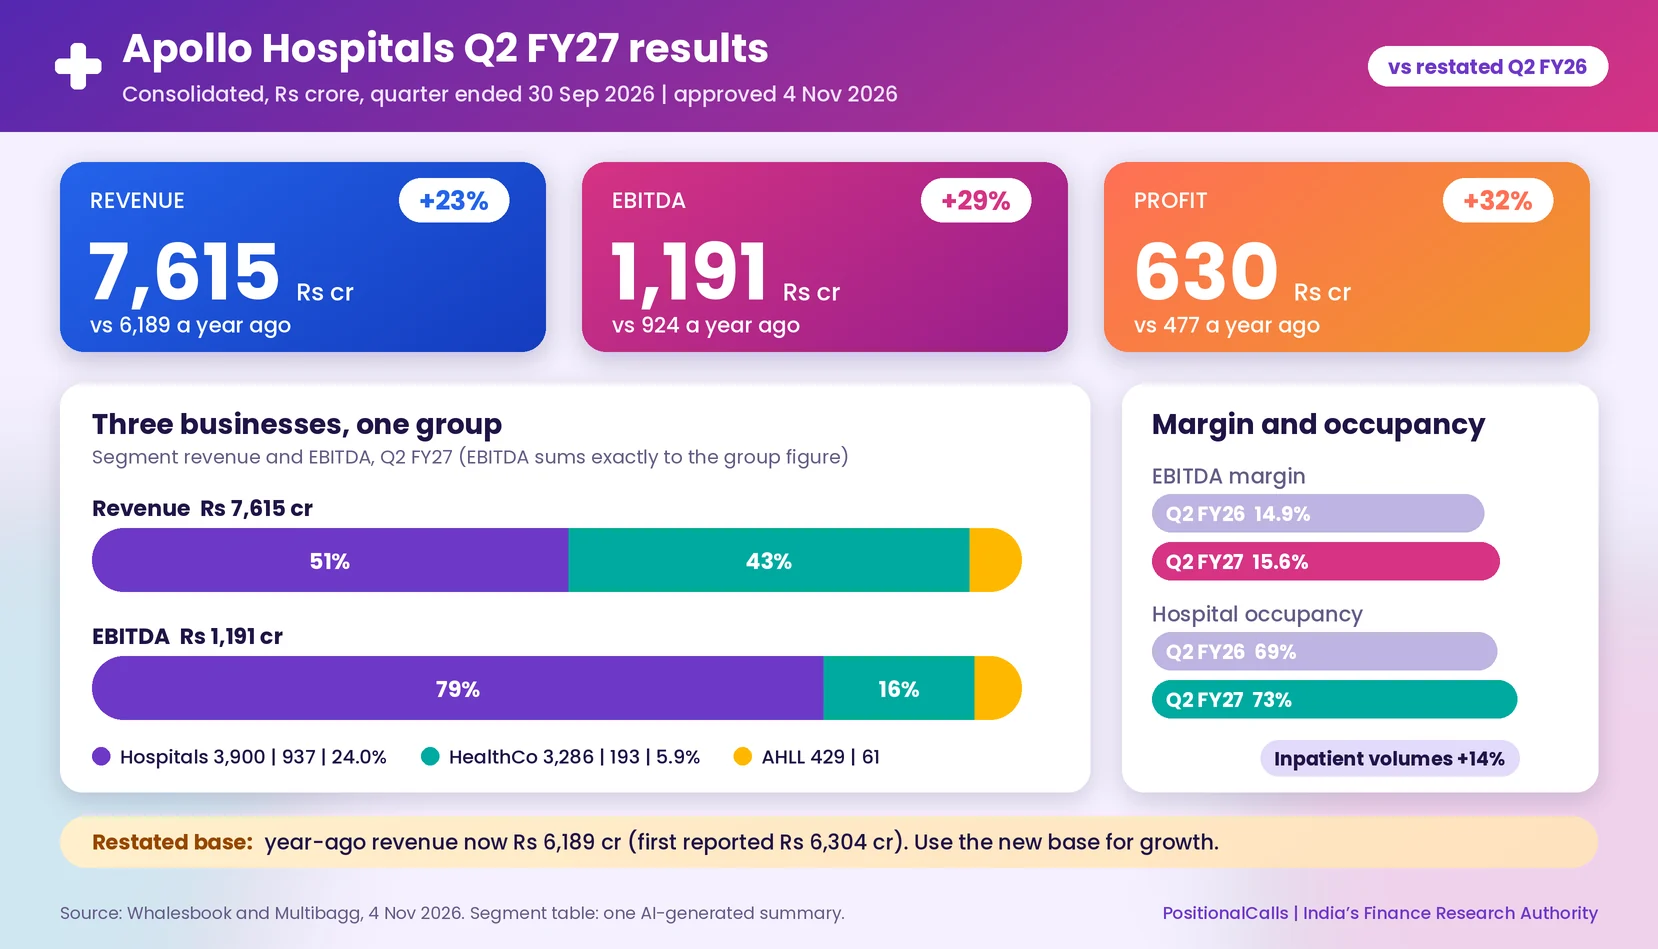
Apollo Hospitals Q2 results show consolidated profit of Rs 630 crore, up 32%, on revenue of Rs 7,615 crore, up 23%, with EBITDA up 29% to Rs 1,191 crore.
| Consolidated, Rs crore | Q2 FY27 | Q2 FY26 (restated) | Change | Why it matters |
|---|---|---|---|---|
| Revenue from operations | 7,615 | 6,189 | +23.0% | All three segments grew about 20% to 23% |
| EBITDA | 1,191 | 924 | +28.9% | Grew faster than revenue |
| EBITDA margin (my calculation) | 15.6% | 14.9% | +0.7 pt | Margin widened by about 0.7 points |
| Profit (consolidated) | 630 | 477 | +32.1% | Headline profit in the reports I read |
| Hospital occupancy | 73% | 69% | +4 pt | Inpatient volumes up 14% |
Cite this table: PositionalCalls, “Apollo Hospitals Q2 Results Key Numbers Table, as of 5 November 2026”.
These Apollo Hospitals Q2 results are for the quarter ended 30 September 2026, approved by the board on 4 November 2026. Check the filing on the BSE corporate announcements page or the NSE corporate filings page. For other large companies in the same weeks, see the Q2 results calendar.
What was Apollo Hospitals’ net profit in Q2 FY27, and which figure is right?
The Apollo Hospitals net profit Q2 FY27 headline is Rs 630 crore, up 32% from Rs 477 crore; the first-half total of Rs 1,211 crore confirms the basis because Rs 581 crore plus Rs 630 crore equals it.
The Apollo Hospitals net profit Q2 FY27 comparison is clean once you pick the right pair. Last year’s reports showed two profit lines for Apollo: Rs 477.2 crore and Rs 494 crore for Q2 FY26, and Rs 581 crore and Rs 610 crore for Q1 FY27. This quarter’s reports use the lower line.
| Profit line | Q2 FY27 | Q2 FY26 | Q1 FY27 | Note |
|---|---|---|---|---|
| Lower line (used here) | 630 | 477 | 581 | 581 + 630 = 1,211, matching the first-half profit reported |
| Higher line (last year’s alternate) | Not reported in this form | 494 | 610 | Last year’s reports only; I did not see it this quarter |
| Diluted EPS, continuing operations | Rs 43.71 | Not stated | Not stated | One summary; not annualised |
Cite this table: PositionalCalls, “Apollo Hospitals Q2 Results Profit Basis Check, as of 5 November 2026”.
The check: Rs 581 crore for Q1 plus Rs 630 crore for Q2 is Rs 1,211 crore, which is exactly the Rs 1,211 crore first-half profit in the reports. Had the higher Q1 line of Rs 610 crore been right, the first half would be Rs 1,240 crore. So the lower line is the consolidated headline (my calculation).
Profit after the EBITDA line: the gap between EBITDA and profit was Rs 561 crore against Rs 447 crore a year ago, a rise of 26%. That gap holds depreciation, interest, tax and minority share together. Profit was 52.9% of EBITDA against 51.6% a year ago, so more of each rupee of EBITDA reached shareholders (my calculation).
Apollo Hospitals restated base: why did last year’s numbers change?
The Apollo Hospitals restated base lowers year-ago revenue to Rs 6,189 crore from Rs 6,304 crore reported last November, and the implied Q1 FY27 revenue is Rs 6,932 crore against Rs 7,043 crore, so the base was lowered by about Rs 110 crore a quarter.
| Line, Rs crore | As first reported | Now implied or shown | Gap (my calculation) |
|---|---|---|---|
| Q2 FY26 revenue | 6,304 | 6,189 | 115 |
| Q2 FY26 EBITDA | 941 | 924 | 17 |
| Q1 FY27 revenue | 7,043 | 6,932 (first half 14,547 less Q2 7,615) | 111 |
| AHLL gross revenue, Q2 FY26 base | 474 | about 358 (429 is up 20%) | about 116 |
Cite this table: PositionalCalls, “Apollo Hospitals Q2 Results Restated Base, as of 5 November 2026”.
The pattern looks like a restatement for continuing operations. Apollo agreed in May 2026 to sell its stakes in Apollo Specialty Hospitals and Apollo Fertility Centre for about Rs 1,550 crore, and one summary this quarter shows diluted earnings per share for continuing operations. If those businesses moved out of the revenue lines, past quarters would be rewritten lower. This is my inference; the filing note will confirm it.
Why it matters: growth rates change with the base. Revenue growth is 23% on the new base but would be about 21% against the old Rs 6,304 crore, and EBITDA growth is 29% against 27% on the old Rs 941 crore (my calculation). Do not mix the old and new bases in one comparison.
Apollo Hospitals EBITDA Q2 FY27: why did it grow 29%? The sales-versus-margin bridge
Apollo Hospitals EBITDA Q2 FY27 was Rs 1,191 crore, and the margin was about 15.6% against 14.9%; extra sales added about Rs 213 crore of EBITDA and the wider margin added about Rs 54 crore, on my bridge.
EBITDA rose Rs 267 crore, from Rs 924 crore to Rs 1,191 crore. I split the rise into what the extra revenue would have earned at last year’s margin, and what the margin change added.
| Step | Rs crore | How I calculated it |
|---|---|---|
| Q2 FY26 EBITDA | 924 | Restated base |
| Sales effect | +213 | Revenue rise of Rs 1,426 crore times the year-ago margin of 14.9% |
| Margin effect | +54 | Q2 FY27 revenue times the margin gain of 0.71 percentage points |
| Q2 FY27 EBITDA | 1,191 | The three steps add up to it |
Cite this table: PositionalCalls, “Apollo Hospitals Q2 Results EBITDA Bridge, as of 5 November 2026”.
About 80% of the EBITDA gain came from growth and about 20% from margin. A Multibagg summary rounds the margin to 16% and sets it against a 15.5% estimate quoted from Zee Business; the exact division gives 15.6%, so the quarter came in a little above that estimate (the estimate is single-source). The margin is also above the 15.5% I calculated for Q1 FY27 on the earlier base.
How did each Apollo business perform in Q2 FY27?
Healthcare Services earned Rs 937 crore of EBITDA at a 24% margin, Apollo HealthCo Rs 193 crore at 5.9%, and Apollo Health and Lifestyle Rs 61 crore, and the three add up exactly to the group figure.
| Segment | Revenue, Rs crore | EBITDA, Rs crore | EBITDA margin | Share of group EBITDA |
|---|---|---|---|---|
| Healthcare Services (hospitals) | 3,900 (+23%) | 937 (+20%) | 24.0% | 79% |
| Apollo HealthCo (pharmacy and digital) | 3,286 (+23%) | 193 | 5.9% | 16% |
| Apollo Health and Lifestyle (gross) | 429 (+20%) | 61 | 14.2% | 5% |
| Total (my sum) | 7,615 | 1,191 | 15.6% | 100% |
Cite this table: PositionalCalls, “Apollo Hospitals Q2 Results Segment Table, as of 5 November 2026”.
The segments add up to the reported consolidated revenue of Rs 7,615 crore and EBITDA of Rs 1,191 crore, which is a good sign that the single summary is internally consistent. Profit by segment: HealthCo Rs 118 crore and Apollo Health and Lifestyle Rs 26 crore (a loss a year ago), leaving about Rs 486 crore for the rest of the group (my remainder, not a reported figure; minority share and group costs may distort it).
Compared with Q1 FY27, the hospital margin slipped from 24.2% to 24.0% and the HealthCo margin rose from 5.7% to 5.9% (my calculation from the Q1 reports; the Q1 segment base may be restated). Apollo 24/7 costs of Rs 91 crore are included in group EBITDA, according to the same summary.
Healthcare Services revenue was Rs 3,169 crore in Q2 FY26, so Rs 3,900 crore is up 23%, which matches the reported growth. In short, hospitals earn about four-fifths of the profit even though pharmacy revenue is almost as large.
PositionalCalls WhatsApp channel
Apollo, Q3 and the next big results
- The base to beat and segment table before the next Apollo result
- Which profit line and base each report is using, flagged clearly
- The first-day price move and call notes the day they appear
What do occupancy, volumes and pricing say about the hospital business?
Occupancy rose to 73% from 69%, inpatient volumes grew 14% and average revenue per patient rose 8%, so the hospital growth came from both more patients and higher revenue per patient.
| Hospital metric | Q2 FY27 | Year ago | Source note |
|---|---|---|---|
| Occupancy | 73% | 69% | Whalesbook, Multibagg and TradingView agree |
| Inpatient volume growth | +14% | – | Multibagg and TradingView |
| Average revenue per patient | Rs 1,86,880 (+8%) | – | Multibagg; one report calls it per occupied bed |
| International patient revenue | +37% | – | Multibagg and TradingView |
| Oncology revenue growth | +28% | – | Single source |
| Gastroenterology and urology growth | +27% and +26% | – | Single source |
| Cardiac and orthopaedic growth | +20% each | – | Single source |
Cite this table: PositionalCalls, “Apollo Hospitals Q2 Results Hospital Metrics, as of 5 November 2026”.
Volume plus price is a healthy mix: the 14% volume rise and 8% rise in revenue per patient together are close to the 23% hospital revenue growth, although some of the growth comes from newer hospitals and a different case mix. I could not see a split between old and new hospitals in a source I could open. Apollo’s Q2 FY27 occupancy of 73% (69% a year earlier) is compared with ICRA’s forecast and with Max and Fortis on the hospital sector outlook 2026 page.
Capacity is the next question. Apollo plans about 5,800 beds over five years. A 180-bed hospital in Sarjapur, Bengaluru was reported as commissioned, and a hospital of about 470 beds in Gurugram is targeted for Q3 FY27. One summary quotes a FY27 hospital revenue growth target of 20%, with established hospitals at 13% to 14% and newer ones at 7%; those pieces do not obviously add up, so I treat them as reported, not confirmed.
How are Apollo HealthCo and Apollo 24/7 doing?
Apollo HealthCo revenue rose about 23% to Rs 3,286 crore with EBITDA of Rs 193 crore, and the network reached 7,662 pharmacies after a net 222 additions in the quarter.
| HealthCo measure | Q2 FY27 | Reference point |
|---|---|---|
| Revenue | Rs 3,286 crore | Rs 2,661 crore in Q2 FY26 (+23.5%, my calculation) |
| EBITDA and margin | Rs 193 crore, 5.9% | Q1 FY27 margin about 5.7% (my calculation) |
| Profit | Rs 118 crore | As reported in the summary |
| Pharmacies | 7,662 | Net 222 added in the quarter |
| Apollo 24/7 core GMV (ex GST) | Rs 571 crore (+27%) | Rs 450 crore a year ago; GMV is not revenue |
| Apollo 24/7 costs in EBITDA | Rs 91 crore | Included in group EBITDA |
Cite this table: PositionalCalls, “Apollo Hospitals Q2 Results HealthCo Table, as of 5 November 2026”.
The 24/7 platform grew faster than pharmacy, but GMV is a measure of orders, not a company sale. Rs 571 crore divided by Rs 450 crore is 27% growth (my calculation), which matches the reported 27%. A pharmacy margin near 6% means a small slip in costs or discounts moves profit noticeably.
What did the Cloudnine divestment and the CEO change mean?
Apollo sold its Apollo Specialty Hospitals and Apollo Fertility Centre stakes to Kids Clinic India (Cloudnine) for about Rs 1,550 crore, reportedly Rs 765 crore in cash plus a 9.9% stake in the buyer, and one report says it was completed on 3 November 2026.
| Item | What was reported | Source note |
|---|---|---|
| Businesses sold | Apollo Specialty Hospitals (ASHPL) and Apollo Fertility Centre (AFCPL) | Whalesbook, May and November 2026 |
| Buyer | Kids Clinic India Limited (Cloudnine) | Whalesbook |
| Value | About Rs 1,550 crore: Rs 765 crore cash and a 9.9% equity stake | Whalesbook; the split is from the November report |
| Completion | 3 November 2026 in one report; no date in another | Two Whalesbook pages differ |
| Hospitals CEO | Dr. Madhu Sasidhar steps down on 14 November 2026 | Whalesbook |
| Successors named | Dr. Ritu Garg (CEO, Multi Regions), Anand Wasker (CBO, International), Dr. N. Venkatesan (Chief Procurement Officer) | Single source |
Cite this table: PositionalCalls, “Apollo Hospitals Q2 Results Corporate Actions, as of 5 November 2026”.
For readers of the numbers, the sale explains why a restated base is likely. A retained 9.9% stake in the combined entity means Apollo keeps some exposure to those businesses, though it is no longer a subsidiary. The May article gave an indicative completion date of 31 October 2026, so a completion around 3 November fits.
Leadership changes matter less to this quarter’s numbers than to execution of the bed plan. I did not find management comment on the CEO change beyond the announcement.
Apollo Hospitals share price after results: how did the stock react to the Q2 numbers?
Apollo Hospitals closed at Rs 8,599.50 on 4 November 2026, up 1.89%, before the results were public; the market had not opened on 5 November at the time of writing, so the price reaction is not available yet.
| Date and time (IST) | Event or price | Source type |
|---|---|---|
| Wed 4 Nov, 3:30 PM close | Rs 8,599.50 on NSE, up 1.89% | Whalesbook and TradingView |
| Wed 4 Nov, from about 5:57 PM | First reports of the results appear | Whalesbook timestamp |
| Thu 5 Nov, 9:15 AM | Market opens: first reaction to the results | Not yet available at Thursday, 5 November 2026, 6:35 AM IST |
| Thu 5 Nov, 3:00 PM | Analyst and investor call | Company schedule as reported |
Cite this table: PositionalCalls, “Apollo Hospitals Q2 Results Share Price Trail, as of 5 November 2026”.
The 1.89% rise came before the numbers were public, so it is not a reaction to them (my reading of the report timestamps). As an arithmetic illustration only: Rs 43.71 of diluted earnings per share for continuing operations times four is about Rs 175, which puts Rs 8,599.50 at about 49 times, ignoring seasonality and the base change. That is a mechanical figure, not a valuation view.
PositionalCalls is not a SEBI-registered research analyst, so this page publishes no price targets or buy, sell or hold views. I will add the first-day move, the day’s range and any brokerage commentary here once the market has traded.
How do the Apollo Hospitals Q2 results compare with Q1 FY27 and a year ago?
Q2 revenue was about 8% above the reported Q1 FY27 figure of Rs 7,043 crore, EBITDA about 9% above Rs 1,092 crore, and profit about 8% above Rs 581 crore.
| Rs crore, consolidated | Q2 FY27 | Q1 FY27 as reported | Q2 FY26 restated |
|---|---|---|---|
| Revenue from operations | 7,615 | 7,043 (implied 6,932 on the new base) | 6,189 |
| EBITDA | 1,191 | 1,092 | 924 |
| EBITDA margin (my calculation) | 15.6% | 15.5% | 14.9% |
| Profit | 630 | 581 | 477 |
| H1 FY27 revenue and profit | 14,547 and 1,211 | Half-year totals | – |
Cite this table: PositionalCalls, “Apollo Hospitals Q2 Results Three-Period Comparison, as of 5 November 2026”.
Against the implied restated Q1 revenue of Rs 6,932 crore, Q2 revenue is up about 10%; against the older Rs 7,043 crore it is up about 8% (my calculation). Because Q1 may have been restated, a year-on-year view is safer than a sequential one until the Q1 EBITDA base is confirmed.
What should you watch for Apollo at Q3 FY27?
At Q3 FY27, check hospital occupancy against 73%, the hospital EBITDA margin against 24%, the Gurugram opening and whether the restated base stays the same.
| What to read | Q2 FY27 mark | Question to ask |
|---|---|---|
| Hospital occupancy | 73% | Did new beds dilute it? |
| Healthcare Services EBITDA margin | 24.0% | Did ramp-up of new hospitals hold the margin? |
| Group EBITDA margin | 15.6% | Did pharmacy margin stay near 6%? |
| Profit | Rs 630 crore | How much came from the 9.9% stake or one-off items? |
| New capacity | Sarjapur 180 beds; Gurugram about 470 beds due Q3 | Did Gurugram open on time? |
| Base | Restated | Was the Q2 comparison changed again? |
Cite this table: PositionalCalls, “Apollo Hospitals Q2 Results Decoder, as of 5 November 2026”.
No Q3 FY27 results date is confirmed as of Thursday, 5 November 2026, 6:35 AM IST. Apollo reported Q2 on 4 November, so Q3 is likely to fall in the usual early-to-mid February window for large companies, but the company will announce the date through an exchange notice.
What most people miss in the Apollo Hospitals Q2 results
Most pages repeat the 32% profit growth; the details that change the picture are the restated base, the hospital share of profit, the pre-results timing of the price rise and the Q1 base that is still unconfirmed.
What the results mean for shareholders: tax, NRIs and scam warnings
The Apollo Hospitals Q2 results alone need no action, and none of the reports I read mentioned a dividend with these results, so check the exchange filing before assuming one.
- What you need: nothing special. The shares trade on NSE and BSE like any other listed stock.
- Tax angle: gains on sale and any dividend are taxed under current rules. Check our guide to capital gains tax on shares or ask a tax adviser.
- NRI note: NRIs buy through a PIS account with limits that changed in 2026. See NRI investment in the Indian stock market.
- Costs: brokerage and demat charges vary, so check your broker’s current schedule.
- Scam warning: fake “results alert” groups and tip sellers use well-known company names. No genuine result needs your OTP or an app download.
Related results: Tata Motors Q2 results, HUL Q2 results, Adani Ports Q2 results, LIC Q2 results, Titan Q2 results and Sun Pharma Q2 results for the other healthcare name. More in Earnings.
Analyst’s note
- What stands out: profit and EBITDA grew faster than revenue, led by hospitals, on a restated base.
- Easy to miss: the restated base and the price rise that happened before the results.
- What would change the view: a hospital margin below 22%, or a large one-off in the filing notes.
- Caution: the segment table comes from one AI-generated summary, and the price reaction is not yet known.
- Reader action: read the same-basis figures first, open the filing and re-check the price after the market opens.
Bottom line
Apollo delivered a quarter of 23% revenue growth, 29% EBITDA growth and a wider margin, with hospitals earning about four-fifths of the profit. The prior-year base was restated and the price reaction is still unknown, so compare like with like and confirm the figures in the filing.
Next read: the Q2 results calendar.
Part of the Earnings series.
PositionalCalls WhatsApp channel
Never miss a results-day update
- Same-day decoders for the biggest companies reporting
- Record dates and dividend amounts checked against filings
- Corrections posted openly when a number changes
Apollo Hospitals Q2 results: frequently asked questions
When were the Apollo Hospitals Q2 results announced?
Apollo Hospitals announced its Q2 FY27 results on Wednesday, 4 November 2026 for the quarter ended 30 September 2026, after the market closed. An analyst call follows at 3:00 PM IST on Thursday, 5 November 2026.
What was Apollo Hospitals’ net profit in Q2 FY27?
Consolidated profit was Rs 630 crore, up 32% from Rs 477 crore. The first-half profit was Rs 1,211 crore, up 33%. Confirm the profit line in the exchange filing before using it.
What was Apollo Hospitals’ revenue in Q2 FY27?
Revenue from operations was Rs 7,615 crore, up 23% from a restated Rs 6,189 crore. The first-half revenue was Rs 14,547 crore, up 22%.
What was the Apollo Hospitals EBITDA and margin?
EBITDA was Rs 1,191 crore, up 29% from Rs 924 crore. Dividing the two gives a margin of about 15.6% against 14.9% a year ago (my calculation). One summary rounds it to 16%.
Why are last year’s Apollo numbers different now?
Last year’s reports gave Q2 FY26 revenue of Rs 6,304 crore; this quarter’s comparison is Rs 6,189 crore. The gap looks like a restatement after the sale of two businesses, which is my inference, not a stated fact. Compare like with like.
Which Apollo business earns the most?
Healthcare Services, the hospitals, earned Rs 937 crore of EBITDA at a 24% margin, about 79% of the group, on revenue of Rs 3,900 crore. HealthCo earned Rs 193 crore on Rs 3,286 crore, and Apollo Health and Lifestyle Rs 61 crore.
What was Apollo Hospitals’ occupancy in Q2 FY27?
Occupancy was 73% against 69% a year ago, with inpatient volumes up 14%. Apollo plans about 5,800 new beds over five years, including about 470 in Gurugram targeted for Q3 FY27.
What happened with the Cloudnine divestment?
Apollo sold its stakes in Apollo Specialty Hospitals and Apollo Fertility Centre to Kids Clinic India (Cloudnine) for about Rs 1,550 crore, reportedly Rs 765 crore in cash and a 9.9% stake. One report says it completed on 3 November 2026.
How did the Apollo Hospitals share price react to the Q2 results?
The shares closed at Rs 8,599.50 on 4 November 2026, up 1.89%, before the results were public. The market had not opened on 5 November when this page was updated at Thursday, 5 November 2026, 6:35 AM IST, so no reaction is confirmed yet.
When are Apollo Hospitals Q3 FY27 results?
The company has not announced a date as of Thursday, 5 November 2026, 6:35 AM IST. Large Indian companies usually report Q3 between late January and mid-February. Watch for the board meeting notice on NSE and BSE.
Sources
- BSE corporate announcements page and the NSE corporate filings page: where the filing appears (I could not open the filing itself).
- Apollo Hospitals website
- Whalesbook, 4 November 2026 (results and share price)
- Whalesbook, 4 November 2026 (divestment and management changes)
- Multibagg, 4 November 2026 (EBITDA and segments) (AI-generated summary; the segment and EBITDA table)
- TradingView News, 4 November 2026
- Whalesbook, 21 May 2026 (divestment approval)
- Upstox, 6 November 2025 (year-ago results)
- Multibagg, August 2026 (Q1 FY27)
- Kotak Neo, August 2026 (Q1 FY27 segments)
- Kotak Neo and Zeebiz pages on these results could not be opened; their headlines were seen in search only.
PositionalCalls.com is not a SEBI-registered research analyst or investment adviser. Investments in securities markets are subject to market risks. Read all related documents carefully before investing. Returns are never guaranteed. PositionalCalls is an independent Indian stock market research and education site founded by Shubham Chaudhary. This page is education and results analysis, not a recommendation to buy, sell or hold any security. How I researched this: I read press and data-platform reports of the results, cross-checked the segment sums and profit basis, recomputed every derived number, and listed conflicts openly. I have not opened the company filing directly.

Shubham Chaudhary is the founder of PositionalCalls, an independent Indian stock market research website. He writes company fundamentals, quarterly results analysis, IPO analysis and sector research for NSE and BSE listed companies, with a focus on banking stocks, insurance and long-term value investing. Every article is built from primary sources such as RBI, SEBI, NSE and BSE filings and company annual reports, and states its risks plainly in simple language for retail investors.
Coverage areas Our research standards- Numbers checked against NSE, BSE and SEBI filings
- Risks and limits stated in every article
- No paid promotions or broker tie-ups
- Articles updated when new filings arrive