
Insurance · General Insurance Stocks
Looking for the best general insurance stocks in India 2026? All six listed insurers have filed Q2 FY27. This page compares them on combined ratio, solvency, growth and accounting basis, from results as reported, and names no winner.
Quick answer
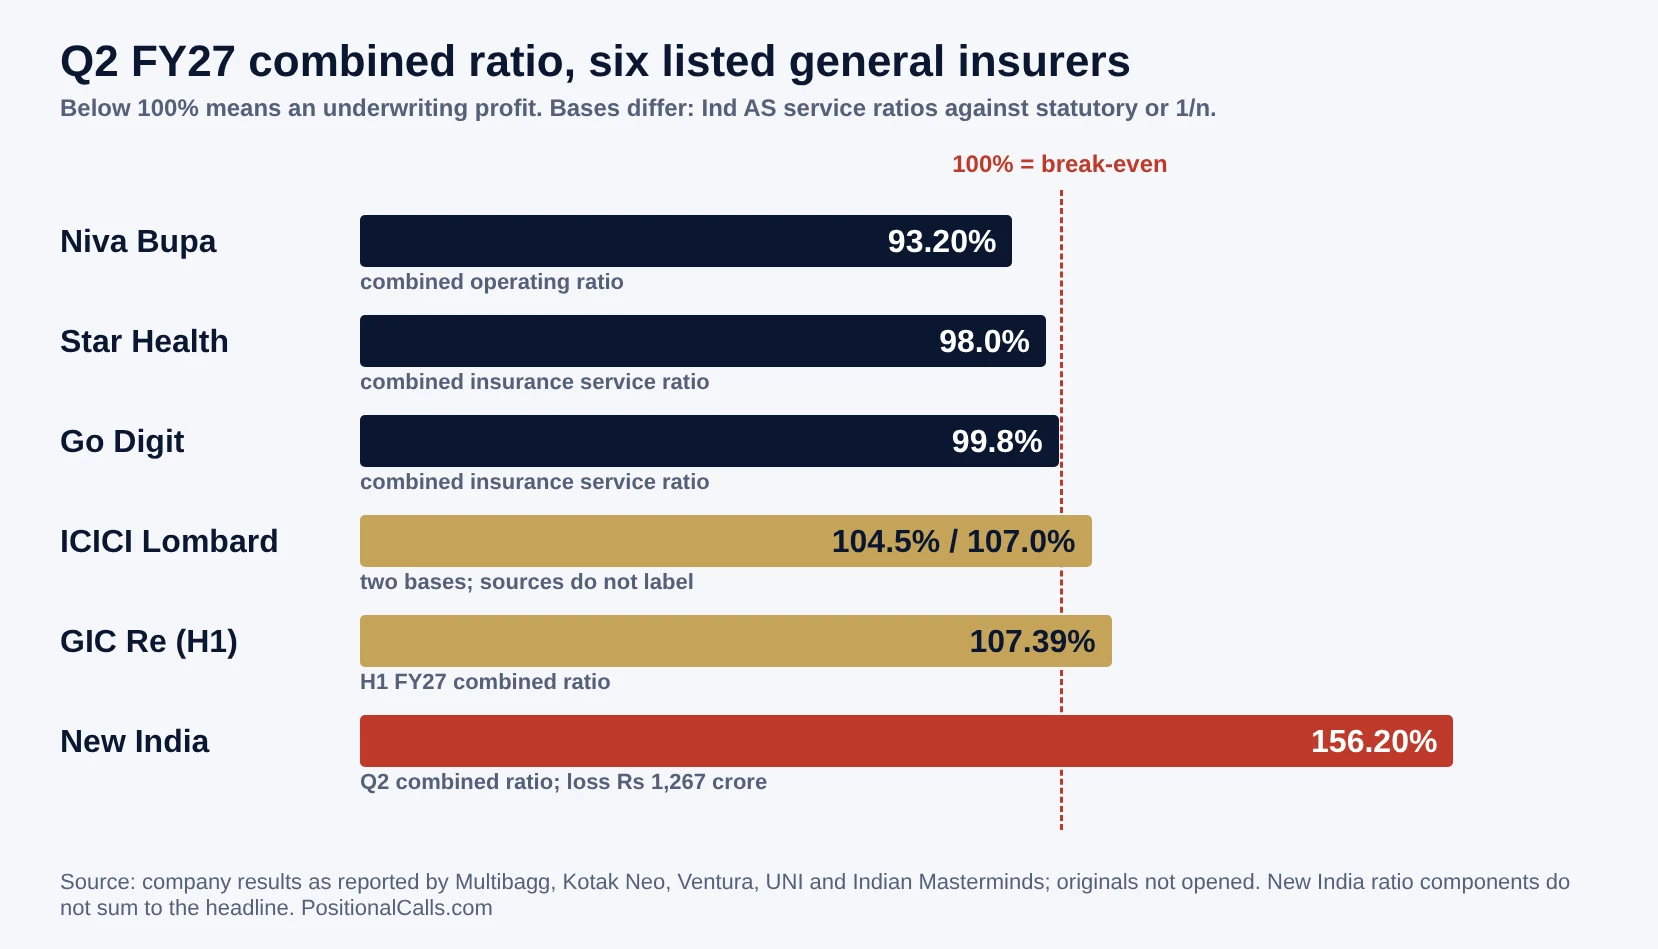
The best general insurance stocks in India 2026 shortlist is six listed insurers, and all have reported Q2 FY27. Ratios split widely: Niva Bupa 93.20%, Star Health 98.0%, Go Digit 99.8%, ICICI Lombard 104.5% or 107.0% by basis, GIC Re 107.39% for H1 and New India Assurance 156.20%. Check the basis first.
Latest update (Sunday, 15 November 2026, 8:44 AM IST): Rebuilt on Q2 FY27 results for all six insurers, which replace the Q1 figures the 27 October version used for five of them. New India Assurance reported a Q2 loss of Rs 1,267.04 crore, and Niva Bupa a Q2 profit of Rs 135.64 crore. The ICICI Lombard basis labels and the New India net worth figure of the earlier version are not carried over.
Key takeaways
- No ranking: the six insurers are compared on stated criteria. This page gives no rating, target or buy list.
- Best and worst ratios: Niva Bupa reported a combined operating ratio of 93.20% and New India Assurance 156.20%, with a Rs 715.41 crore motor third-party reserve in the Q2 numbers.
- Basis matters: the three ratios below 100% (Niva Bupa, Star Health, Go Digit) appear to be on Ind AS service-ratio measures, and the three above are statutory or 1/n measures. I could not size how much of the gap is accounting.
- Capital: solvency was 4.18x at GIC Re, 2.74x at ICICI Lombard, 2.40x at Go Digit, 2.03x at Niva Bupa (from 2.85x) and 1.61x at New India (from 1.80x), against a 1.50x minimum.
- Gaps: no live prices or valuation, and no exchange filing opened in this rebuild.
In plain words: a general insurer earns money in two ways. Underwriting is premium minus claims and expenses. Investment income comes from investing premium before claims are paid. Many insurers lose on underwriting and still report a profit because of investment income.
Data note: Q2 FY27 figures are from news and results summaries of company filings (Multibagg, Kotak Neo, SAHI, Investywise, Indian Masterminds, Ventura and UNI), as of 15 November 2026. Sector and rule-change items are carried from the 27 October version of this page. I opened no exchange filing in this rebuild, and different bases (statutory, 1/n, Ind AS) give different profits, so each is labelled.
1. Which are the best general insurance stocks in India 2026?
No single stock is best for every investor, but the best general insurance stocks in India 2026 shortlist is the six listed non-life insurers below. Five sell cover directly and GIC Re is a reinsurer. This page uses reported numbers and assigns no buy or hold label.
| Insurer | Type | Q2 FY27 reported | What the numbers show |
|---|---|---|---|
| ICICI Lombard | Private multi-line | 14 Oct; combined ratio 104.5% (profit Rs 1,031 crore, +27.5%) or 107.0% (profit Rs 946 crore, +15.5%) by basis; solvency 2.74x | Profit up on either basis while underwriting is above 100% |
| Star Health | Standalone health | 29 Oct; combined insurance service ratio 98.0%; underwriting profit Rs 99 crore; reported profit Rs 265 crore | Underwriting profit, but reported profit is far below normalised |
| New India Assurance | Public sector multi-line | 30 Oct; loss Rs 1,267.04 crore; combined ratio 156.20%; solvency 1.61x | Heaviest underwriting loss of the six |
| GIC Re | Reinsurer | 30 Oct; H1 profit Rs 4,377.66 crore (-5.23%); H1 combined ratio 107.39%; solvency 4.18x | Largest capital buffer, profit slightly lower |
| Go Digit | Digital multi-line | 5 Nov; combined insurance service ratio 99.8%; profit from continuing operations Rs 142.39 crore (-31%); solvency 2.40x | Ratio worsened by flood claims; premium fell |
| Niva Bupa | Standalone health | 4 Nov; combined operating ratio 93.20%; profit Rs 135.64 crore (+124%); solvency 2.03x | Fastest growth and the lowest ratio, with solvency down |
Cite this table: Company results as reported by Multibagg, Kotak Neo, SAHI, Investywise, Indian Masterminds, Ventura and UNI; originals not opened; ratios are on different bases and are not a league table.
Sector size gives the backdrop. The earlier version reported gross direct premium of Rs 3.36 lakh crore in FY26, up about 9%, from General Insurance Council data, and Emkay put Q2 FY27 industry growth near 7%. I carried those figures over without re-checking them. ICICI Lombard’s own comparison puts H1 FY27 industry growth at 8.9%, a different period and measure.
2. What changed in the best general insurance stocks in India 2026 page since 27 October?
This rebuild replaces Q1 figures with Q2 FY27 for Star Health, New India, GIC Re, Go Digit and Niva Bupa, drops two figures I could not support, and flags the ICICI Lombard basis labels as unresolved rather than repeating them.
| Item | 27 October version | This rebuild | Why |
|---|---|---|---|
| Results period | ICICI Lombard Q2; other five Q1 | All six Q2 FY27 (GIC Re shown for H1 where Q2 is not given) | All six have reported |
| New India Assurance | Q1 loss Rs 257 crore; combined ratio 121.44%; solvency 1.80x | Q2 loss Rs 1,267.04 crore; combined ratio 156.20%; solvency 1.61x | Q2 results filed 30 October |
| New India net worth | Rs 23,393 crore | Not shown | Other sources give Rs 39,447 crore including fair-value changes; I could not reconcile |
| Star Health | Q1 ratio 97.0%; profit Rs 550 crore | Q2 ratio 98.0%; reported profit Rs 265 crore | Q2 filed 29 October |
| Go Digit | Q1 statutory combined ratio 107.2% | Q2 combined insurance service ratio 99.8% (Ind AS) | Different measure; the two are not comparable |
| Niva Bupa | Q1 ratio 100.2%; profit Rs 137.8 crore | Q2 ratio 93.20%; profit Rs 135.64 crore | Q2 filed 4 November |
| ICICI Lombard bases | Statutory 107.0% and 1/n 104.5% | Both pairs shown, with no basis label | The sources do not name the bases; the earlier labels are unconfirmed; filing not opened |
| Star Health Q2 call | Scheduled 28 October | Held; results 29 October | Date passed |
| Category link | Linked to a stock market category page | Removed | That category page is not in use |
Cite this table: Comparison of the PositionalCalls 27 October version with sources opened in this rebuild; originals not opened.
What the best general insurance stocks in India 2026 page says about bases
The most important change is on basis. The earlier page called Rs 946.4 crore ICICI Lombard’s statutory profit and Rs 1,031 crore its 1/n profit. Multibagg presents 104.5% and Rs 1,031 crore (+27.5%, against Rs 809 crore) as the headline figures, and SAHI headlines Rs 946 crore against Rs 820 crore. Business Today gives 107% (up 190 basis points) with profit up 15%, which fits Rs 946 crore against Rs 820 crore, and an Investywise call transcript gives profit growth of 27.5%, which fits Rs 1,031 crore. None of these says which accounting basis it uses. I cannot tell from the sources I opened which is which, so this page reports both pairs and does not assign a label, and the earlier statutory and 1/n labels should not be taken as confirmed.
3. What do the Q2 FY27 results show for the best general insurance stocks in India 2026?
Among the best general insurance stocks in India 2026 shortlist, Q2 FY27 ratios ran from 93.20% at Niva Bupa to 156.20% at New India Assurance. Three insurers were below 100% on Ind AS style measures, three were above it on statutory or 1/n measures, and New India alone lost money.
| Insurer (Q2 FY27) | Profit after tax | Ratio (year earlier) | Premium | Solvency |
|---|---|---|---|---|
| ICICI Lombard | Rs 1,031 crore, +27.5%, or Rs 946 crore, +15.5% (basis not stated by sources) | 104.5% (103.9%) or 107.0% | H1 GDPI +5.4% against industry +8.9% | 2.74x |
| Star Health | Reported Rs 265 crore (+233%); normalised Rs 390 crore (+70%) | 98.0% (100.9%), combined insurance service ratio | GWP Rs 5,275 crore, +19% (1/N) | Not found |
| New India Assurance | Loss Rs 1,267.04 crore | 156.20% (139.77%); incurred claims 133.71% (108.66%) | GWP +5.14%; net premium written about Rs 8,850 crore | 1.61x (1.80x in June) |
| GIC Re (H1 FY27) | Rs 4,377.66 crore, -5.23% (Q2 standalone Rs 2,455.62 crore) | 107.39% (107.41%) | Gross premium Rs 24,703.57 crore, +12.3% | 4.18x (3.85x) |
| Go Digit | Continuing operations Rs 142.39 crore (-31%); excluding MTM Rs 208 crore (-29%) | 99.8% (94.9%); 97.4% excluding flood loss | GDPI -1.2%; GWP -3.6% | 2.40x |
| Niva Bupa | Rs 135.64 crore, +124% | 93.20% (96.62%), combined operating ratio | GWP Rs 2,484.05 crore, about +34.8% | 2.03x (2.85x) |
Cite this table: Company results as reported by Multibagg, Kotak Neo, SAHI, Investywise, Indian Masterminds, Ventura and UNI; originals not opened; the Niva Bupa growth rate is my division of reported GWP figures.
Two checks matter. First, GIC Re’s H1 profit of Rs 4,377.66 crore minus Q1’s Rs 1,922 crore (from the earlier version) is Rs 2,455.66 crore, which agrees with the reported Q2 standalone figure of Rs 2,455.62 crore (my calculation). Second, New India’s headline combined ratio of 156.20% does not equal its reported components: incurred claims of 133.71% plus an expense ratio of 19.95% is 153.66% (my calculation). The 2.5-point gap is unexplained in the source, so treat the exact ratio with caution.
ICICI Lombard’s profit rose in Q2 even though its ratio worsened. Catastrophe losses were Rs 118 crore against Rs 73 crore a year earlier, and excluding them the ratio on the 104.5% basis was 102.7%, against 102.6%. H1 profit on that basis was Rs 1,454 crore, 5.8% lower than a year earlier, so one strong quarter follows a weak one.
4. Why do profit numbers differ for the same insurer?
When you compare the best general insurance stocks in India 2026, remember that one insurer can report several profits for the same quarter: reported, normalised, excluding market-to-market gains, or standalone against consolidated. Always check which measure a headline uses.
| Insurer (Q2 FY27) | Measure A | Measure B | Gap that matters |
|---|---|---|---|
| ICICI Lombard | Rs 1,031 crore, +27.5% | Rs 946 crore, +15.5% | Rs 85 crore apart; growth differs by 12 points (my calculation) |
| Star Health | Reported Rs 265 crore, +233% | Normalised Rs 390 crore, +70% | Normalised is Rs 125 crore higher on an assumed 8% yield |
| Go Digit | Continuing operations Rs 142.39 crore, -31% | Excluding MTM Rs 208 crore, -29% | Rs 65.6 crore of market-to-market effect (my calculation) |
| New India Assurance | Loss Rs 1,267.04 crore | Includes about Rs 1,800 crore capital gain from partly selling an NSE stake (one source) | The underlying loss before that gain would be larger; I could not size it |
| GIC Re | Standalone Q2 Rs 2,455.62 crore | Consolidated Q2 not found | Q1 consolidated was Rs 1,744 crore against standalone Rs 1,922 crore |
Cite this table: Company figures as reported by SAHI, Multibagg, UNI, Investywise and Ventura; originals not opened; differences are my arithmetic on reported numbers.
Star Health’s reported profit of Rs 265 crore is about 52% below Q1’s Rs 550 crore (my calculation), while its normalised profit of Rs 390 crore compares with Q1’s Rs 386 crore, close to flat. That suggests investment gains, not underwriting, drove the Q1 to Q2 swing, but the sources I opened do not say so directly.
New India’s loss deserves a caution. Investywise reports about Rs 1,800 crore of capital gains from partly selling its NSE stake inside Q2, yet the company still lost Rs 1,267.04 crore, with an operating loss of Rs 2,330.14 crore for the quarter. I read that as underwriting pressure being larger than the headline loss shows, but I did not open the filing.
5. Motor third-party: the pressure point in the Q2 numbers
Motor third-party claims are the clearest pressure point in the Q2 numbers. New India booked an initial Rs 715.41 crore reserve after a 11 June 2026 Supreme Court judgment, according to Multibagg, and Go Digit and ICICI Lombard also cited motor and weather claims.
| Item | Reading | Source |
|---|---|---|
| New India Q2 incurred claims | Rs 12,879.50 crore, against Rs 10,212.43 crore a year earlier | Multibagg |
| New India premium earned | Rs 9,632.18 crore, against Rs 9,398.91 crore | Multibagg |
| New India change in outstanding claims | Rs 3,400.67 crore, against Rs 1,462.11 crore | Multibagg |
| Motor third-party reserve | Rs 715.41 crore initial reserve after a 11 June 2026 Supreme Court judgment; the General Insurance Council filed a review petition | Multibagg, one source |
| Go Digit flood effect | Ratio 99.8%, or 97.4% excluding flood loss | Investywise and Ventura |
| ICICI Lombard catastrophe losses | Rs 118 crore, against Rs 73 crore | Multibagg |
Cite this table: Reserve and claims data as reported; I did not open the judgment, the review petition or any filing, and I do not describe the judgment’s content.
PositionalCalls WhatsApp channel
Follow general insurer results plainly
- Quarterly insurer results in plain words
- Explainers on combined ratio and solvency
- A message when this page is updated
New India’s incurred-claim line is the sharp one. Its claims rose about 26% (12,879.50 over 10,212.43, my calculation) while premium earned rose about 2.5% (9,632.18 over 9,398.91), which is the arithmetic behind a ratio near 134%. A single reserve of Rs 715.41 crore explains only part of a Rs 2,667 crore rise in claims, so the rest came from other claims and reserves that the source does not itemise. For vehicle demand context see my auto sector outlook 2026 and Maruti Suzuki Q2 results FY27.
6. Rules that affect general insurers
Three rule changes matter most: GST exemption on individual health cover from 22 September 2025, up to 100% foreign investment from 5 February 2026, and the IRDAI distribution draft. These dates are carried from the earlier version, and the IRDAI item has an open status.
| Date | Change | Why it matters to investors |
|---|---|---|
| 22 Sep 2025 | GST on individual health and life policies exempted; group health stays at 18% | Retail health demand rose; insurers must reverse input tax credit on exempt supplies |
| Oct 2025 to Mar 2026 | Individual health premium grew 29.7%, against 7.0% a year earlier (Lok Sabha reply, as reported) | Explains the retail health surge at Niva Bupa and ICICI Lombard |
| 5 Feb 2026 | Sabka Bima Sabki Raksha Act in force; FDI in insurers up to 100% by automatic route | More capital and competition; no profit guarantee |
| 23 Sep 2026 | IRDAI consultation paper on distribution economics; feedback extended to 31 October | Draft only; commission and expense rules could change distribution costs |
| 11 Jun 2026 | Supreme Court judgment on motor third-party cover cited by New India for its reserve | Motor third-party claims drove the weakest result |
Cite this table: Dates carried from the 27 October version, plus items from my insurance pages; primary texts not opened in this rebuild.
Retail health growth shows in the Q2 numbers. Multibagg reports ICICI Lombard’s retail health premium grew 66.4% in H1 against 32.0% for the industry, and Niva Bupa’s Q2 premium grew about 35%. The cost of the GST change shows in capital. Niva Bupa’s solvency fell to 2.03x from 2.85x, though the source does not say why, and the earlier version cited a 50 to 60 basis point combined ratio effect from lost input tax credit, which I have not re-checked. For the distribution draft see my best insurance stocks in India 2026 page.
7. How do the best general insurance stocks in India 2026 compare one by one?
Each insurer has one strength and one pressure point in its Q2 numbers. This is a summary of reported figures, not a recommendation.
ICICI Lombard: profit up, ratio above 100%
Supports the case: profit up on either basis, retail health premium up 66.4% in H1, solvency 2.74x. Watch: H1 GDPI up 5.4% against industry 8.9% and H1 profit down 5.8% on the 1,454 crore basis. Excluding crop and mass health, Q2 GDPI grew 13.9% against 13.2%.
Star Health: underwriting profit, investment-led profit
Supports the case: a 98.0% ratio against 100.9% a year earlier, underwriting profit of Rs 99 crore against a loss of Rs 40 crore, and GWP up 19%. Watch: reported profit of Rs 265 crore against normalised Rs 390 crore, the drop from Q1, and the ratio edging up from Q1’s 97.0% on the earlier version’s figures.
New India Assurance: the weakest result
Supports the case: a large balance sheet, premium growth of 5.14% and a capital gain from its NSE stake. Watch: a Q2 loss of Rs 1,267.04 crore, a 156.20% ratio and solvency of 1.61x, down from 1.80x and approaching the 1.50x minimum.
GIC Re: capital buffer, flat profit
Supports the case: solvency of 4.18x against 3.85x, and gross premium up 12.3%. Watch: H1 profit down 5.23% and a combined ratio of 107.39%, unchanged from 107.41%. A reinsurer’s results swing with catastrophe losses and associate income.
Supports the case: a ratio of 97.4% excluding flood loss and AUM of Rs 24,371 crore, up 15.9% (Ventura). Watch: GWP down 3.6%, GDPI down 1.2%, a 99.8% ratio against 94.9%, and profit from continuing operations down 31%.
Niva Bupa: fastest growth, lower ratio, lower solvency
Supports the case: profit up 124% to Rs 135.64 crore, GWP up about 35% and a ratio of 93.20% against 96.62%. Watch: solvency falling to 2.03x from 2.85x. Its Q1 ratio of 100.2% on the earlier version implies a seven-point drop in one quarter, which I could not explain.
8. How should you compare general insurance stocks?
Use six checks: combined ratio, solvency, premium growth against the industry, dependence on investment income, segment mix and regulatory exposure. Valuation matters too, but prices change daily and I collected none for this page, so check exchange data on the day you decide.
| Check | What to look for | Example from Q2 FY27 |
|---|---|---|
| Combined ratio | Below 100% means an underwriting profit | Niva Bupa 93.20% against New India 156.20% |
| Basis | Statutory, 1/n or Ind AS | ICICI Lombard 104.5% or 107.0% by basis |
| Solvency ratio | Above the 1.50x regulatory minimum, and the direction | GIC Re 4.18x; New India 1.61x, down from 1.80x |
| Growth against industry | Beat the industry, not just grow | ICICI Lombard Q2 ex-crop 13.9% against 13.2% |
| Investment dependence | Profit with and without gains | Star Health Rs 265 crore reported against Rs 390 crore normalised |
| Segment mix | Motor third-party is the pressure point | New India claims +26% on premium +2.5% |
Cite this table: Framework by PositionalCalls; examples from the Q2 FY27 figures in this page.
Scale check. One point of combined ratio on a quarter’s earned premium shows why small moves matter. These are before-tax illustrations against after-tax profit, so use them for scale only.
| Insurer (Q2 FY27) | Earned premium | Value of 1 point of combined ratio (my calculation) | Against reported result |
|---|---|---|---|
| ICICI Lombard | Rs 6,652 crore (earlier version) | Rs 66.5 crore | About 6% to 7% of Rs 946 crore to Rs 1,031 crore profit |
| New India Assurance | Rs 9,632.18 crore | Rs 96.3 crore | Loss was Rs 1,267.04 crore |
Cite this table: Division by PositionalCalls of earned premium figures from Multibagg and the 27 October version; originals not opened.
9. What most people miss
Four points are easy to overlook, and each changes how a headline reads.
- Profit can rise while underwriting worsens. ICICI Lombard’s ratio widened and profit still rose on investment income.
- A low ratio is partly a basis question. The three ratios under 100% appear to be Ind AS service ratios, so they are not directly comparable with statutory ratios.
- Growth is not margin. Niva Bupa grew about 35% with a 93.20% ratio, while Go Digit shrank to protect margin and still saw its ratio worsen on floods.
- A reinsurer is a different bet. GIC Re’s results swing with catastrophe losses and associate income, and its solvency is the highest here.
10. Checklist, risks and costs
- Open the exchange filing for each insurer, not a forwarded summary.
- Note the reporting basis before comparing profit growth.
- Record combined ratio, solvency and growth against the industry.
- Check how much profit came from investment gains or one-off sales.
- Read what management says about motor and health claims.
- Compare Q3 FY27 numbers as each insurer files.
What you need: a demat account and the filings. Costs and tax: brokerage and charges vary, so check your broker’s current schedule; for tax on gains read capital gains tax on shares. Not a policy: shares of an insurer are different from cover; for cover see health insurance plans and super top-up health insurance. Scam warning: guaranteed-return claims, paid-tip pitches and OTP requests are red flags. PositionalCalls is not SEBI registered.
11. What to watch next for the best general insurance stocks in India 2026
Watch the outcome of the motor third-party review, New India’s solvency, Q3 FY27 ratios, the Niva Bupa solvency trend and the IRDAI draft. I found no confirmed Q3 result dates, and this is a checklist, not a forecast.
| Watch item | A stronger reading | A weaker reading |
|---|---|---|
| Motor third-party reserves | Review outcome limits further reserve additions | More insurers add reserves |
| New India solvency | Stays above 1.50x with a recovery plan | Falls toward 1.50x |
| Niva Bupa solvency | Stabilises near 2x with ratio held | Falls further as growth continues |
| Go Digit premium and ratio | Premium recovers and the flood effect fades | Premium keeps falling |
| Star Health profit | Reported profit recovers toward normalised | Gap to normalised persists |
| IRDAI distribution rules | Final rules close to the draft with a long transition | Caps start early with little transition |
Cite this table: Watch list by PositionalCalls; these are conditions to check, not forecasts or probabilities.
- What stands out: the six ratios span 93.20% to 156.20%, and the spread follows the basis and motor exposure as much as management.
- Easy to miss: New India’s loss came after a reported Rs 1,800 crore capital gain.
- What would change the picture: the motor review, Q3 ratios and any solvency capital raise.
- Reader action: build a sheet of basis, ratio, solvency and growth for each insurer and open each filing.
Reasoning from the data above; not a forecast.
Bottom line
The best general insurance stocks in India 2026 shortlist shows premium growth almost everywhere and clean underwriting profit almost nowhere. Niva Bupa, Star Health and Go Digit sit under 100% on Ind AS style measures, while New India lost Rs 1,267.04 crore. Compare basis, ratio, solvency and investment dependence, and open the filings.
Next read: best insurance stocks in India 2026
Part of the Insurance series on PositionalCalls.
PositionalCalls WhatsApp channel
Keep motor claims and rules in one place
- A dated note on motor third-party news
- Insurer results as they come
- Updates when new data is out
FAQs on the best general insurance stocks in India 2026
Which are the best general insurance stocks in India 2026?
No single stock is best for every investor. The listed shortlist is ICICI Lombard, Star Health, New India Assurance, GIC Re, Go Digit and Niva Bupa. All six have filed Q2 FY27. Compare the best general insurance stocks in India 2026 on combined ratio, solvency, premium growth and reporting basis, using the filings.
Are general insurance stocks good for long-term investment?
Premium growth is supported by low penetration and rule changes, but underwriting profit is thin: three of six reported ratios above 100% in Q2 FY27, and New India lost Rs 1,267.04 crore. Returns depend on claims, pricing and investment income. This page gives no advice; consider your risk profile and a qualified adviser.
What is the combined ratio and why does it matter for insurance stocks?
The combined ratio is claims plus expenses divided by premium. Below 100% means an underwriting profit; above it means an underwriting loss that investment income must cover. For Q2 FY27, Niva Bupa reported 93.20% and New India Assurance 156.20%. Check the accounting basis before comparing.
Did ICICI Lombard profit rise in Q2 FY27?
Yes, on both figures reported. Multibagg gives profit after tax of Rs 1,031 crore, up 27.5%, with a 104.5% ratio. SAHI gives Rs 946 crore against Rs 820 crore, about 15.5%, and the earlier version of this page showed a 107.0% ratio. Business Today also gives 107%. The sources do not state which basis each uses.
Why did New India Assurance report a loss in Q2 FY27?
New India reported a standalone loss of Rs 1,267.04 crore for July to September 2026 and a 156.20% combined ratio, with a Rs 715.41 crore motor third-party reserve after a 11 June 2026 Supreme Court judgment, per Multibagg. Solvency fell to 1.61x from 1.80x. I did not open the filing.
How did Go Digit and Niva Bupa do in Q2 FY27?
Go Digit reported a 99.8% combined insurance service ratio, 97.4% excluding flood loss, and profit from continuing operations of Rs 142.39 crore, down 31%. Niva Bupa reported profit of Rs 135.64 crore, up 124%, and a 93.20% ratio, with solvency of 2.03x against 2.85x a year earlier.
How did the GST exemption on health insurance affect insurers?
From 22 September 2025, GST on individual health and life policies is exempt. Individual health premium growth rose, but insurers must reverse input tax credit on exempt supplies. The earlier version cited a 50 to 60 basis point combined ratio effect for Niva Bupa, which I did not re-check in this rebuild.
Does 100% FDI help the best general insurance stocks in India 2026?
The Sabka Bima Sabki Raksha Act, in force from 5 February 2026, allows up to 100% foreign investment in insurers through the automatic route. It can bring capital and competition, but it does not guarantee higher profit or share prices for any listed insurer, and I found no data linking it to the Q2 results.
What is the difference between general and life insurance stocks?
General insurers sell short-term cover such as health, motor and property, and profit depends on claims and pricing each year. Life insurers sell long-term protection and savings and are read on value of new business and VNB margin. See my guide to the best insurance stocks in India 2026 for the life insurers.
Is this page a buy or sell recommendation?
No. This guide compares reported numbers for the best general insurance stocks in India 2026 shortlist. It gives no target price and no advice to buy, hold or sell, and PositionalCalls is not SEBI registered. Investments in securities markets are subject to market risks, and returns are never guaranteed.
Sources
- Multibagg: New India Assurance Q2 FY27 standalone loss; loss, solvency and motor reserve.
- Multibagg: New India Assurance combined ratio and claims; combined ratio 156.20%, claims and expense ratios.
- Investywise: New India Assurance Q2 FY27 premium and loss; GWP growth, NSE gain and operating loss.
- Indian Masterminds: GIC Re H1 FY27 results; 31 October 2026.
- Investywise: GIC Re Q2 FY27 standalone profit; lakh figures converted by me.
- Multibagg: Go Digit Q2 FY27 profit falls; ratio, GDPI and solvency.
- Ventura: Go Digit Q2 combined ratio and flood claims; GWP, AUM and profit from continuing operations.
- Kotak Neo: Niva Bupa Q2 FY27 results; 4 November 2026.
- SAHI: Niva Bupa Q2 standalone net profit; profit cross-check.
- Multibagg: ICICI Lombard Q2 FY27; ratio, profit, growth and catastrophe losses.
- SAHI: ICICI Lombard Q2 standalone net profit; headline only.
- Business Today: ICICI Lombard Q2 results and stock reaction; 107% ratio, profit up 15%.
- Investywise: ICICI Lombard Q2 and H1 FY27 call transcript; profit growth 27.5%.
- UNI / PR Newswire: Star Health Q2 FY27; 29 October 2026.
- Star Health Q1 FY27 earnings presentation (NSE); cited in the earlier version, not re-opened.
- New India Assurance Q1 FY27 investor presentation (NSE); cited in the earlier version, not re-opened.
- GIC Re Q1 FY27 press release (NSE); cited in the earlier version, not re-opened.
- PRS Legislative Research: Insurance Laws Amendment Bill 2025 summary.
- IRDAI: regulator.
- Named, not linked: Business Standard, Reuters-based and GuruFocus summaries of ICICI Lombard results, Emkay sector note via Business India, a Lok Sabha reply on health premium growth via A2Z Taxcorp. I opened none of them or any exchange filing in this rebuild.

Shubham Chaudhary is the founder of PositionalCalls, an independent Indian stock market research website. He writes company fundamentals, quarterly results analysis, IPO analysis and sector research for NSE and BSE listed companies, with a focus on banking stocks, insurance and long-term value investing. Every article is built from primary sources such as RBI, SEBI, NSE and BSE filings and company annual reports, and states its risks plainly in simple language for retail investors.
Coverage areas Our research standards- Numbers checked against NSE, BSE and SEBI filings
- Risks and limits stated in every article
- No paid promotions or broker tie-ups
- Articles updated when new filings arrive