
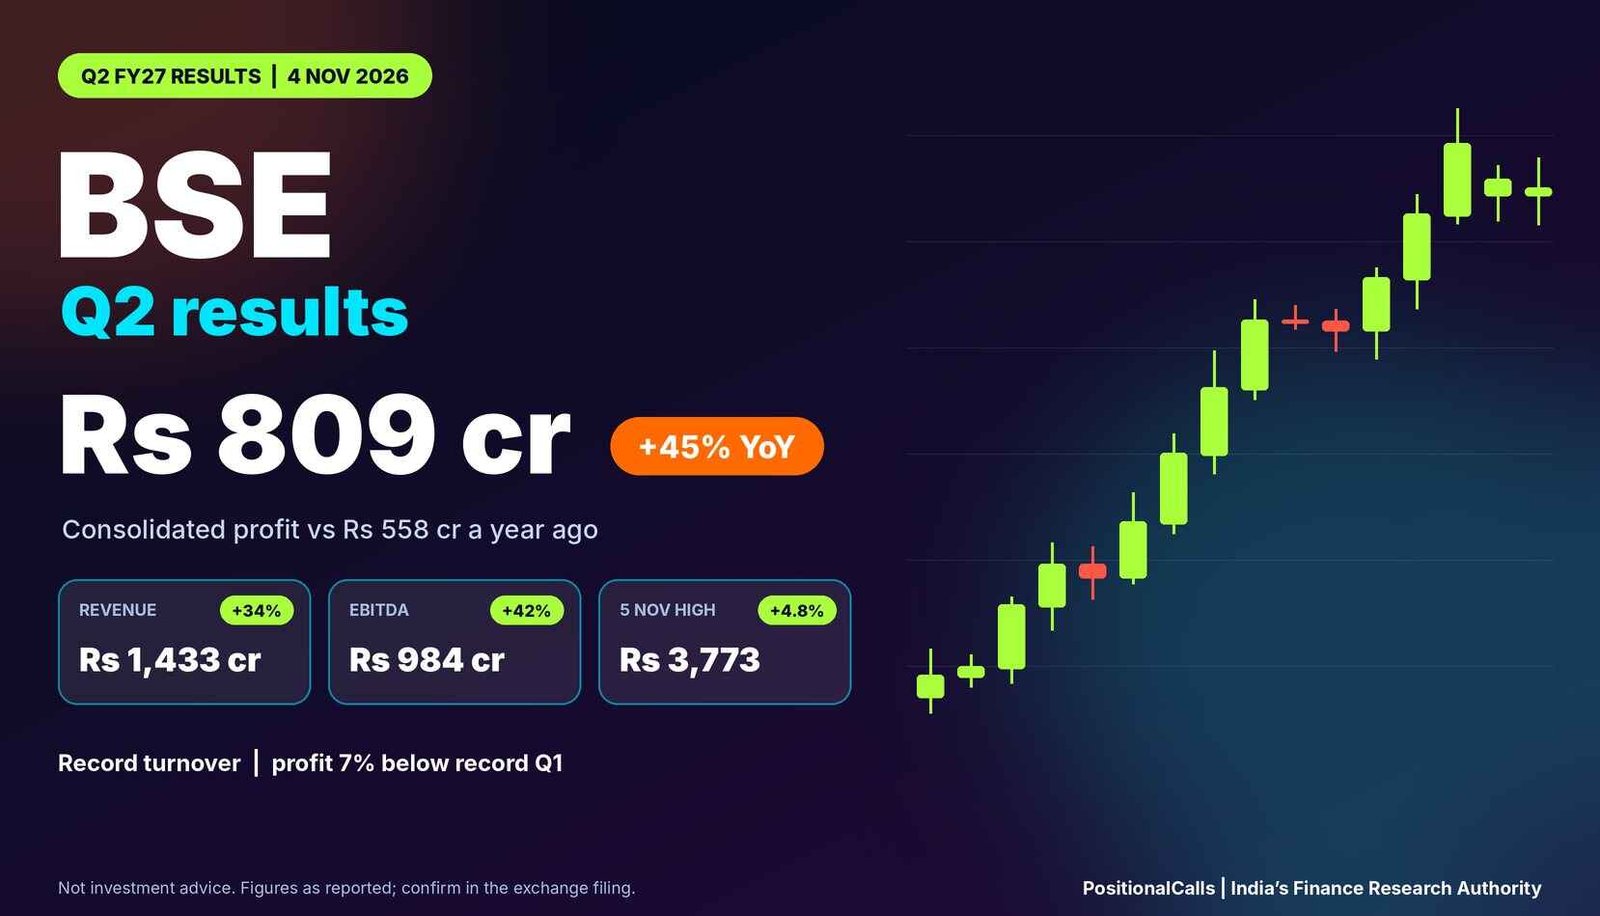
Earnings · BSE
BSE reported 45% higher profit for the September quarter, though below its record June quarter. This page shows which profit and EBITDA figures to trust, what drove them, how the stock reacted and what to watch next.
Quick answer
BSE Q2 results FY27: BSE reported consolidated profit of Rs 809 crore (+45%) on revenue from operations of Rs 1,433 crore (+34%), with EBITDA of about Rs 984 crore. Profit fell 7% from the record Q1. The stock rose about 4% in early trade on 5 November.
Latest update (Thursday, 5 November 2026, 11:30 AM IST): This page now covers the results announced on Wednesday, 4 November 2026; it replaces the earlier preview. BSE closed at Rs 3,601.50 on 4 November, down 1.75%, before the numbers were public. On Thursday, 5 November it opened about 2% higher and reached Rs 3,773, and one report had it up 4.2% at Rs 3,755 at 10:25 AM. I will update the close and the day’s range after the market shuts at 3:30 PM IST.
Key takeaways
- Profit: Consolidated profit was Rs 809.15 crore, up 44.9% from Rs 558.43 crore, but 7.4% below the record Rs 874.02 crore in Q1 FY27.
- Revenue: Revenue from operations was Rs 1,432.66 crore (+34.1%), down 8.5% from Q1. Transaction charges were Rs 1,127.8 crore (+42%).
- EBITDA: EBITDA was Rs 984 crore at a 68.7% margin; operating EBITDA was Rs 973.1 crore. Both are up about 42% to 43% on a year ago.
- Volumes: Equity cash turnover hit a record Rs 10,494 crore a day, and monthly index options premium turnover a record Rs 35,481 crore a day.
- Share price: The stock closed at Rs 3,601.50 on 4 November, before the results, then rose to Rs 3,773 at the day’s high on 5 November and traded near Rs 3,755 at 10:25 AM.
- Board: The board accepted an MMRDA offer of a plot at Bandra Kurla Complex and appointed an executive director. No dividend was mentioned in the reports I read.
In plain words: BSE (Bombay Stock Exchange) earns when people trade, list shares and use its data. Most of its profit comes from transaction charges on derivatives. Turnover is the value of trades in a day. EBITDA is operating profit before interest, tax, depreciation and amortisation. A “base” is last year’s same quarter.
Data note: as of Thursday, 5 November 2026, 11:30 AM IST. I could not open the company filing or the Zeebiz and India IPO pages, so figures come from Business Standard, The Hans India and Multibagg reports of the results. The Multibagg table is an AI-generated summary and is the only source for several lines, so I label them as reported, not confirmed. Reports differ on EBITDA (Rs 973, 980 and 984 crore) and on profit (Rs 809 and Rs 808 crore); each is named. Share-price figures are from a Business Standard report updated at 10:57 AM IST and may have moved since. Derived numbers are marked “my calculation”.
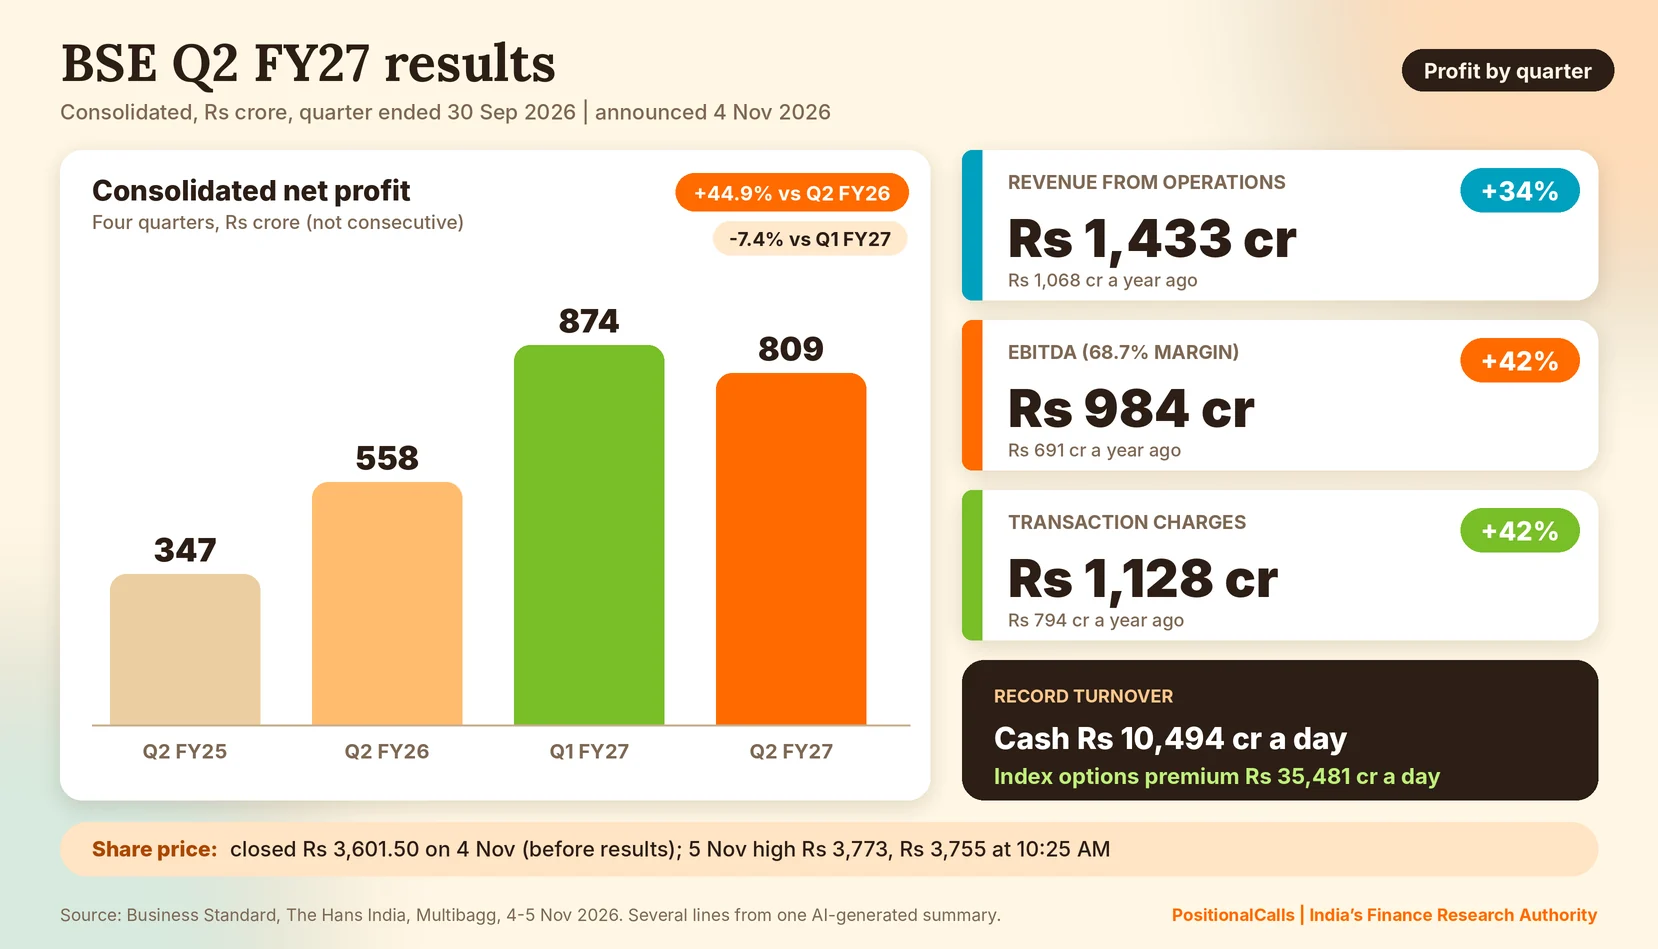
BSE Q2 results FY27: key numbers at a glance
BSE Ltd Q2 results show consolidated profit of Rs 809 crore, up 45% on the Rs 558 crore base, on revenue of Rs 1,433 crore, up 34%, though both are below the record Q1 FY27.
| Consolidated, Rs crore | Q2 FY27 | Q2 FY26 (base) | Q1 FY27 | Change on base |
|---|---|---|---|---|
| Revenue from operations | 1,432.66 | 1,068.39 | 1,566.02 | +34.1% |
| Total income | 1,550.5 | n/a | about 1,707 | +36% (reported) |
| EBITDA | 984.0 | 690.9 | 1,071.9 | +42.4% |
| Operating EBITDA | 973.1 | 680.26 | about 1,046 | +43.0% (my calculation) |
| Profit (consolidated) | 809.15 | 558.43 | 874.02 | +44.9% |
| EBITDA margin (my calculation) | 68.7% | 64.7% | 68.4% | +4.0 pt |
Cite this table: PositionalCalls, “BSE Q2 Results Key Numbers Table, as of 5 November 2026”.
These BSE Q2 results FY27 are for the quarter ended 30 September 2026, announced on 4 November 2026. Confirm the filing on the BSE website. For other large companies in the same weeks, see the Q2 results calendar.
Which BSE profit figure is right? Rs 809 crore, Rs 808 crore and the standalone line
The BSE net profit Q2 FY27 headline is Rs 809.15 crore on a consolidated basis; some headlines say Rs 808 crore, which is the figure for continuing operations, and the standalone company earned Rs 773.4 crore.
| Profit line | Q2 FY27 | Q2 FY26 | Change | What it is |
|---|---|---|---|---|
| Consolidated net profit | 809.15 | 558.43 | +44.9% | Used as the headline here (Business Standard, Hans India, Multibagg) |
| Continuing operations | 807.52 | 557.02 | n/a | Multibagg; some headlines round this to Rs 808 crore |
| Standalone profit | 773.4 | 514.5 | +50.3% | Parent company only (Multibagg) |
| Q1 FY27 consolidated profit | 874.02 | n/a | n/a | Earlier reports showed Rs 872.66 or Rs 873 crore |
| H1 FY27 profit attributable | 1,680 | 1,095 | +53.4% | Half-year, as reported |
Cite this table: PositionalCalls, “BSE Q2 Results Profit Lines and Conflicts, as of 5 November 2026”.
The half-year check does not tie exactly: Rs 809.1 crore plus Rs 874.02 crore is Rs 1683.2 crore, against Rs 1,680 crore reported for the half-year. The gap of about Rs 3 crore looks like the difference between consolidated profit and profit attributable to shareholders, or a revised Q1 (my inference, not stated). Check the filing for the exact line.
BSE net profit Q2 FY27 is compared with Q1 on the newer line. The older preview on this page used Rs 873 crore for Q1. The newer reports show Rs 874.02 crore, so the Q1 comparison here is -7.4% on the newer line (my calculation).
BSE Q2 results FY27 EBITDA: is it Rs 984 crore, Rs 980 crore or Rs 973 crore?
BSE EBITDA Q2 FY27 is Rs 984 crore at a 68.7% margin on one definition, Rs 973.1 crore operating EBITDA at 68% on the company’s own, and Rs 980 crore in a brokerage summary; all are up about 42% to 43% on the base.
| EBITDA line | Q2 FY27 | Q2 FY26 | Change | Margin |
|---|---|---|---|---|
| EBITDA (Multibagg and Hans India) | 984.0 | 690.9 | +42.4% | 68.7% vs 64.7% |
| Operating EBITDA, incl. core SGF contribution | 973.1 | 680.26 | +43.0% | 67.9% vs 63.7% (company: 68% vs 64%) |
| EBITDA in a brokerage summary | 980 | n/a | +42%, down 8% on Q1 | 68.7%; described as a 6% beat |
| Q1 FY27 on the 984 basis | 1,071.9 | n/a | n/a | 68.45% |
Cite this table: PositionalCalls, “BSE Q2 Results EBITDA Definitions, as of 5 November 2026”.
The two bases are about Rs 11 crore apart, which fits an other-income line sitting inside one and outside the other. Operating EBITDA of Rs 973.1 crore also lines up with the half-year figure: Rs 2,019 crore for H1 less Rs 973.1 crore leaves about Rs 1,046 crore for Q1, which matches the Rs 1,046 crore operating EBITDA the earlier preview used (my calculation). So use operating EBITDA when you compare with the Q1 base of Rs 1,046 crore, and the Rs 984 crore line when you compare with Rs 1,071.9 crore.
The margin story is steady rather than dramatic: about 4 percentage points higher than a year ago and slightly higher than Q1 on the same basis, even though revenue fell 8.5%.
How do the BSE Q2 results FY27 turn Rs 1,433 crore of revenue into Rs 809 crore of profit?
Revenue from operations of Rs 1,433 crore less Rs 494.7 crore of operating expenses leaves about Rs 938 crore; adding Rs 36.5 crore of treasury income gets to about Rs 974 crore, close to the reported operating EBITDA of Rs 973.1 crore.
| Step | Rs crore | Source or calculation |
|---|---|---|
| Revenue from operations | 1,432.7 | Reported |
| Operating expenses | -494.7 | Reported; +20.6% on Rs 410.1 crore (one report says +21.0%) |
| Subtotal | 938.0 | My calculation |
| Treasury income on clearing and settlement funds | +36.5 | Reported; Rs 42.8 crore a year ago (-15%) |
| Subtotal | 974.5 | Reported operating EBITDA is 973.1, a gap of 1.4 (not reconciled) |
| Total income | 1,550.5 | Reported; other income of about 118 on top of revenue (my calculation) |
| Consolidated profit | 809.15 | 56.5% of revenue from operations (my calculation) |
Cite this table: PositionalCalls, “BSE Q2 Results Revenue-to-Profit Walk, as of 5 November 2026”.
Operating expenses took 34.5% of revenue against 38.4% a year ago, which is the operating leverage behind the wider margin. Profit was 56.5% of revenue from operations against 52.3% a year ago and 55.8% in Q1 (my calculation). Profit before tax and the tax charge were not in the reports I could open, so I cannot walk the last step.
What drove the BSE Q2 results FY27? Transaction charges and record turnover
BSE transaction charges Q2 FY27 were Rs 1,127.8 crore, up 42%, and made up about 79% of revenue from operations against 74% a year ago, helped by record equity cash and index options turnover.
| Driver | Q2 FY27 | Reference | Source note |
|---|---|---|---|
| Transaction charges | Rs 1,127.8 crore | Rs 794 crore in Q2 FY26 (+42.0%) | Multibagg |
| Share of revenue from operations | 78.7% | 74.3% a year ago (my calculation) | My calculation |
| Equity cash daily turnover | Rs 10,494 crore | Highest ever for a quarter | Business Standard |
| Derivatives premium daily turnover | Rs 22,531 crore | Not stated | Business Standard |
| Monthly index options premium daily turnover | Rs 35,481 crore | All-time high | Business Standard |
| Treasury income | Rs 36.5 crore | Rs 42.8 crore a year ago | Multibagg |
Cite this table: PositionalCalls, “BSE Q2 Results Revenue Drivers, as of 5 November 2026”.
In the BSE Q2 results FY27, as for any exchange, volume is the engine, so the lines that matter first are transaction charges and turnover. The weak spot is treasury income, which fell because it depends on funds held and interest rates rather than trading. Listing and corporate-service income was not broken out in the reports I could open.
Using the half-year transaction charges of Rs 2,456 crore, the implied Q1 figure is about Rs 1,328 crore, so Q2 transaction charges fell about 15% from Q1 (my calculation). That is the main reason profit dipped from the record.
PositionalCalls WhatsApp channel
BSE, NSE and the next big results
- The base to beat and the right definitions before the next exchange result
- Which EBITDA and profit line each report uses, flagged clearly
- The closing price move and brokerage views the day they appear
Why do the BSE Q2 results FY27 show profit 7% below Q1?
Profit fell 7.4% from Rs 874.02 crore because revenue fell 8.5% while costs held up; I found no stated reason from BSE, but the implied fall in transaction charges of about 15% points to lower derivatives income.
| Rs crore, consolidated | Q2 FY27 | Q1 FY27 | Change |
|---|---|---|---|
| Revenue from operations | 1,432.66 | 1,566.02 | -8.5% |
| Transaction charges (Q1 implied from the half-year) | 1,127.8 | about 1,328 | about -15% |
| Operating expenses (Q1 implied from the half-year) | 494.7 | about 485 | about +1.9% |
| EBITDA | 984.0 | 1,071.9 | -8.2% |
| Profit | 809.15 | 874.02 | -7.4% |
Cite this table: PositionalCalls, “BSE Q2 Results Sequential Comparison, as of 5 November 2026”.
Operating expenses were roughly flat while revenue fell, so the margin was little changed. The implied Q1 expense line of about Rs 485 crore is lower than the roughly Rs 520 crore my earlier preview derived from revenue and operating EBITDA, which suggests the two reports use different expense definitions (my inference). Treat the Q1 implied lines as approximate.
A single quarter does not show a trend. The year-on-year growth of 45% is the cleaner comparison, and the record turnover figures show activity itself stayed strong. BSE’s Q2 profit rose about 45% on the year but fell 7.4% from Q1, and the capital market sector outlook 2026 page splits both comparisons across NSE, CDSL, Angel One and HDFC AMC.
What does the half-year look like in the BSE Q2 results FY27?
In the BSE Q2 results FY27 half-year table, BSE reported operating revenue of Rs 2,999 crore (+48%), transaction charges of Rs 2,456 crore (+60%) and profit attributable to shareholders of Rs 1,680 crore (+53%).
| Rs crore | H1 FY27 | H1 FY26 | Change |
|---|---|---|---|
| Operating revenue | 2,999 | 2,026 | +48% |
| Consolidated revenue | 3,257 | 2,184 | +49% |
| Transaction charges | 2,456 | 1,531 | +60% |
| Operating expenses | 980 | 721 | +36% |
| Operating EBITDA (margin 67% vs 64%) | 2,019 | n/a | +55% |
| Net profit attributable to shareholders | 1,680 | 1,095 | +53.4% |
Cite this table: PositionalCalls, “BSE H1 FY27 Results Table, as of 5 November 2026”.
Revenue grew faster than expenses in the half-year (+48% against +36%), which is the pattern behind the wider margin. The earlier preview’s scenario table suggested a half-year profit of about Rs 1,746 crore if Q2 matched Q1; the reported Rs 1,680 crore is below that, in line with Q2 coming in under the record (my comparison with the preview).
BSE share price after Q2 results: how did the stock react on 5 November?
BSE closed at Rs 3,601.50 on 4 November, down 1.75%, before the results; on 5 November it opened about 2% higher near Rs 3,665, hit Rs 3,773 and was up 4.2% at Rs 3,755 at 10:25 AM, as reported.
| Date and time (IST) | Reported price or move | Source type |
|---|---|---|
| Wed 4 Nov, 3:30 PM close | Rs 3,601.50 on NSE, down 1.75% (Rs 64.20) | Hans India, as price ahead of the results |
| Wed 4 Nov, from about 6:29 PM | First reports of the results appear | Business Standard timestamp |
| Thu 5 Nov, 9:15 AM open | About Rs 3,665 on NSE, near 2% higher | Business Standard |
| Thu 5 Nov, intraday high | Rs 3,773, about 4.8% above the close (my calculation) | Business Standard |
| Thu 5 Nov, 10:25 AM | Rs 3,755, up 4.2% | Business Standard |
| Thu 5 Nov, 3:30 PM close | Not available at Thursday, 5 November 2026, 11:30 AM IST | To add after the close |
Cite this table: PositionalCalls, “BSE Q2 Results Share Price Trail, as of 5 November 2026”.
For the BSE Q2 results FY27, the Business Standard headline says the stock rose 5%; the text shows that was the intraday peak, not the 10:25 AM level, so I use the specific prices. The 1.75% fall on 4 November came before the numbers were public (my reading of the timestamps), so it is not a reaction to them.
Last year the stock rose as much as 7% the day after Q2 FY26 results, and in August 2026 it opened lower after a record Q1, as the earlier preview reported. Profit and price are different questions. PositionalCalls is not a SEBI-registered research analyst, so this page publishes no price targets or buy, sell or hold views.
What did brokerages say after the BSE Q2 results FY27?
Two brokerages were reported as keeping positive ratings after the results: Motilal Oswal with a Rs 4,200 target and PL Capital with Rs 4,015, and Motilal Oswal raised FY27 and FY28 earnings estimates by 3% and 5%.
| Brokerage | Reported view | Reason given | Source |
|---|---|---|---|
| Motilal Oswal | Buy reiterated; target Rs 4,200 | Raised FY27 and FY28 earnings estimates by 3% and 5% on strong October volumes; called EBITDA a 6% beat | Business Standard, 5 Nov |
| PL Capital | Buy reiterated; target Rs 4,015 | Expects FY27 operating revenue growth of 24% | Business Standard, 5 Nov |
Cite this table: PositionalCalls, “BSE Q2 Results Brokerage Views, as Reported, as of 5 November 2026”.
These are other firms’ views, reported as published and not endorsed by PositionalCalls. Targets change quickly and are not a prediction. Other brokerages, including Jefferies, JP Morgan and Goldman Sachs, may have published notes; I could not open the pages that covered them, so I do not list them.
The 6% beat is Motilal Oswal’s comparison with its own estimate; I did not find the estimate itself or a market consensus, so I cannot give the beat in rupees.
What did the BSE board decide with the Q2 results?
The board accepted an offer from MMRDA for a plot at Bandra Kurla Complex for additional premises and appointed Ashutosh Singh as Executive Director, and none of the reports I read mentioned a dividend.
| Item | What was reported | Source note |
|---|---|---|
| BKC plot | Board approved accepting the MMRDA offer of allotment, to develop additional premises and infrastructure | Business Standard and Hans India |
| Allotment conditions | Subject to documentation, regulatory conditions and definitive agreements | Hans India |
| Executive director | Ashutosh Singh, Executive Director (Business, Vertical 3) from 30 November 2026 for five years, subject to shareholder ratification | Hans India |
| Dividend | Not mentioned in the reports I read | Check the exchange filing |
Cite this table: PositionalCalls, “BSE Q2 Results Board Decisions, as of 5 November 2026”.
The plot does not change Q2 profit in the BSE Q2 results FY27; it is a capital-expenditure and capacity decision. No price or cost for the plot was in the reports I read.
What to watch in the BSE Q3 FY27 results
At Q3 FY27, check transaction charges against Rs 1,127.8 crore, operating EBITDA margin against 68%, and whether turnover stays near the record levels.
| What to read | Q2 FY27 mark | Question to ask |
|---|---|---|
| Transaction charges | Rs 1,127.8 crore | Did derivatives turnover hold after the record quarter? |
| Operating EBITDA margin | 68% | Did costs stay near Rs 495 crore a quarter? |
| Consolidated profit | Rs 809.15 crore | Did it reach back above the Q1 record of Rs 874.02 crore? |
| Treasury income | Rs 36.5 crore | Did it fall again? |
| Capex | BKC plot accepted | Were costs or timelines disclosed? |
| Regulation | Not covered in the reports I read | Any change in derivatives rules or expiry days? |
Cite this table: PositionalCalls, “BSE Q2 Results Decoder, as of 5 November 2026”.
No Q3 FY27 results date is confirmed as of Thursday, 5 November 2026, 11:30 AM IST. Last year BSE reported Q3 in February, so a February date is likely, but the exchange will announce it through its own notice.
Which other results are near BSE’s?
SBI, Apollo Hospitals and Hindalco sit in the same results window, and the rival exchange is covered in the NSE page.
| Company | Date reported | Our page |
|---|---|---|
| SBI | Tue, 3 Nov 2026 (single source) | SBI Q2 results FY27 |
| BSE | Wed, 4 Nov 2026 | This page |
| Apollo Hospitals | Wed, 4 Nov 2026 | Apollo Hospitals Q2 results FY27 |
| Hindalco | Fri, 6 Nov 2026 | Hindalco Q2 results FY27 |
| NSE | Not a listed company | NSE Q3 results and IPO path |
Cite this table: PositionalCalls, “BSE Q2 Results Peer Window, as of 5 November 2026”.
For BSE’s earlier-quarter detail read the BSE Q3 results FY26 analysis. All dates are on the Q2 results calendar.
What most people miss in the BSE Q2 results FY27
Most pages repeat the 45% profit growth; the details that change the picture are the 7% fall from Q1, the three EBITDA figures, the implied drop in transaction charges and the price rise that is only intraday.
What the results mean for shareholders: tax, NRIs and scam warnings
The BSE Q2 results FY27 alone need no action, and none of the reports I read mentioned a dividend, so check the exchange filing before assuming one.
- What you need: nothing special. BSE shares trade on NSE and BSE like any other listed stock.
- Tax angle: gains on sale and any dividend are taxed under current rules. Check our guide to capital gains tax on shares or ask a tax adviser.
- NRI note: NRIs buy through a PIS account with limits that changed in 2026. See NRI investment in the Indian stock market.
- Costs: brokerage and demat charges vary, so check your broker’s current schedule.
- Scam warning: fake “results alert” groups and tip sellers use well-known company names. No genuine result needs your OTP or an app download.
Related: SBI Q2 results FY27, Apollo Hospitals Q2 results FY27, Hindalco Q2 results FY27 and Muhurat trading 2026. More in Earnings.
Analyst’s note
- What stands out: the BSE Q2 results FY27 show a 45% jump on last year, driven by transaction charges and record turnover, with profit still below the Q1 record.
- Easy to miss: the three EBITDA figures and the half-year check that does not tie exactly.
- What would change the view: the filing showing a one-off in other income, or Q3 transaction charges falling again.
- Caution: the share price figures are from mid-morning and may have changed by the close.
- Reader action: name the EBITDA and profit line before comparing, open the filing and re-check the close after 3:30 PM.
Bottom line
BSE posted a 45% rise in profit on record turnover, with revenue and profit slipping from the record Q1. Name the EBITDA and profit line before you compare, and re-check the share price after the close.
Next read: the Q2 results calendar.
Part of the Earnings series.
PositionalCalls WhatsApp channel
Never miss a results-day update
- Same-day decoders for the biggest companies reporting
- Record dates and dividend amounts checked against filings
- Corrections posted openly when a number changes
BSE Q2 results FY27: frequently asked questions
When were the BSE Q2 results FY27 announced?
BSE announced its Q2 FY27 results on Wednesday, 4 November 2026 for the quarter ended 30 September 2026, with the first reports from about 6:29 PM IST. Its results call was at 6:30 PM IST.
What was BSE’s net profit in Q2 FY27?
Consolidated profit was Rs 809.15 crore, up 44.9% from Rs 558.43 crore. Continuing operations were Rs 807.52 crore. Confirm the profit line in the exchange filing before using it.
What was BSE’s revenue in Q2 FY27?
Revenue from operations was Rs 1,432.66 crore, up 34.1% from Rs 1,068.39 crore and down 8.5% from Rs 1,566.02 crore in Q1. Total income was Rs 1,550.5 crore.
What was BSE’s EBITDA and margin?
EBITDA was Rs 984 crore at 68.7% on one basis, and operating EBITDA was Rs 973.1 crore at about 68%. A brokerage summary shows Rs 980 crore. All are up about 42% to 43% on a year ago.
Why did BSE profit fall from Q1 FY27?
Profit fell 7.4% from Rs 874.02 crore while revenue fell 8.5%. I found no stated reason; the implied fall in transaction charges of about 15% points to lower derivatives income (my calculation).
What drove BSE’s revenue growth?
Transaction charges rose 42% to Rs 1,127.8 crore. Equity cash turnover hit a record Rs 10,494 crore a day, and monthly index options premium turnover a record Rs 35,481 crore a day.
How did the BSE share price react to the Q2 results?
BSE closed at Rs 3,601.50 on 4 November, before the results. On 5 November it reached Rs 3,773 and was up 4.2% at Rs 3,755 at 10:25 AM, as reported. I will add the close after 3:30 PM.
Did BSE declare a dividend with the Q2 results?
The reports I read did not mention a dividend. The board did accept an MMRDA offer for a plot at Bandra Kurla Complex. Check the NSE or BSE announcements page for any dividend notice.
What did brokerages say about BSE after Q2?
Motilal Oswal was reported as keeping a Buy with a Rs 4,200 target and raising earnings estimates by 3% and 5%; PL Capital was reported with Buy and Rs 4,015. These are their views, not PositionalCalls advice.
When are BSE Q3 FY27 results?
The company has not announced a date as of Thursday, 5 November 2026, 11:30 AM IST. Last year BSE reported in February. Watch for the board meeting notice on the BSE and NSE announcement pages.
Sources
- BSE website: where the filing appears (I could not open the filing itself).
- Business Standard, 4 November 2026 (results and board decisions)
- The Hans India, 4 November 2026 (results and closing price)
- Multibagg, 4 November 2026 (results table) (AI-generated summary; the results and H1 table)
- Business Standard, 5 November 2026 (price move, brokerages, volumes)
- PL Capital note, August 2026
- Zeebiz and India IPO pages on these results could not be opened; their headlines were seen in search only.
PositionalCalls.com is not a SEBI-registered research analyst or investment adviser. Investments in securities markets are subject to market risks. Read all related documents carefully before investing. Returns are never guaranteed. PositionalCalls is an independent Indian stock market research and education site founded by Shubham Chaudhary. This page is education and results analysis, not a recommendation to buy, sell or hold any security. How I researched this: I read press and data-platform reports of the results, cross-checked profit, revenue and EBITDA between them, recomputed every derived number, and listed conflicts openly. I have not opened the company filing directly.

Shubham Chaudhary is the founder of PositionalCalls, an independent Indian stock market research website. He writes company fundamentals, quarterly results analysis, IPO analysis and sector research for NSE and BSE listed companies, with a focus on banking stocks, insurance and long-term value investing. Every article is built from primary sources such as RBI, SEBI, NSE and BSE filings and company annual reports, and states its risks plainly in simple language for retail investors.
Coverage areas Our research standards- Numbers checked against NSE, BSE and SEBI filings
- Risks and limits stated in every article
- No paid promotions or broker tie-ups
- Articles updated when new filings arrive