
Earnings · Q2 FY27 results scorecard
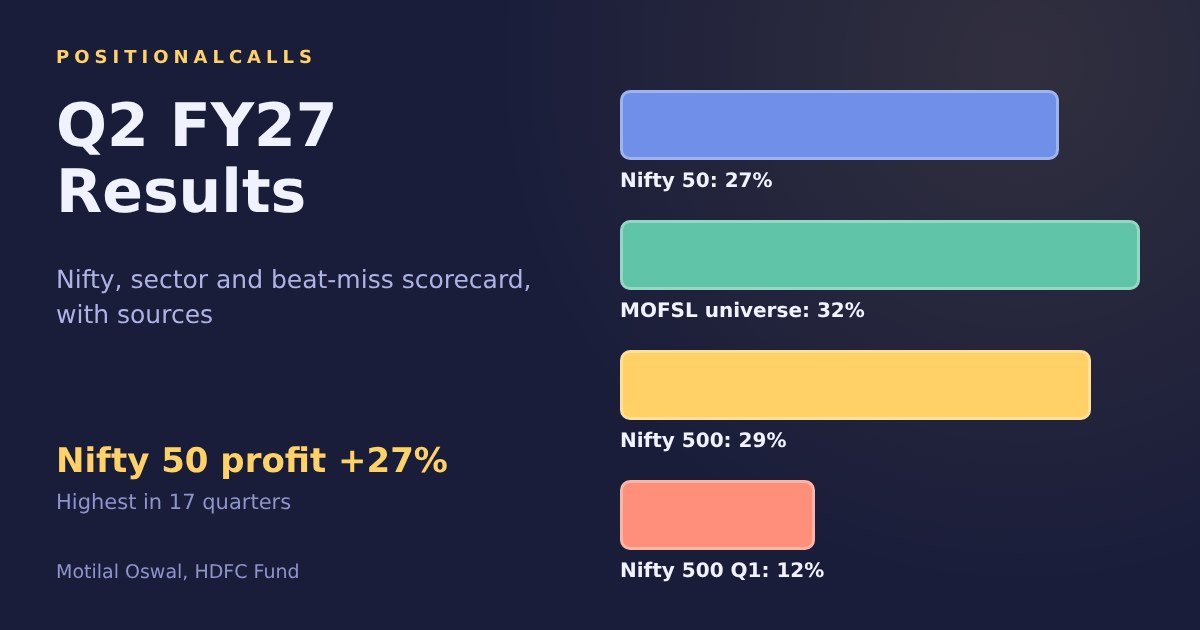
The Q2 FY27 results season closed on 14 November 2026 with the fastest Nifty 50 profit growth in 17 quarters, according to Motilal Oswal. This Q2 FY27 results scorecard sets the Nifty 50, Nifty 500, sector, market-cap and beat-miss figures side by side, names who supplied the growth, and keeps each number tied to its source and universe.
Quick answer
The Q2 FY27 results showed Nifty 50 profit after tax up 27% year on year, a 17-quarter high, per Motilal Oswal. HDFC Fund, on a different universe, shows Nifty 500 profit up 29%, with 17 of 22 sectors in double digits. Oil and gas, metals, banks and autos drove most of it, and analysts expect slower second-half growth.
Q2 FY27 results: key takeaways
- Nifty 50: profit after tax grew 27% year on year, above Motilal Oswal’s 24% estimate.
- Broader market: Nifty 500 net profit grew 29%, and about 75% of its companies grew profit.
- Drivers: BFSI, metals, oil and gas and autos supplied 77% of the incremental earnings growth.
- Concentration: five companies supplied 46% of Nifty incremental earnings accretion.
- Ahead: second-half FY27 growth is expected at 18% for the Nifty universe, an estimate and not a result.
In plain words: each quarter listed companies report how much profit they made. Analysts compare that profit with the same quarter a year earlier and with their own forecasts, and then group the companies by index, sector and size. The Q2 FY27 results cover July to September 2026. A “beat” means a company reported more than analysts expected. This page reports who measured what, and does not say which shares to buy.
Data note: as of Friday, 20 November 2026, 7:16 AM IST. Nifty 50, MOFSL-universe, market-cap and beat-miss figures come from Motilal Oswal’s 2QFY27 review as carried by Business Today and Investment Guru India. Nifty 500 and sector figures come from HDFC Fund (Kotak Institutional Equities, Capitaline, ICICI Securities). Counts come from Tapetide and Sovrenn. Figures marked my calculation use only numbers on this page. I did not open the Motilal Oswal report itself, the NSE earnings review or any company filing.
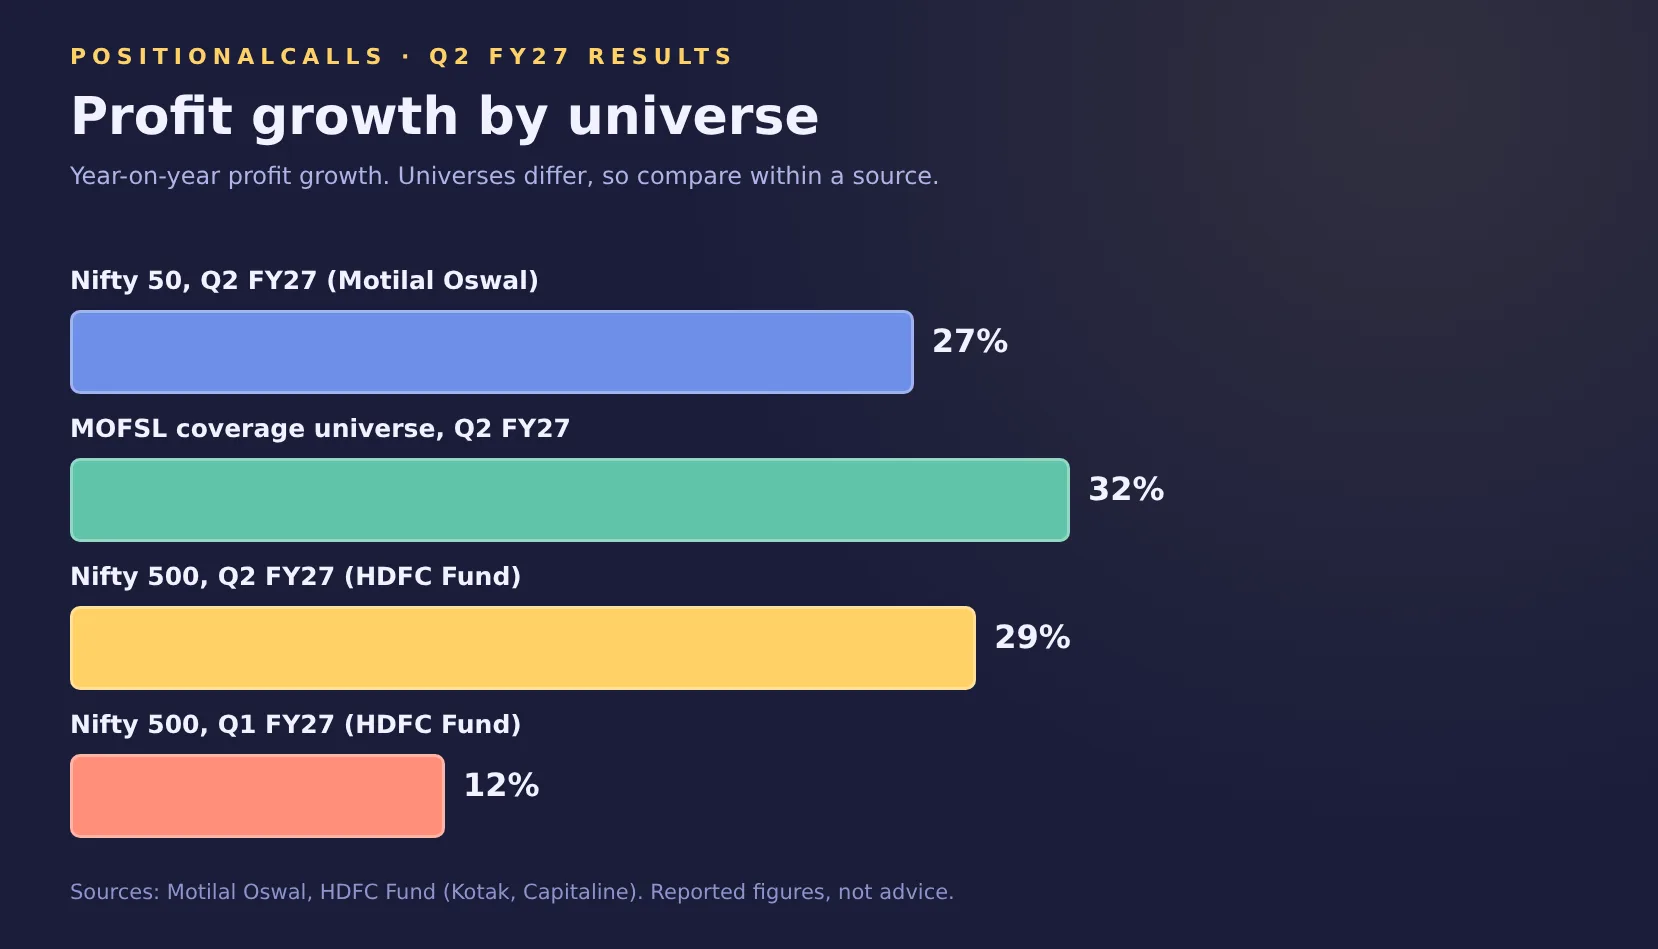 Profit growth reported for the Q2 FY27 results, by universe and source. Sources: Motilal Oswal and HDFC Fund; universes are not the same.
What were the headline Q2 FY27 results for India Inc?
The Q2 FY27 results showed Nifty 50 profit after tax up 27% year on year, which Motilal Oswal calls the highest growth in 17 quarters. Its wider coverage universe reported 25% sales growth, 23% EBITDA growth and 32% PAT growth, and 30% PAT growth excluding oil marketing companies. All of these beat its own estimates, which is why the season was described as a broad-based beat.
| Measure | Q2 FY27 actual | Motilal Oswal estimate | Universe |
|---|---|---|---|
| Nifty 50 PAT growth | 27% | 24% | Nifty 50 |
| Sales growth | 25% | 19% | MOFSL universe |
| EBITDA growth | 23% | 17% | MOFSL universe |
| PAT growth | 32% | 21% | MOFSL universe |
| PAT growth excluding OMCs | 30% | 24% | MOFSL universe |
| EBITDA margin excluding financials | 17.5% | 17.0% | MOFSL universe |
Cite this table: PositionalCalls, “Q2 FY27 scorecard”; Motilal Oswal 2QFY27 review as carried by Investment Guru India and Business Today.
Motilal Oswal calls the Nifty result broadly in line with its estimate, since 27% sits against 24%, while the wider universe beat by a larger margin. The gap between the 32% and 30% figures shows oil marketing companies added to growth but did not create it. I read the percentages as the reported aggregate of company profits, and not as the growth of any single company.
Why do the Q2 FY27 results differ between Motilal Oswal, Kotak and NSE?
They differ because each provider counts a different set of companies, and a “Nifty 500” figure is not a “Nifty 50” figure. Motilal Oswal tracks its own coverage universe and the Nifty 50. HDFC Fund quotes Kotak Institutional Equities and Capitaline data for the Nifty 500, and Tapetide takes a median across every company that has reported. The table lines up the figures by source so you compare like with like.
| Source | Universe | Q2 FY27 profit growth | Type of figure |
|---|---|---|---|
| Motilal Oswal | Nifty 50 | 27% | Aggregate PAT |
| Motilal Oswal | MOFSL coverage universe | 32% | Aggregate PAT |
| Motilal Oswal | MOFSL universe excluding OMCs | 30% | Aggregate PAT |
| HDFC Fund (Kotak, Capitaline) | Nifty 500 | 29% | Net profit |
| HDFC Fund (Kotak, Capitaline) | Nifty 500 excluding oil and gas | 24% | Net profit |
| Tapetide | All reporters (5,672 of 5,696) | 11.5% median | Median per company |
Cite this table: PositionalCalls, “Q2 FY27 scorecard”; Motilal Oswal, HDFC Fund and Tapetide as named; universes differ.
An aggregate is dominated by large profits, so a few big companies can lift it. A median ignores size and shows the typical company, which is why Tapetide’s 11.5% sits far below the aggregates. Neither is wrong. For a question about index earnings, the aggregates answer it. For a question about a typical listed company, the median does. The Q1 comparison later on this page shows the same effect.
Which sectors led the Q2 FY27 results?
Metals and mining grew profit 88% and oil and gas 61% in the Q2 FY27 results, according to HDFC Fund, with banks and other financials each up 20%. Seventeen of 22 sectors reported double-digit profit growth, two grew in single digits and three declined. Motilal Oswal adds that BFSI, metals, oil and gas and automobiles together supplied 77% of the incremental year-on-year earnings growth.
| Sector | Q2 FY27 profit growth | Source |
|---|---|---|
| Metals and mining | 88% | HDFC Fund |
| Oil and gas | 61% | HDFC Fund |
| Banks | 20% | HDFC Fund |
| Other financials | 20% | HDFC Fund |
| Insurance | 17% | HDFC Fund |
| Industrials (median, 1,098 companies) | 17.8% | Tapetide |
| Commodities (median, 575 companies) | 16.7% | Tapetide |
| Information technology (median, 312 companies) | 0.0% | Tapetide |
Cite this table: PositionalCalls, “Q2 FY27 scorecard”; HDFC Fund sector growth is aggregate, Tapetide is a per-company median; the two columns are not comparable.
Read the table as two lenses. HDFC Fund’s figures are sector aggregates, so one large company can set a sector number. Tapetide’s are medians across many small companies, so IT shows 0.0% even while large IT companies reported positive profit. For sector detail see the banking, metal, auto, energy and PSU and IT outlook pages.
Who supplied the growth in the Q2 FY27 results?
Reliance Industries, ONGC, Tata Motors PV, JSW Steel and SBI together accounted for 46% of the Nifty 50’s incremental year-on-year earnings accretion, per Motilal Oswal. That concentration is the main caution on the 27% headline: take away a handful of names and the rest of the index grew less. Business Today carries the same five names, and neither source gives each company’s rupee contribution.
| Company | Sector | Named as a top contributor | Our page |
|---|---|---|---|
| Reliance Industries | Oil, gas and telecom | Yes | Reliance Q2 results |
| ONGC | Oil and gas | Yes | ONGC Q2 results |
| Tata Motors PV | Autos | Yes | Auto sector outlook |
| JSW Steel | Metals | Yes | Metal sector outlook |
| SBI | Banking | Yes | SBI Q2 results |
Cite this table: PositionalCalls, “Q2 FY27 scorecard”; contributor names from Motilal Oswal via Investment Guru India and Business Today.
Motilal Oswal’s separate note on upgrades credits Reliance Industries, JSW Steel, HDFC Bank, Hindalco and Mahindra and Mahindra for the rise in its Nifty EPS estimate. See the Hindalco and M&M pages for those two. Concentration cuts both ways: a few large earners lifted the aggregate, and a few could also drag it in a weaker quarter.
Did large, mid and small caps all deliver in the Q2 FY27 results?
Yes: Motilal Oswal shows large caps up 31%, mid caps up 22% and small caps up 32% excluding oil marketing companies, each at or above its estimate. HDFC Fund shows the same ranking for the Nifty 500, with mid caps the slowest. The small-cap figure was helped by a low base, since the same companies grew only 6% in the year-ago quarter.
| Segment | Motilal Oswal actual | Motilal Oswal estimate | HDFC Fund, incl. oil and gas | HDFC Fund, excl. oil and gas |
|---|---|---|---|---|
| Large caps | 31% | 24% | 32% | 26% |
| Mid caps | 22% | 20% | 20% | 21% |
| Small caps | 32% | 29% | 31% | 22% |
Cite this table: PositionalCalls, “Q2 FY27 scorecard”; Motilal Oswal (94 large, 105 mid, 196 small companies, excluding OMCs) and HDFC Fund (Nifty 500).
The small-cap spread is the number to treat with care. Motilal Oswal shows 32%, HDFC Fund shows 31% including oil and gas and 22% excluding it, so the small-cap result depends on the definition and on one sector. HDFC Fund also notes mid-cap growth of 20% was up from 4% in Q1, which is a large swing from a low starting point.
How many companies beat estimates in the Q2 FY27 results?
Motilal Oswal reports that 42% of companies in its universe beat PAT estimates and 26% missed, with 28 sectors meeting or beating expectations. By size, 42% of large caps, 37% of mid caps and 45% of small caps beat. A different tracker, Tapetide, shows 164 beats and 172 misses among 378 companies with analyst estimates, which is a different and undated sample.
| Group | Beat | Miss or other | Source |
|---|---|---|---|
| MOFSL universe, PAT | 42% | 26% missed | Motilal Oswal |
| Large caps | 42% | Not given | Motilal Oswal |
| Mid caps | 37% | Not given | Motilal Oswal |
| Small caps | 45% | Not given | Motilal Oswal |
| Companies with estimates (378) | 164 | 172 misses | Tapetide |
| Estimate upgrades above 3% | 119 companies | 104 downgrades; ratio 1.1x | Motilal Oswal |
Cite this table: PositionalCalls, “Q2 FY27 scorecard”; Motilal Oswal 2QFY27 review via Investment Guru India; Tapetide sector page, undated.
An estimate-beat rate depends on who set the estimate. Motilal Oswal measures against its own forecasts, which it lowered into the quarter, while Tapetide uses analyst consensus for a wider set of smaller names. The two rates answer different questions. Where the sample is not stated, I have not combined them.
What happened to margins and revenue in the Q2 FY27 results?
Margins improved slightly: Motilal Oswal shows an EBITDA margin of 17.5% excluding financials against a 17.0% estimate, and HDFC Fund shows 17.0% against 16.7% in Q1. The two margin figures differ because of the universe. Revenue grew 25% in Motilal Oswal’s universe and 23% for the Nifty 500, and outside financials EBITDA grew faster than revenue.
| Measure | Figure | Source |
|---|---|---|
| EBITDA margin excluding financials | 17.5% vs 17.0% estimate | Motilal Oswal |
| EBITDA margin, companies outside financials | 17.0% vs 16.7% in Q1 | HDFC Fund |
| EBITDA margin excluding oil and gas | 18.5%, steady | HDFC Fund |
| Nifty 500 revenue growth | 23% | HDFC Fund |
| Outside financials: EBITDA growth vs revenue growth | 28% vs 26% | HDFC Fund |
| MOFSL universe sales growth | 25% vs 19% estimate | Motilal Oswal |
Cite this table: PositionalCalls, “Q2 FY27 scorecard”; Motilal Oswal and HDFC Fund as named; margin universes differ.
When EBITDA grows faster than revenue, margins widen, which is the operating leverage that analysts look for. HDFC Fund adds that oil and gas was the largest contributor and fuel marketing margins stayed under pressure, and that construction materials cost pressure may rise before it eases in early FY28. These are its caveats, and I have not tested them against filings.
How do the Q2 FY27 results compare with Q1 and with last year?
Profit growth accelerated through FY27: Motilal Oswal recorded Nifty growth of 18% in Q1 FY27 and 27% in Q2, while the Nifty 500 went from 12% to 29% on HDFC Fund’s data. A year earlier, Q2 FY26 Nifty profit grew only 2%, the sixth single-digit quarter in a row, so the Q2 FY27 results sit on a low base. First-half FY27 growth was 22% for both Motilal Oswal universes.
PositionalCalls WhatsApp channel
Get results-season explainers on WhatsApp
- Quarterly results summaries, dated
- Sources named on every page
- Links to updated guides
| Period | Nifty 50 PAT growth (Motilal Oswal) | Nifty 500 growth | Note |
|---|---|---|---|
| Q2 FY26 | 2% vs 5% estimate | Not given in sources read | Sixth single-digit quarter |
| Q1 FY27 | 18% vs 10% estimate | 12% (HDFC Fund); 11.1% (NSE) | Strongest in 10 quarters |
| Q2 FY27 | 27% vs 24% estimate | 29% (HDFC Fund) | Highest in 17 quarters |
| H1 FY27 | 22% | Not given | Same for MOFSL and Nifty universes |
Cite this table: PositionalCalls, “Q2 FY27 scorecard”; Motilal Oswal, HDFC Fund and NSE Q1 FY27 earnings review as named.
NSE’s Q1 FY27 review put Nifty 50 PAT growth at 11.8% against Motilal Oswal’s 18%, so even official and brokerage numbers for the same index and quarter differ. I did not open NSE’s Q2 review, which the sources I read do not show as published. The comparison tells you direction, and it should not be used as exact arithmetic across providers.
How many companies reported Q2 FY27 results, and by when?
Almost all of them: Tapetide shows 5,672 of 5,696 companies, or 99.5%, with Q2 FY27 results filed. Main-board quarterly results were due within 45 days of the quarter end, which for the September quarter meant 14 November 2026. Sovrenn counted 1,803 companies declared by 4 November and 127 results on 11 November alone.
| Rule or count | Detail | Source |
|---|---|---|
| Main-board quarterly results | Within 45 days of quarter end | Sovrenn |
| Filing after board meeting | Within 30 minutes of the meeting ending | Sovrenn |
| Board meeting notice | At least 2 working days | Sovrenn |
| Annual audited results | Within 60 days of the financial year end | Sovrenn |
| SME-listed companies | Half-yearly, within 45 days of half-year end | Sovrenn |
| Declared by 4 November 2026 | 1,803 companies | Sovrenn |
| Declared on 11 November 2026 | 127 results; exchange counts overlap | Sovrenn |
| Filed in total | 5,672 of 5,696 (99.5%), undated | Tapetide |
Cite this table: PositionalCalls, “Q2 FY27 scorecard”; Sovrenn and Tapetide as named; Tapetide page shows no as-of date.
The September quarter is also when most companies publish a half-yearly balance sheet, with the March quarter being the other. That is why Q2 is the season to read assets, debt and cash. Track dates on the earnings calendar and the Q2 results hub.
What do analysts expect after the Q2 FY27 results?
Motilal Oswal expects second-half FY27 earnings growth of 18% for the Nifty universe and 11% for its own coverage universe, or 20% excluding oil marketing companies. It raised its Nifty FY27 EPS estimate 0.9% to Rs 1,243 and its FY28 estimate 1.4% to Rs 1,427. These are forecasts, and growth is expected to moderate from the first-half pace of 22%.
| Item | Figure | Source |
|---|---|---|
| 2H FY27 growth, Nifty universe (estimate) | 18% | Motilal Oswal |
| 2H FY27 growth, MOFSL universe (estimate) | 11% | Motilal Oswal |
| 2H FY27 growth, MOFSL excluding OMCs (estimate) | 20% | Motilal Oswal |
| Nifty FY27 EPS estimate | Rs 1,243, raised 0.9% | Motilal Oswal |
| Nifty FY28 EPS estimate | Rs 1,427, raised 1.4% from Rs 1,406 | Motilal Oswal |
| Nifty 50 one-year forward multiple, 16 Nov 2026 | 18.7x vs 18.8x 10-year average | HDFC Fund |
Cite this table: PositionalCalls, “Q2 FY27 scorecard”; Motilal Oswal 2QFY27 review and HDFC Fund; all forward figures are estimates.
The 18.7x forward multiple is built on estimates that are themselves being revised. Earnings upgrades above 3% covered 119 companies against 104 downgrades, a ratio of 1.1x, so the revision trend was only mildly positive. This page does not say whether any index level is high or low, and does not give any rating or call.
What should you check before relying on Q2 FY27 results headlines?
Check the universe, the one-offs, the currency and the base before comparing any two Q2 FY27 results numbers. HDFC Fund itself flags that power-sector profit growth was partly driven by one-off items, including prior-period revenue recognised in the quarter, and that IT reported growth was supported by a weaker rupee, with constant-currency growth described as modest.
| Check | Why it matters | Where to look |
|---|---|---|
| Universe | Nifty 50, Nifty 500 and coverage universes give different growth | The report’s definitions |
| Exceptional items | A one-off gain or charge can swing reported profit | P&L and notes in the filing |
| Currency | A weaker rupee lifts reported IT revenue without lifting volumes | Constant-currency figure |
| Base quarter | A weak year-ago quarter flatters growth | Prior-year column |
| OMC effect | Oil marketing profit is volatile and large | Figures excluding OMCs |
| Aggregate or median | Aggregates follow large companies, medians follow typical ones | The method note |
Cite this table: PositionalCalls, “Q2 FY27 scorecard”; caveats from HDFC Fund and Motilal Oswal.
The headline that profit grew 27% is accurate for the Nifty 50 as Motilal Oswal defines it. It does not mean every company grew 27%, and the Tapetide median of 11.5% shows how far the typical company sits below the aggregate. Treat any single number as one view and look for the caveat attached to it.
How do you read one company’s Q2 FY27 results yourself?
Start with the exchange filing, then read the profit and loss, the half-yearly balance sheet, the cash flow and the notes, in that order. The September-quarter filing is the one that carries the balance sheet, so debt, cash and receivables can be checked for the first half of the year. Profit before exceptional items shows the underlying trend, and the auditor’s remarks show what was and was not reviewed.
| Statement | What to read | Question it answers |
|---|---|---|
| Profit and loss | Revenue, EBITDA, profit before exceptional items, PAT | Did earnings grow, and from what? |
| Balance sheet (half-yearly) | Borrowings, cash, receivables, inventory | Is the debt or working capital stretching? |
| Cash flow (half-yearly) | Operating cash flow against profit | Is profit turning into cash? |
| Notes and auditor remarks | Exceptional items, contingent liabilities, review remarks | What is one-off or uncertain? |
| Management commentary | Drivers, guidance, outlook | Why did the numbers move? |
Cite this table: PositionalCalls, “Q2 FY27 scorecard”; general reading order, not a recommendation.
For worked examples of that reading order, see the HUL, ITC, Infosys, Airtel and Jio Platforms pages. Our stock market terms guide explains EBITDA, PAT and YoY if any term is unfamiliar.
What are the risks to the Q2 FY27 results momentum?
The risks named in the sources are fuel marketing margins, one-off gains, currency effects and external volatility, and the same season a quarter earlier showed how quickly growth can slow. NSE’s Q1 FY27 review said energy-led margin pressure dragged profit growth, that consensus FY27 forecasts for the top 200 companies were trimmed by 0.9%, and that geopolitical tensions and currency and commodity-price volatility posed downside risks to earnings.
| Risk named | Source | What it affects |
|---|---|---|
| Fuel marketing margins under pressure | HDFC Fund | Oil and gas profit, the largest contributor |
| One-off items in power | HDFC Fund | Reported power-sector growth |
| Weaker rupee supporting IT growth | HDFC Fund | IT reported against constant-currency growth |
| Construction materials cost pressure before early FY28 | HDFC Fund | Cement and construction margins |
| Geopolitical tension, currency and commodity volatility | NSE Q1 FY27 review | Earnings forecasts |
| Slower second-half growth expected | Motilal Oswal | The 11% and 18% second-half estimates |
Cite this table: PositionalCalls, “Q2 FY27 scorecard”; HDFC Fund, NSE Q1 FY27 Corporate Earnings Review and Motilal Oswal as named.
The Q1 experience is the useful reference. Motilal Oswal reported 18% Nifty growth for Q1 and then 27% for Q2, so the trend rose, yet the NSE review showed estimates being trimmed after Q1 and Motilal Oswal’s own revisions after Q2 were small. A strong quarter does not by itself lift forecasts much. Revisions decide the path, and they are published after each season.
What do the terms in the Q2 FY27 results mean?
PAT is profit after tax, EBITDA is operating profit before interest, tax, depreciation and amortisation, and YoY compares a quarter with the same quarter a year earlier. Season reports use these and a few more terms, and the table gives each in plain words.
| Term | Plain meaning | Where it appears |
|---|---|---|
| PAT | Profit after tax, the bottom line | Nifty 50 +27% |
| EBITDA | Operating profit before interest, tax, depreciation and amortisation | MOFSL universe +23% |
| OMC | Oil marketing company, such as IOC | Growth excluding OMCs |
| Beat or miss | Result above or below the estimate | 42% beat, 26% missed |
| Base effect | Growth looks larger when the year-ago figure was low | Q2 FY26 Nifty growth of 2% |
| Forward multiple | Price divided by next-12-month earnings estimate | Nifty at 18.7x |
| Aggregate or median | Total across companies, or the middle company | 27% against 11.5% |
Cite this table: PositionalCalls, “Q2 FY27 scorecard”; plain-language definitions, not from a single source.
Our stock market terms in India page covers more. If a term in a results report is not defined in the report, ask what it is compared with and which companies it covers before accepting the number.
Where do sources differ on the Q2 FY27 results?
Sources differ on the Nifty EPS estimate, on Q1 growth, on the beat count and on the size of the sample, so the table shows each point and how I treated it. None changes the main finding that Q2 FY27 profit growth was strong and broad, though the exact percentage depends on who measured it and on which companies they counted.
| Point | Source A | Source B | How I treated it |
|---|---|---|---|
| Nifty FY27 EPS estimate | Motilal Oswal interim review, 2 Nov: raised 1.1% to Rs 1,247 | Motilal Oswal full review, 16 Nov: raised 0.9% to Rs 1,243 | Used the later figure |
| Q1 FY27 Nifty 50 growth | Motilal Oswal: 18% | NSE Q1 review: 11.8% | Shown both; methods differ |
| Beat rate | Motilal Oswal: 42% beat, 26% miss | Tapetide: 164 beats, 172 misses of 378 | Different samples; not combined |
| Profit growth headline | Nifty 50: 27% | Tapetide median: 11.5% | Aggregate and median, explained |
| Reporting counts | Tapetide: 5,672 of 5,696 filed | Sovrenn: 1,803 declared by 4 Nov | Different dates; not combined |
| Small-cap growth | Motilal Oswal: 32% | HDFC Fund: 31% incl., 22% excl. oil and gas | Definition and sector effect |
Cite this table: PositionalCalls, “Q2 FY27 scorecard”; sources as named; no company filing or report PDF opened.
I did not open the Motilal Oswal report itself, the Kotak or Capitaline data, the NSE Q2 corporate earnings review or any company filing. Figures come through Business Today, Investment Guru India, HDFC Fund, Tapetide and Sovrenn. Where a summary and the original could differ, the original governs.
PositionalCalls WhatsApp channel
Earnings updates in one channel
- Result dates and figures, dated
- Plain-English explainers
- Links to new guides
Q2 FY27 results: frequently asked questions
How did Nifty 50 companies perform in the Q2 FY27 results?
Motilal Oswal says Nifty 50 profit after tax rose 27% year on year in the Q2 FY27 results, the fastest in 17 quarters and above its 24% estimate. Reliance Industries, ONGC, Tata Motors PV, JSW Steel and SBI together supplied 46% of the incremental earnings. The figure is Motilal Oswal’s, on its own Nifty universe.
What was Nifty 500 profit growth in the Q2 FY27 results?
HDFC Fund, using Kotak Institutional Equities and Capitaline data, puts Nifty 500 net profit growth at 29% in Q2 FY27, against 12% in Q1. Excluding oil and gas it was 24%, and revenue grew 23%. This differs from the Nifty 50 figure because the universe and the data provider differ.
Which sectors led the Q2 FY27 results?
HDFC Fund shows metals and mining up 88% and oil and gas up 61%, with banks and other financials each up 20% and insurance up 17%. Motilal Oswal says BFSI, metals, oil and gas and automobiles together gave 77% of the incremental year-on-year earnings growth. Power and IT growth carried caveats.
Were the Q2 FY27 results better than analysts expected?
Motilal Oswal says its universe grew profit 32% against a 21% estimate, with 42% of companies beating and 26% missing at the PAT level, and 28 sectors meeting or beating expectations. Tapetide’s tracker shows 164 beats and 172 misses among 378 companies with estimates, a different sample, so the two do not conflict.
Is the profit growth in the Q2 FY27 results only from oil and gas?
No. Motilal Oswal puts growth at 30% excluding oil marketing companies, and HDFC Fund puts Nifty 500 growth at 24% excluding oil and gas, similar to Q1. Oil and gas was still the largest contributor, and HDFC Fund notes fuel marketing margins remained under pressure, so the mix matters.
What do analysts expect after the Q2 FY27 results?
Motilal Oswal expects second-half FY27 earnings growth of 18% for the Nifty universe and 11% for its own universe, or 20% excluding oil marketing companies. It raised its Nifty FY27 EPS estimate 0.9% to Rs 1,243 and FY28 by 1.4% to Rs 1,427. These are estimates, not results, and can change.
What is the Nifty 50 forward multiple after the Q2 FY27 results?
HDFC Fund reports the Nifty 50 at 18.7 times one-year forward earnings on 16 November 2026, against a 10-year average of 18.8 times, using ICICI Securities estimates. It is a point-in-time measure built on forecasts. It says nothing on whether the index will rise or fall.
When did companies have to declare Q2 FY27 results?
Main-board quarterly results are due within 45 days of quarter end, which for the September quarter was 14 November 2026. Companies file within 30 minutes of the board meeting ending, with at least two working days’ notice. SME-listed companies report half-yearly within 45 days of the half-year end, per Sovrenn.
Where can I read a single company’s Q2 FY27 results?
The primary source is the company’s filing on the NSE or BSE website. Our company pages summarise reported figures and name their sources, and the Q2 results hub and earnings calendar list them by date. Press numbers can differ from the filing, so check the filing for any figure you rely on.
How do the Q2 FY27 results compare with last year?
Motilal Oswal recorded Nifty profit growth of just 2% in Q2 FY26 against its 5% estimate, the sixth successive single-digit quarter. A low base makes the 27% comparison look stronger, though the base effect is my reading and not a Motilal Oswal statement. Small-cap growth of 32% was also helped by a 6% base.
Sources for the Q2 FY27 results page
- Business Today: Nifty50 PAT.
- Investment Guru India: Motilal Oswal.
- Investment Guru India: Motilal Oswal.
- Lapaas Voice: Nifty profit.
- HDFC Fund: Q2 FY27.
- Tapetide: Q2 FY27.
- Sovrenn: How to.
- Craytheon: Q2 FY27.
- NSE: Q1 FY27.
- Free Press Journal: 19 sectors.
- AskFuzz: India Inc.
- Motilal Oswal: Review 2QFY26.
- Business Standard: Q2 scorecard.
- Research360: Quarterly results.
- Dr Vijay Malik: Understanding quarterly.
- Not opened: the Motilal Oswal report PDF, the Kotak Institutional Equities and Capitaline data, the NSE Q2 corporate earnings review, ICICI Securities estimates and any company filing; Tapetide pages show no as-of date; Craytheon, AskFuzz and Lapaas Voice points rest on search snippets; calculations are mine.
PositionalCalls.com is an independent research site founded by Shubham Chaudhary. PositionalCalls.com is not a SEBI-registered research analyst or investment adviser. Investments in securities markets are subject to market risks. Read all related documents carefully before investing. Returns are never guaranteed. This page is educational and publishes no subscribe, avoid, buy, sell, rating or target calls. Sources: news, brokerage and tracker pages as named; no company filing or report PDF opened; no view on whether any figure will repeat or suits any person.

Shubham Chaudhary is the founder of PositionalCalls, an independent Indian stock market research website. He writes company fundamentals, quarterly results analysis, IPO analysis and sector research for NSE and BSE listed companies, with a focus on banking stocks, insurance and long-term value investing. Every article is built from primary sources such as RBI, SEBI, NSE and BSE filings and company annual reports, and states its risks plainly in simple language for retail investors.
Coverage areas Our research standards- Numbers checked against NSE, BSE and SEBI filings
- Risks and limits stated in every article
- No paid promotions or broker tie-ups
- Articles updated when new filings arrive