
Earnings · Hindustan Unilever
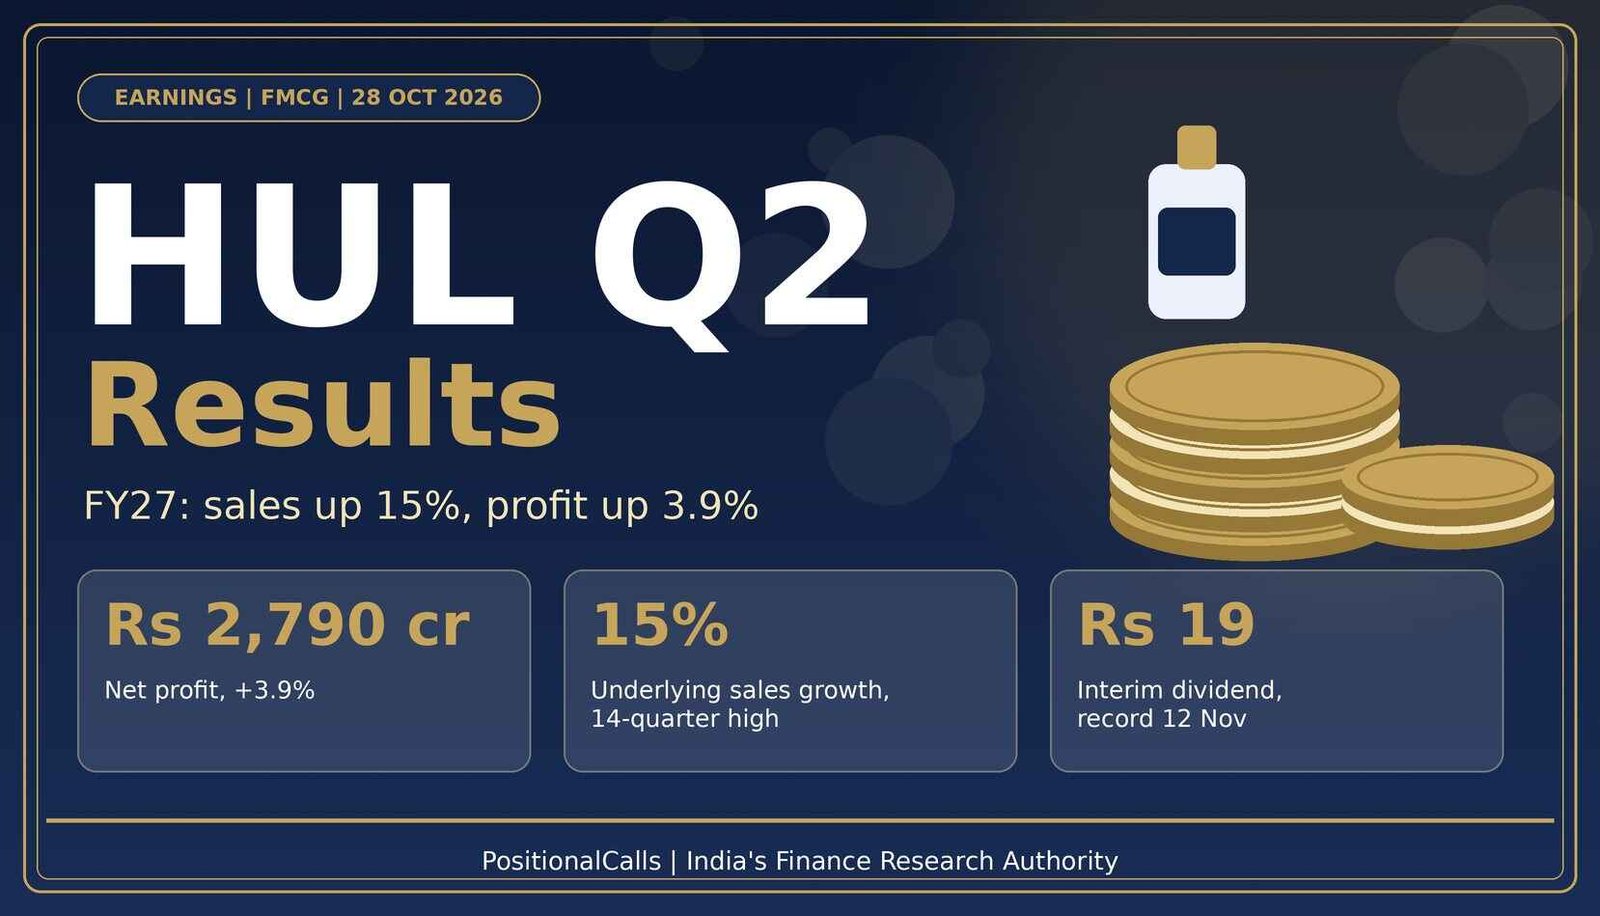
In the HUL Q2 results, sales grew at the fastest pace in 14 quarters, but margins and a one-off in the base held profit growth to 3.9%. Here is what the numbers mean and when the Rs 19 dividend is paid.
Quick answer
HUL Q2 results: Hindustan Unilever reported Rs 2,790 crore consolidated net profit (+3.9%) for the September 2026 quarter on 15% underlying sales growth, its best in 14 quarters, with EBITDA margin at 22.6%. The board declared a Rs 19 interim dividend, record date Thursday, 12 November 2026, payment Wednesday, 25 November 2026.
Latest update (Wednesday, 4 November 2026, 4:30 PM IST): HUL reported on Wednesday, 28 October 2026. The record date for the Rs 19 dividend is Thursday, 12 November 2026 and payment is on Wednesday, 25 November 2026. A confirmed closing price after the results and the Q3 FY27 results date were not found as of the time above.
Key takeaways
- Profit: Rs 2,790 crore, up 3.9% (about 9.5% before exceptional items).
- Sales: underlying sales growth 15%, highest in 14 quarters; volume growth 7%.
- Margin: EBITDA margin 22.6%, down about 140 bps, inside the 22-24% guide.
- Segments: Home Care +21.4% and Beauty and Wellbeing +16.1% led growth.
- Dividend: Rs 19, record date 12 November 2026, payment 25 November 2026.
- Watch: pages showing 7 and 20 November are last year’s dates.
In plain words: underlying sales growth is the growth in sales after removing the effect of acquisitions, demergers and currency, so it shows how the business itself is growing. EBITDA is operating profit before interest, tax, depreciation and amortisation. A basis point (bps) is one hundredth of a percentage point.
Data note: as of Wednesday, 4 November 2026, 4:30 PM IST. Figures come from news reports of HUL’s results and a brokerage note, not from the filing itself. The year-ago base was restated. Reported net profit growth and profit before exceptional items are different measures. Share prices are from 28 October 2026.
HUL Q2 results FY27: what are the key numbers?
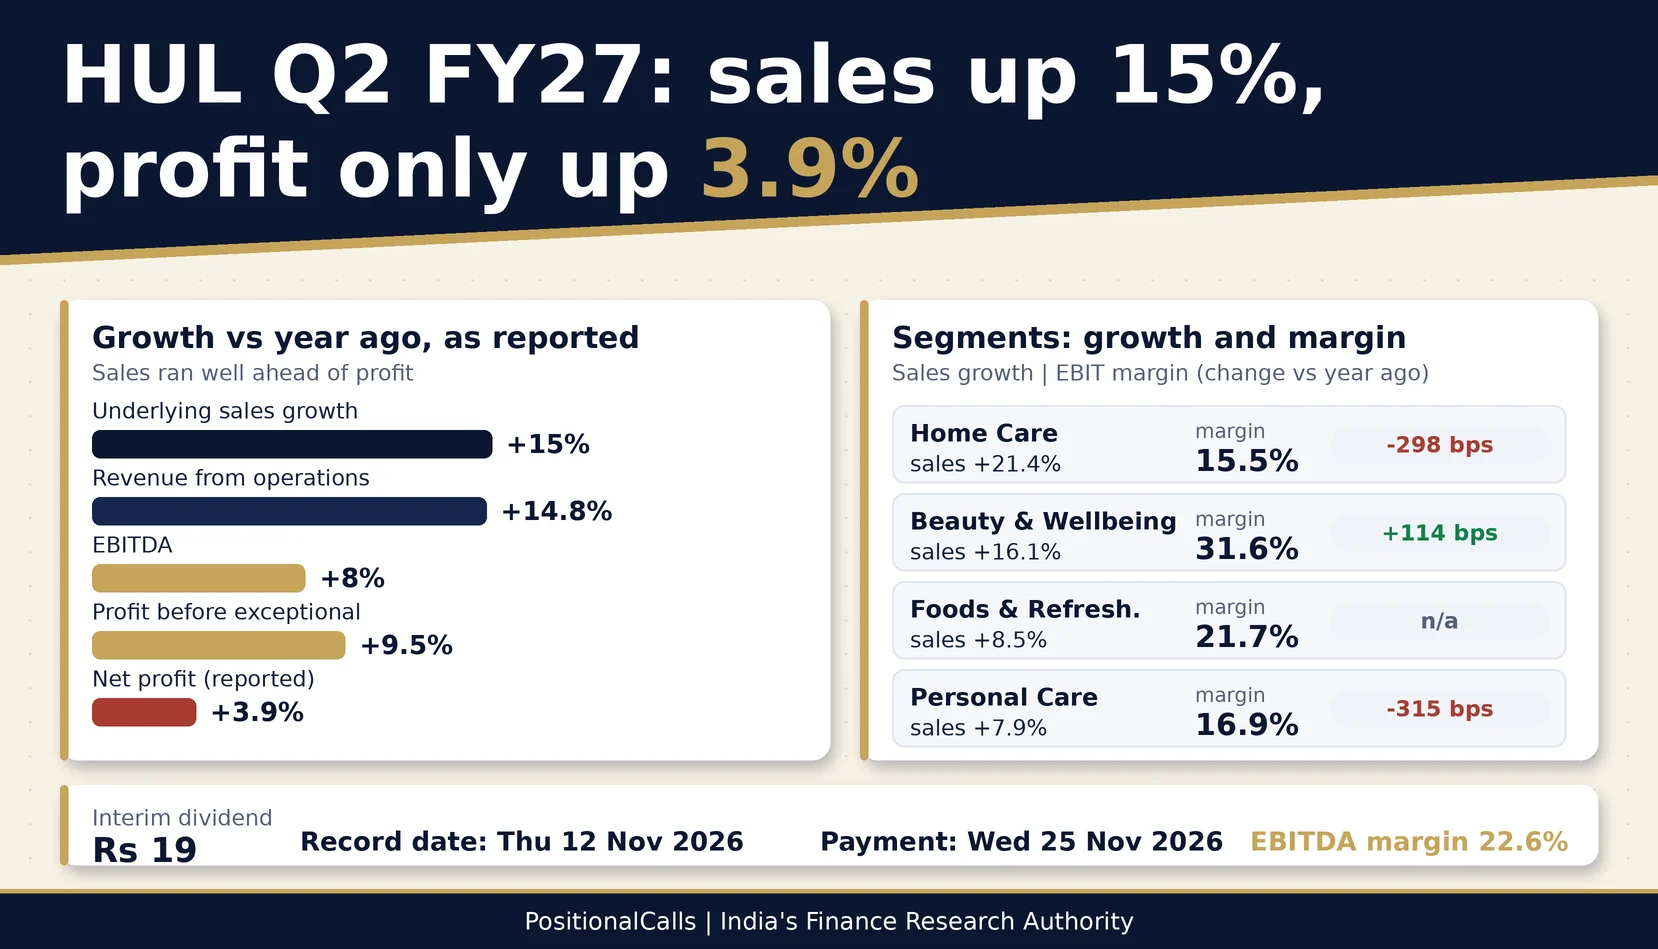
Hindustan Unilever reported a consolidated net profit of Rs 2,790 crore for the quarter ended 30 September 2026, up 3.9% from Rs 2,685 crore. Sales were the real story: underlying sales growth of 15% was the highest in 14 quarters, and underlying volume growth was 7%. The HUL Q2 results also carried an interim dividend of Rs 19 per share with a record date of Thursday, 12 November 2026.
| Metric (consolidated) | Q2 FY27 | Q2 FY26 | Change | Why it matters |
|---|---|---|---|---|
| Net profit attributable to shareholders | Rs 2,790 cr | Rs 2,685 cr | +3.9% | The headline figure; the base quarter had a one-off gain |
| Revenue from operations | Rs 18,037 cr | Rs 15,734.74 cr (restated) | +14.78% | Sales growth far ahead of profit growth |
| Turnover (company measure) | Rs 18,071 cr | not found | USG 15% | The number management quotes for underlying growth |
| EBITDA | Rs 4,089 cr | not shown | +8% | Grew slower than sales, so margin shrank |
| EBITDA margin | 22.6% | 24.0% | -140 bps | Inside the 22-24% guided band |
| Interim dividend per share | Rs 19 | Rs 19 | flat | Record date Thursday, 12 November 2026 |
Cite this table: PositionalCalls, “HUL Q2 FY27 key numbers, as of 4 November 2026”.
Data note: figures are as reported by Business Today and Business Standard on Wednesday, 28 October 2026. I have not opened the exchange filing, so exact line items can differ by small amounts. Where reports disagree I say so below.
What was HUL’s profit in Q2 FY27, and which profit line should you use?
Use Rs 2,790 crore (+3.9%) as the reported figure and read the 9.5% growth in profit before exceptional items as the cleaner trend. HUL’s base quarter in FY26 included a one-off tax-related gain, so the reported growth looks weaker than the underlying growth.
This matters because a search for HUL Q2 results returns several different profit numbers. Some pages show Rs 2,790 crore, one shows Rs 2,796 crore described as flat, and a brokerage shows an adjusted profit of Rs 2,823 crore. They are not the same measure. The table below separates them.
| Profit line | Q2 FY27 | Q2 FY26 | Growth | Status |
|---|---|---|---|---|
| Net profit attributable to shareholders | Rs 2,790 cr | Rs 2,685 cr | +3.9% | Reported; cross-checked across two outlets |
| Profit before exceptional items | not found in rupees | not found | +9.5% | Single-source growth figure from one platform |
| Adjusted PAT (PL Research basis) | Rs 2,823 cr | Rs 2,551 cr | +10.7% | Brokerage definition, differs from the company figure |
| Net profit reported by one outlet | Rs 2,796 cr | not shown | described as flat | Conflicted; not used |
| Q1 FY27 net profit (previous quarter) | Rs 2,680 cr | Rs 2,685 cr (Q2 FY26) | -2% in Q1 | Q1 also had a one-off tax credit in its base |
Cite this table: PositionalCalls, “HUL Q2 FY27 three profit lines, as of 4 November 2026”.
The size of the one-off in the base quarter is itself disputed. Business Standard refers to a one-off tax-related gain of Rs 273 crore in exceptional items. PL Research shows an extraordinary item of Rs 143 crore in Q2 FY26. If profit before exceptional items grew 9.5% and reported profit grew 3.9%, the arithmetic points to a base-quarter exceptional gain closer to Rs 137 crore than Rs 273 crore. I could not settle this without the filing, so it is listed in the data note and in my notes for you to confirm.
In plain words: reported profit rose 3.9%, but profit excluding the one-off in the year-ago quarter rose about 9.5%. Both are true; they answer different questions.
Why did HUL profit grow only 3.9% when sales grew 15%?
Because gross margin fell sharply as input costs rose, and the year-ago profit was flattered by a one-off gain. Sales growth of about 15% turned into EBITDA growth of 8% and reported profit growth of 3.9%.
PL Research puts HUL’s gross margin at 46.4% in Q2 FY27 against 50.5% a year earlier, a fall of roughly 415 basis points. A basis point is one hundredth of a percentage point, so 415 bps is 4.15 percentage points. The same report shows tea prices up 8.6% and palm-derived PFAD up 21.9% on a year-on-year basis, which are two of HUL’s important inputs.
Management said it had fully passed on the cost inflation through price increases taken during the quarter, but also said this does not mean margins in percentage terms return to earlier levels straight away. That is an important sentence for any reader of the HUL Q2 results: price hikes recover rupee costs, not percentage margin.
Here is a simple own calculation. Had HUL held last year’s 24.0% EBITDA margin on this quarter’s Rs 18,037 crore of revenue, EBITDA would have been about Rs 4,329 crore. The reported figure is Rs 4,089 crore, so the margin squeeze cost roughly Rs 240 crore in the quarter. This is an illustration only, because the two margin bases differ slightly, as explained in the next section.
Why do HUL Q2 results show different revenue and EBITDA figures?
Because outlets use different bases: turnover, revenue from operations and segment net sales are three different numbers, and last year’s base was restated. Treat any page that mixes them as unreliable.
| Measure | Value | Who reports it | Comment |
|---|---|---|---|
| Turnover | Rs 18,071 cr | CEO statement, as reported | Company’s own lead measure |
| Revenue from operations | Rs 18,037 cr (+14.78%) | Business Today | Growth is on a restated base of Rs 15,734.74 cr |
| Revenue from operations | Rs 18,226 cr (+14.5%) | One aggregator | Does not match any other source; not used |
| Net sales (segment basis) | Rs 17,543 cr (+14.9%) | PL Research | Compared with a restated Rs 15,263 cr |
| EBITDA | Rs 4,089 cr (+8%) | Business Standard, Business Today | Company-style measure |
| EBITDA | Rs 3,939 cr (+8.8%) | PL Research | Brokerage basis on net sales |
Cite this table: PositionalCalls, “HUL Q2 FY27 definition trap, as of 4 November 2026”.
Correction note: one trade report puts advertising and promotion at Rs 3,138 crore, while PL Research shows Rs 1,311 crore, or 7.5% of net sales. I have not used either figure because they cannot both be right on the same basis. Another page shows an EBITDA margin of 21.62% against 27.78%, which matches no other report and is also excluded.
The base is restated too. Q2 FY26 was first reported with revenue of about Rs 16,241 crore, and the comparison used now is about Rs 15,735 crore. PL Research shows Q2 FY26 net sales of Rs 15,585 crore as first reported and Rs 15,263 crore in the restated comparison. The documents I opened do not say why. A demerger of the ice-cream business is the likely reason, but I have not confirmed that, so treat it as a lead, not a fact.
Margin bases differ in the same way. Business Standard gives 22.6% against 24.0%, a fall of 140 bps. PL Research gives 22.5% against 23.7%, a fall of about 126 bps. Both are inside the 22-24% guided range, and neither is wrong; they use different EBITDA and sales definitions.
Which segments drove the HUL Q2 results?
Home Care and Beauty and Wellbeing drove the growth; Home Care and Personal Care took the margin hit. Beauty and Wellbeing was the only major segment where margin improved.
| Segment | Sales (Rs cr) | Reported sales growth | Underlying growth (company) | EBIT margin (PL Research) |
|---|---|---|---|---|
| Home Care | 6,882 | +21.4% | double-digit, volume-led | 15.5% (-298 bps) |
| Beauty and Wellbeing | 3,935 | +16.1% | 16% | 31.6% (+114 bps) |
| Foods and Refreshment | 3,849 | +8.5% | 9% | 21.7% |
| Personal Care | 2,618 | +7.9% | 9% | 16.9% (-315 bps) |
| Others | 259 | not shown | not shown | 17.8% |
Cite this table: PositionalCalls, “HUL Q2 FY27 segment table, as of 4 November 2026”.
Home Care sales grew 21.4%, but segment EBIT grew only 1.9%, which is why its margin fell to 15.5%. Fabric wash and household care grew in double digits, helped by a Rs 99 Surf Excel Easy Wash pack and liquids. Personal Care EBIT fell 9% even as skin cleansing, led by Pears and Dove bars, grew in double digits.
Beauty and Wellbeing grew 16.1% with EBIT up 20.5%. Premium hair care and skin care led, while Oziva had another soft quarter. By my calculation, segment EBIT in Beauty and Wellbeing is about Rs 1,243 crore (Rs 3,935 crore multiplied by 31.6%), which makes it the most profitable segment even though Home Care has the largest sales.
Foods and Refreshment grew with coffee and premium tea doing well and mass tea subdued. One brokerage table shows a different Foods EBIT growth figure from its own text, so I have shown only the margin and left out the EBIT change.
PositionalCalls WhatsApp channel
Get HUL dividend and results alerts first
- Record date and payment reminders for HUL’s Rs 19 dividend
- Fast updates when the exchange filing or ex-date circular lands
- Plain-language notes on every FMCG Q2 result
How much of the growth was volume and how much was price?
In the HUL Q2 results, volume contributed 7 percentage points of the 15% underlying sales growth, so roughly half came from selling more and half from price and mix. That is a healthier split than a quarter driven only by price increases.
In the first half of FY27, HUL reported turnover of Rs 35,255 crore with underlying sales growth of 12% and underlying volume growth of 6%. Q1 FY27 had underlying sales growth of 10%, which means Q2 accelerated by five points. The CEO said the economy remains resilient, and management described a sequential improvement in both rural and urban demand.
The test for the next quarter is whether volume stays near 7% once the price increases lap the base.
What is HUL’s EBITDA margin guidance, and what is 100 bps worth?
With the HUL Q2 results, HUL kept its EBITDA margin guidance at 22-24% and reported 22.6%, in the lower half of that range. Management also said it expects to spend about 10% of sales on advertising and promotion over the medium to long term.
| Margin change | Quarterly EBITDA effect on Rs 18,037 cr revenue | Annualised (own illustration) |
|---|---|---|
| 100 bps (1 percentage point) | about Rs 180 cr | about Rs 720 cr |
| 140 bps (the reported fall, Business Standard basis) | about Rs 253 cr | about Rs 1,010 cr |
| 200 bps (a move from 22.6% to 24.6%, outside the band) | about Rs 361 cr | about Rs 1,443 cr |
Cite this table: PositionalCalls, “HUL margin sensitivity table, as of 4 November 2026”.
In plain words: every one percentage point of EBITDA margin is worth about Rs 180 crore a quarter at the current sales level. That is why a small margin move matters more than a small sales move.
The table holds sales fixed and moves only margin. It is an own calculation to show scale, not a forecast. Annualising a single quarter is a simplification and is labelled as such.
HUL dividend record date 2026: when to buy and when it is paid
Alongside the HUL Q2 results, the HUL interim dividend of Rs 19 per share (face value Re 1) was declared for FY 2026-27, with a record date of Thursday, 12 November 2026 and payment on Wednesday, 25 November 2026. Under T+1 settlement, the ex-dividend date is expected to be the same day as the record date, so the last day to buy and still be eligible should be Wednesday, 11 November 2026.
Tuesday, 10 November 2026 is a market holiday and Sunday, 8 November has the Muhurat session, as set out in our Muhurat trading 2026 guide. That leaves Monday, 9 November and Wednesday, 11 November as the regular trading days before the record date. Check the exchange holiday list before you plan a purchase.
| Dividend | Amount | Record or ex-date | Payment date |
|---|---|---|---|
| FY 2026-27 interim | Rs 19 | Thu, 12 Nov 2026 (record date) | Wed, 25 Nov 2026 |
| FY 2025-26 final | Rs 22 | Ex-date 23 Jun 2026, as reported by India TV | not found |
| FY 2025-26 interim | Rs 19 | Fri, 7 Nov 2025 (record date) | Thu, 20 Nov 2025 |
Cite this table: PositionalCalls, “HUL dividend history, as of 4 November 2026”.
Correction note: several pages still show 7 November as the record date and 20 November as the payment date. Those are the 2025 dates for last year’s Rs 19 dividend. The 2026 dates are 12 November and 25 November.
With 234.96 crore shares outstanding, my calculation puts the total interim payout at about Rs 4,464 crore (234.96 crore shares multiplied by Rs 19). Against first-half profit of about Rs 5,470 crore (Rs 2,680 crore in Q1 plus Rs 2,790 crore in Q2), that is roughly 82%, which shows how much of its profit HUL returns to shareholders.
How much dividend will you get, and does TDS apply?
You receive Rs 19 for every share you hold on the record date, before any tax deducted at source. The table also adds the Rs 22 final dividend with an ex-date of 23 June 2026, because both fall in FY 2026-27 for TDS counting.
| Shares held | Rs 19 interim dividend | With Rs 22 final in FY27 (Rs 41) | Above Rs 10,000 in the year? |
|---|---|---|---|
| 10 | Rs 190 | Rs 410 | No |
| 100 | Rs 1,900 | Rs 4,100 | No |
| 244 | Rs 4,636 | Rs 10,004 | Just above |
| 500 | Rs 9,500 | Rs 20,500 | Yes |
| 1,000 | Rs 19,000 | Rs 41,000 | Yes |
Cite this table: PositionalCalls, “HUL dividend worked examples, as of 4 November 2026”.
Under the rule as I understand it, a company deducts TDS at 10% from a resident individual’s dividend once dividends from that company exceed Rs 10,000 in a financial year. Please confirm the current threshold and rate on the Income Tax Department website or with a tax adviser. Dividend income is taxed at your slab rate whether or not TDS applies. Our guide to the capital gains tax on shares covers dividend TDS in more detail.
NRI investors face a different TDS treatment and may be able to claim treaty relief. See our NRI investment in the Indian stock market guide and confirm the rate with your adviser, because I have not verified the current non-resident rate for this post.
An illustration of yield: at a share price of Rs 1,772.50 (the Business Today quote shown on 28 October, so not a current price), Rs 19 is a yield of about 1.07%, and Rs 41 across the year is about 2.31%. Both are my calculations on a stale price. Check the live price before using them.
After the HUL Q2 results, the stock fell as much as 2.97% to Rs 1,766 on Wednesday, 28 October 2026, close to the 52-week low of Rs 1,758.60 set on 27 October. I could not find a confirmed closing price for 28 October or later prices as of Wednesday, 4 November 2026, 4:30 PM IST.
The fall implies a previous close of about Rs 1,820 (my calculation from the reported percentage). PL Research data shows the stock down 26.1% over twelve months and 4.2% over one month as of the results date. The same report notes HUL’s forward valuation multiple near a ten-year low and raised its FY27 to FY29 EPS estimates by 3.1%, 3.1% and 4.4%.
Before the results, PL Research had estimated net sales of Rs 16,910 crore, EBITDA of Rs 3,839 crore and adjusted profit of Rs 2,696 crore. The reported figures on its basis were Rs 17,543 crore, Rs 3,939 crore and Rs 2,823 crore, ahead by 3.7%, 2.6% and 4.7%. That is one reported estimate, not a consensus. The market still sold the stock, which shows that investors focused on margin and gross-margin pressure more than on the sales beat.
This page does not give a view on whether the shares are cheap or expensive. We are not SEBI-registered and share only research and education.
How to read the HUL Q2 results: a decoder table
Check five numbers: underlying volume growth, gross margin, EBITDA margin, segment margins and the dividend. The table gives the mark to compare each against and the question to ask.
| What to read | Mark to compare | Q2 FY27 | Question to ask |
|---|---|---|---|
| Underlying volume growth | 6% in H1 FY27 | 7% | Can volume hold without new price rises? |
| Gross margin (PL Research) | 50.5% a year ago | 46.4% | How much of the cost rise is passed on by December? |
| EBITDA margin | Guided 22-24% | 22.6% | Is it moving to the middle of the band? |
| Home Care margin (PL Research) | 18.5% a year ago | 15.5% | Does pricing restore margin in Home Care? |
| Beauty and Wellbeing margin | 30.4% a year ago | 31.6% | Can premiumisation keep lifting margin? |
| Dividend | Rs 19 a year ago | Rs 19 | Is the payout steady while profit grows slowly? |
Cite this table: PositionalCalls, “HUL results-day decoder, as of 4 November 2026”.
| Metric | Q2 FY27 | Q1 FY27 | Q2 FY26 |
|---|---|---|---|
| Net profit | Rs 2,790 cr | Rs 2,680 cr | Rs 2,685 cr |
| Underlying sales growth | 15% | 10% | not found |
| EBITDA margin (PL Research basis) | 22.5% | 22.6% | 23.7% restated |
| Home Care EBIT margin | 15.5% | 16.6% | 18.5% |
| Beauty and Wellbeing EBIT margin | 31.6% | 30.0% | 30.4% |
Cite this table: PositionalCalls, “HUL quarter comparison, as of 4 November 2026”.
Peers report on their own dates. For the FMCG cluster see our ITC Q2 results, Marico Q2 results, Dabur Q2 results and Britannia Q2 results preview pages, and our Q2 results calendar for every date.
What most people miss in the HUL Q2 results
What to watch next, and a checklist
After the HUL Q2 results, the next hard dates are the record date on 12 November 2026 and the payment on 25 November 2026. HUL’s Q3 FY27 results date has not been confirmed as of Wednesday, 4 November 2026, 4:30 PM IST, and I will update this page when the board meeting date is announced.
- Whether price increases in Home Care and Personal Care restore margin by the December quarter.
- Tea, palm-derived PFAD and crude-linked costs, which drive gross margin.
- Underlying volume growth: does it stay near 7%?
- Beauty and Wellbeing: can premium skin and hair care keep growing at 16%?
- The A&P ratio against management’s medium-term guide of about 10% of sales.
- The exchange circular confirming the ex-dividend date.
Your own checklist before acting on any of this:
- I have checked the live share price, not the results-day price.
- I know whether my purchase settles before the record date.
- I have read the company’s exchange filing and press release myself.
- I have looked at how the dividend is taxed for me.
- I am not relying on a single outlet’s profit or EBITDA number.
Analyst’s note
The points below are my reasoning from the reported numbers. They are not a recommendation.
- What stands out: a 15% sales jump with only 8% EBITDA growth is a margin story, not a demand story.
- Easy to miss: the profit growth figure depends on which base you use, so quote the line you mean.
- What would change the view: a gross margin recovery towards 48-50% would show that price increases are sticking.
- Caution: a dividend that stays at Rs 19 while profit grows 4% is steady, not a signal of future price moves.
- Reader action: open the filing, note the three profit lines and compare them with the table above.
Bottom line
Bottom line
The HUL Q2 results show strong volume-led sales growth, squeezed margins and a steady Rs 19 interim dividend with a record date of Thursday, 12 November 2026. Reported profit grew 3.9%, and underlying profit about 9.5%.
Next read: ITC Q2 results for the other large FMCG name, or the Q2 results calendar.
Part of the Earnings coverage series. HUL is also covered in our HUL Q3 results FY26 analysis, and the sector view sits under consumption.
PositionalCalls WhatsApp channel
Follow the rest of the Q2 results season
- Daily results calendar with confirmed and tentative dates
- Margin, volume and dividend numbers for each company
- New explainers on tax and dividends as they publish
HUL Q2 results FAQs
What was HUL’s net profit in the HUL Q2 results for FY27?
HUL reported a consolidated net profit of Rs 2,790 crore for the quarter ended 30 September 2026, up 3.9% from Rs 2,685 crore a year earlier. Profit before exceptional items grew about 9.5% on one platform’s figure.
When were the HUL Q2 results announced?
HUL reported its Q2 FY27 results on Wednesday, 28 October 2026. The numbers are for the quarter ended 30 September 2026, and the board also declared an interim dividend.
What is the HUL dividend amount and record date for 2026?
HUL declared an interim dividend of Rs 19 per share with a record date of Thursday, 12 November 2026. The face value is Re 1 and the dividend is for FY 2026-27.
When will HUL pay the Rs 19 dividend?
HUL said the dividend will be paid on Wednesday, 25 November 2026 to eligible shareholders, credited to the bank account linked to the demat account.
Under T+1 settlement the ex-date is expected to match the record date, so the last day to buy is expected to be Wednesday, 11 November 2026. Confirm the ex-date on the NSE circular.
Why did HUL profit grow slower than sales in the HUL Q2 results?
Sales grew about 15% but gross margin fell about 415 bps on higher input costs and the base quarter had a one-off gain, so reported profit grew only 3.9%.
What is HUL’s EBITDA margin guidance?
Management retained a guided EBITDA margin range of 22-24%. The reported Q2 FY27 margin was 22.6% on Business Standard’s basis, down from 24.0% a year earlier.
How much will HUL pay out in total for the Rs 19 dividend?
With about 234.96 crore shares, the interim dividend comes to roughly Rs 4,464 crore. This is my calculation from the share count and the Rs 19 amount.
Is the HUL dividend taxable?
Yes. Dividend income is taxed at your slab rate, and TDS may apply once dividends from the company exceed the threshold in force. Confirm the current rate and threshold with the Income Tax Department or an adviser.
What was HUL’s dividend a year ago?
HUL paid an interim dividend of Rs 19 with a record date of Friday, 7 November 2025 and payment on Thursday, 20 November 2025. This year’s dividend is also Rs 19.
Sources
- Hindustan Unilever Q2 FY27 results and press release on the NSE and BSE announcement pages (primary; to be checked by the reader).
- Business Today, “HUL shares slip 3% to hover near 52-week low after Q2 results”, 28 October 2026.
- Business Standard, “HUL Q2 results: Net profit rises 4% to Rs 2,790 crore, volume growth at 7%”, 28 October 2026.
- PL Research, Hindustan Unilever Q2 FY27 result update, 28 October 2026.
- India TV, HUL dividend 2026 record date report, 28 October 2026.
- Kotak Neo and Goodreturns results reports, 28 October 2026, for the dividend dates.
- Business Today and Upstox, HUL Q2 FY26 results reports, October 2025, for the year-ago base.
Editorial disclosure: PositionalCalls.com is an independent research and education site founded by Shubham Chaudhary. PositionalCalls.com is not a SEBI-registered research analyst or investment adviser. Investments in securities markets are subject to market risks. Read all related documents carefully before investing. Returns are never guaranteed. How I researched this: I read the company results as reported by Business Today and Business Standard and a PL Research results note, compared figures across sources, recalculated every derived number shown as my calculation, and listed disagreements instead of choosing the more exciting number.

Shubham Chaudhary is the founder of PositionalCalls, an independent Indian stock market research website. He writes company fundamentals, quarterly results analysis, IPO analysis and sector research for NSE and BSE listed companies, with a focus on banking stocks, insurance and long-term value investing. Every article is built from primary sources such as RBI, SEBI, NSE and BSE filings and company annual reports, and states its risks plainly in simple language for retail investors.
Coverage areas Our research standards- Numbers checked against NSE, BSE and SEBI filings
- Risks and limits stated in every article
- No paid promotions or broker tie-ups
- Articles updated when new filings arrive