
Earnings · Auto · Mahindra & Mahindra
Mahindra & Mahindra reported a 25% rise in September-quarter profit on 5 November 2026; these Mahindra Q2 FY27 results include the M&M Q2 results date, profit, margins and price. This page shows what grew, what the Rs 641 crore Q1 gain did to the comparison, why margins fell and what the shares did.
Quick answer
M&M Q2 results FY27 were reported on Thursday, 5 November 2026: profit to owners was Rs 4,588 crore, up 25%, on revenue of Rs 57,553 crore (+25%). Automotive profit rose 55% while farm fell 9%. Shares traded up about 6% on 5 November, per reports.
Latest update (Thursday, 5 November 2026, 9:45 PM IST): M&M reported Q2 FY27 on Thursday, 5 November 2026: profit to owners Rs 4,588 crore (+25%) on revenue of Rs 57,553 crore (+25%). Reports of the results were published from about 1:47 PM IST, and the stock traded up about 5.6% to 6.5% in the afternoon; I could not find the official close or any dividend notice. I will add the close, the dividend position and the filing’s notes on Friday, 6 November.
Key takeaways
- Headline: Consolidated profit to owners was Rs 4,588 crore against Rs 3,673 crore, up 25%, on revenue of Rs 57,553 crore against Rs 46,106 crore (+24.8%).
- Half-year: H1 FY27 profit was Rs 10,042 crore and revenue Rs 1,15,741 crore; both tie to Q1 plus Q2 (my calculation).
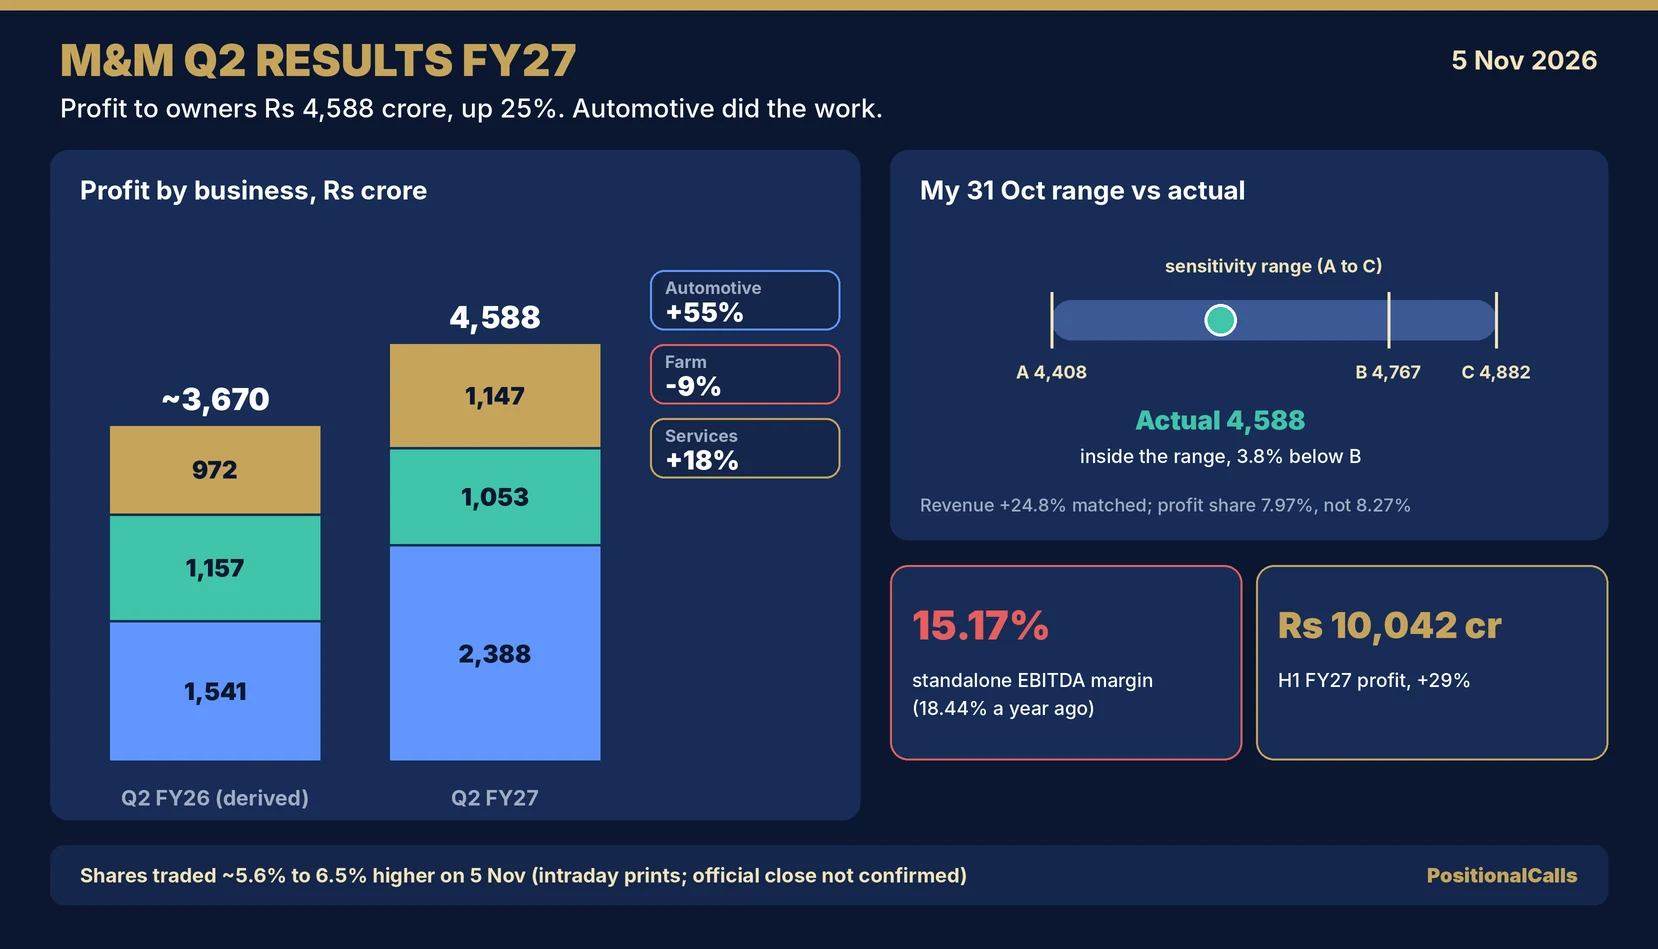
- Who drove it: Automotive profit was Rs 2,388 crore (+55%), farm Rs 1,053 crore (-9%) and services Rs 1,147 crore (+18%); automotive supplied roughly nine-tenths of the rise (my calculation).
- Margins: Standalone EBITDA margin was 15.17% against 18.44%, as standalone EBITDA grew 4% on revenue up 26%.
- Versus Q1: Profit fell about 15.9% from Q1’s Rs 5,455 crore, which carried a Rs 641 crore associate gain; against Q1 without that gain it fell about 4.7% before tax effects (my calculation).
- Share price: Pages show about Rs 3,128 to Rs 3,144 on 5 November, up 5.6% to 6.5% on a previous close of about Rs 2,952 to Rs 2,968; I could not find the official close.
In plain words: M&M sells SUVs, tractors and commercial vehicles, and also owns stakes in a finance company, an IT company and other businesses. “Profit to owners” is group profit after the share that belongs to minority investors. “Standalone” means the parent company alone. PBIT is profit before interest and tax, and a margin is that profit as a share of sales.
Data note: as of Thursday, 5 November 2026, 9:45 PM IST. Q2 FY27 figures come from press reports of the results (Business Today, APAC News Network, Lapaas Voice, NewsBytes and Whalesbook); I did not open the exchange filing or the company press release, so line items such as consolidated EBITDA, profit before tax and exceptional items are not shown. Q1 FY27 figures come from M&M’s filing of 30 July 2026, which I opened. Q2 FY26 figures come from the company press release. Where reports differ, both figures are shown. Derived numbers are marked “my calculation”.
M&M Q2 results FY27: key numbers at a glance
M&M Q2 results FY27 show consolidated profit to owners of Rs 4,588 crore, up 25% on Rs 3,673 crore, and revenue of Rs 57,553 crore, up 24.8%, as reported on 5 November 2026.
| Consolidated, Rs crore | Q2 FY27 | Q2 FY26 (base) | Change YoY | Q1 FY27 | Change QoQ (my calculation) |
|---|---|---|---|---|---|
| Revenue | 57,553 | 46,106 | +24.8% | 58,187.57 | -1.1% |
| Profit to owners | 4,588 | 3,673.32 | +24.9% | 5,454.54 | -15.9% |
| Q1 profit without the Rs 641.33 cr gain (pre-tax basis) | 4,588 | 3,673.32 | +24.9% | 4,813.21 | -4.7% |
| Total expenses (single source) | 51,845.48 | 41,192.50 | +25.9% | – | – |
| Standalone revenue | 44,282 | about 35,080 | +26% | – | – |
| Standalone profit after tax | 5,102 | 4,520.52 | +12.9% | 3,684.97 | +38.5% |
Cite this table: PositionalCalls, “M&M Q2 FY27 Results Table, as of 5 November 2026”.
Profit to owners is the right comparison for per-share work: the year-ago Rs 3,673 crore is also owners’ profit, and Q1 plus Q2 owners’ profit (5,454.54 + 4,588) is Rs 10,042.54 crore, which matches the reported H1 figure of Rs 10,042 crore. Q1 plus Q2 revenue (58,187.57 + 57,553) is Rs 1,15,740.57 crore against the reported Rs 1,15,741 crore, so the figures hang together (my calculation). Expenses grew 25.9%, slightly faster than revenue, which is consistent with the margin pressure described below. Profit was 7.97% of revenue, the same share as a year ago (3,673.32 over 46,106).
When did M&M announce Q2 results FY27?
The M&M Q2 results date was Thursday, 5 November 2026, for the quarter ended 30 September 2026, with an analyst meet from 4:00 PM to 5:30 PM in Mumbai.
My 31 October preview carried the 5 November board date from a trade report; the results reports published from about 1:47 PM IST on that date confirm it. I have not opened the board notice or filing, so check the time stamp on the BSE or NSE page. The legal deadline was 14 November 2026. Other large companies reporting the same day included Titan, Airtel and LIC; track every date on the Q2 results calendar.
| Event | Date | Weekday | Status |
|---|---|---|---|
| Q2 FY26 results | 4 November 2025 | Tuesday | Filed; the year-ago base |
| Q4 FY26 results | 5 May 2026 | Tuesday | Filed |
| Q1 FY27 results | 30 July 2026 | Thursday | Filed; gain of Rs 641 crore inside |
| Q2 FY27 analyst meet | 5 November 2026 | Thursday | 4:00 PM to 5:30 PM, Mumbai |
| Q2 FY27 results | 5 November 2026 | Thursday | Reported; confirm in the filing |
Which profit number in the M&M Q2 results FY27 is the right one, and did the Q1 gain repeat?
For the M&M Q2 net profit FY27, use consolidated profit to owners: Rs 4,588 crore against Rs 3,673.32 crore. The Rs 641.33 crore Q1 gain inflated Q1, and none of the reports I read names a comparable gain in Q2.
| Profit definition, Rs crore | Q2 FY27 | Q1 FY27 | Q2 FY26 | Where you see it |
|---|---|---|---|---|
| Profit to owners (consolidated) | 4,588 | 5,454.54 | 3,673.32 | Company headline; news |
| Profit incl. minority interest | Not in reports I read | 5,997.56 | 3,963.75 | Data pages; statement |
| Standalone profit after tax | 5,102 | 3,684.97 | 4,520.52 | Parent-only filing |
Cite this table: PositionalCalls, “M&M Profit Definitions Table, as of 5 November 2026”.
Q1 FY27 note 2 said income from investments included a gain of Rs 641.33 crore on sale of an investment in an associate, which is why Q1 profit to owners of Rs 5,454.54 crore was flattered. The Mahindra profit gain from that associate sale does not recur in Q2: NewsBytes reports investment income down 80%, which it attributes to prior-year monetisation (single source, as reported). That means Q2’s 25% growth is not propped up by a Rs 641 crore item, though I have not seen the filing’s notes to rule out smaller items. Against Q1 profit without the gain (Rs 4,813.21 crore, ignoring tax on the gain), Q2 is about 4.7% lower (my calculation); against reported Q1 it is 15.9% lower.
Standalone profit rebounded sharply from Q1
Standalone profit of Rs 5,102 crore is 38.5% above Q1’s Rs 3,684.97 crore and about 12.9% above the Rs 4,520.52 crore base (my calculation). Reports say +13%; APAC News Network prints +12.15%, which does not match the base. My preview flagged standalone profit as the weak link, being 18.5% below the base in Q1, and this quarter that gap closed.
How did each business do in the M&M Q2 results FY27?
In the M&M Q2 results FY27, automotive profit rose 55% to Rs 2,388 crore and supplied about 93% of the group’s Rs 915 crore rise, while farm profit fell 9% and services rose 18% (my calculation from rounded growth rates).
| Business, consolidated, Rs crore | Revenue | Revenue YoY | Profit (PAT) | Profit YoY | Share of profit | Year-ago profit (derived) | Change (derived) |
|---|---|---|---|---|---|---|---|
| Automotive | 37,756 | +39% | 2,388 | +55% | 52% | about 1,541 | +847 |
| Farm Equipment | 9,572 | -6% | 1,053 | -9% | 23% | about 1,157 | -104 |
| Services | 11,821 | +18% | 1,147 | +18% | 25% | about 972 | +175 |
| Group profit to owners | – | – | 4,588 | +25% | 100% | about 3,670 | +918 |
Cite this table: PositionalCalls, “M&M Business-Wise Profit Table, as of 5 November 2026”.
The three business profits add to Rs 4,588 crore (2,388 + 1,053 + 1,147), which ties to group profit; the segment split is from APAC News Network and the automotive and farm figures match the other reports. Year-ago profits are derived from the reported percentages, so each is approximate and the total differs from Rs 3,673 crore by a few crore. Segment revenues are not added because group revenue after eliminations is Rs 57,553 crore.
Subsidiaries and other businesses, as reported
- Mahindra Finance: assets under management up 15%, gross stage-three ratio 3.42%, profit attributable to M&M up 61%.
- Tech Mahindra: profit attributable to M&M up 33%, EBIT margin 14.8%.
- Mahindra Lifespaces: residential pre-sales about Rs 1,100 crore, up 41%.
- Mahindra Holidays: 5,762 room keys, occupancy 76%, up 220 basis points.
- Mahindra Logistics: revenue Rs 2,095 crore, up 24%, with profit about three times higher (Growth Gems profit roughly threefold per NewsBytes).
Management attributed the result to group resilience: group CEO Anish Shah said the 25% rise “reflects the resilience of our group”, with farm marginally lower on a festive-season shift. Services is the part I could confirm only from one report, so treat its detail as reported, not confirmed.
PositionalCalls WhatsApp channel
Follow M&M and auto results on WhatsApp
- Same-day results notes with the profit definition named
- Dividend and record-date changes checked against filings
- A link when this page is updated with the filing figures
Why did the margin fall in the M&M Q2 results FY27?
Standalone EBITDA grew only 4% to Rs 6,718 crore while standalone revenue rose 26%, so the margin fell to about 15.2% from 18.4%; reports point to commodity costs and farm volume.
| Measure, Rs crore | Q2 FY27 | Q2 FY26 | Change | Note |
|---|---|---|---|---|
| Standalone EBITDA | 6,718 | about 6,460 | +4% | Business Today; one page labels it automotive EBITDA |
| Standalone EBITDA margin | 15.17% | 18.44% | -3.27 pts | My check: 6,718 / 44,282 = 15.17% |
| Standalone automotive PBIT | 2,614 | – | +15% | Margin 7.7% against 9.2% |
| Automotive PBIT margin excl. eSUV CMA | 9.1% | about 10.3% | -120 bps | Up about 80 bps on Q1 |
| Standalone farm PBIT | 1,441 | – | – | Margin 16.8% against 19.7% |
| Consolidated automotive PBIT | 3,319 | 2,538 | +30.8% | Margin 8.8%, presentation basis |
Cite this table: PositionalCalls, “M&M Margin Table, as of 5 November 2026”.
Zeebiz attributes the margin dip mainly to higher commodity costs that higher volumes did not fully offset, and the farm margin fell about 2.9 points (19.7% to 16.8%; reports say 300 basis points) on lower tractor volume. Standalone EBITDA growth of 4% against revenue growth of 26% is the clearest quality signal in the quarter: profit grew faster than operating profit, so I could not tie standalone profit growth to operations from the reports. The 8.8% consolidated automotive margin is on the company-presentation basis; my Q1 filing-basis figure of 7.7% is not comparable, so do not read it as a Q1-to-Q2 change.
What did the M&M Q2 results FY27 show on SUV and tractor volumes?
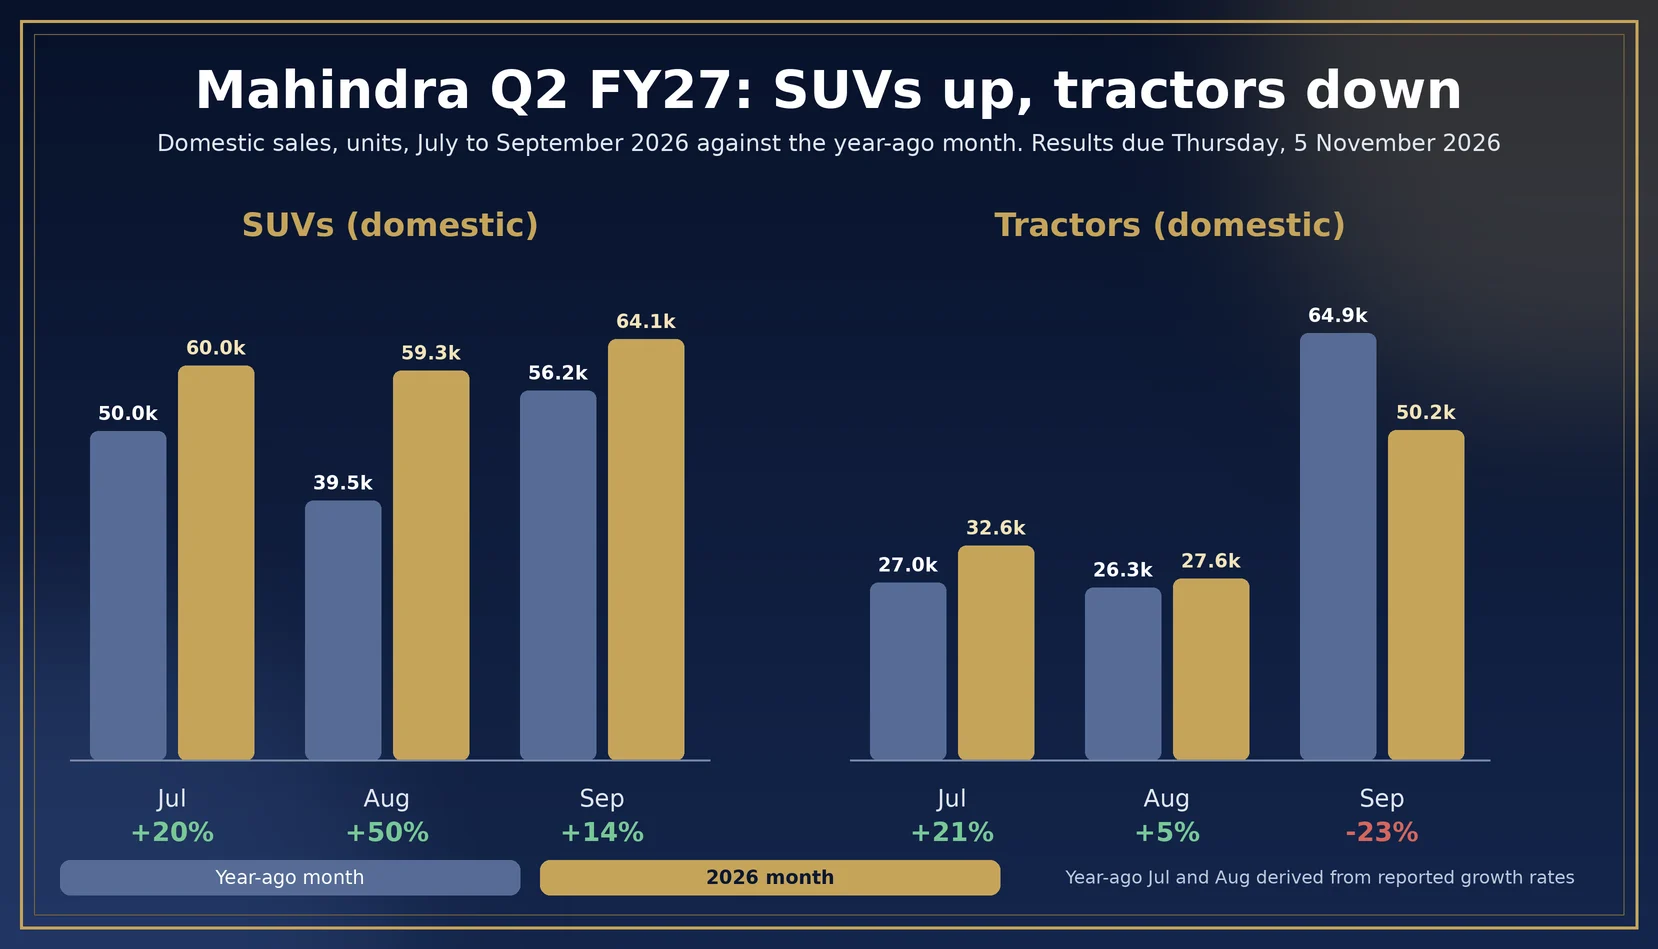
M&M sold 330,896 vehicles in Q2 FY27, up 26%, with about 1.83 lakh SUVs (+26%), while tractor sales were 116,027, down 6% on the festive-timing shift (as reported).
| Q2 FY27 operating data | Figure | Change or comparison | Source |
|---|---|---|---|
| Total vehicle sales (incl. LMM and MEAL) | 330,896 | +26% | Business Today |
| Utility vehicles (SUVs) | about 183,000 | +26% | NewsBytes; my monthly sum was 183,397 |
| Tractors | 116,027 | -6% | Business Today; domestic-only sum 110,446 |
| SUV revenue market share | 24.3% | Autocar Pro reported 25.7% a year ago | Business Today |
| LCV market share | 52.3% | – | Business Today |
| Tractor market share | 41.5% | H1 domestic share 43.4% | Business Today; NewsBytes |
| Electric SUV revenue share | 30.1% | – | Business Today |
| Electric three-wheeler revenue share | 36.2% | – | Business Today |
| Return on equity | 21% | – | Business Today |
Cite this table: PositionalCalls, “M&M Q2 FY27 Volumes and Market Share Table, as of 5 November 2026”.
My 31 October volume sums (183,397 SUVs and 110,446 domestic tractors) are consistent with these results: the company figure of 116,027 tractors includes exports, which explains the gap. Mahindra tractor sales for September 2026 fell 23% to 50,208 units on festival timing, and the quarter ended 6% lower, so the dip I flagged before the results did reach the farm line, where profit fell 9%. The SUV revenue share of 24.3% is below the 25.7% reported a year earlier, so volume growth came while share slipped. Compare how another auto name reports in our Maruti Suzuki Q2 results FY27 and Tata Motors Q2 results FY27 coverage.
M&M share price after Q2 results: how did the stock react?
The M&M share price after Q2 results was about 5.6% to 6.5% higher on 5 November, at roughly Rs 3,128 to Rs 3,144 against a previous close near Rs 2,952, still about 18% below the 52-week high of Rs 3,840; I could not find the official close.
| Price point, 5 November 2026 | Price (Rs) | Move as printed | Source and caveat |
|---|---|---|---|
| Previous close (4 November) | 2,952 | – | Business Today; other pages imply about 2,962 to 2,968 |
| After results, about 1:47 to 2:15 PM | 3,143.95 | +6.5% | Business Today; intraday gain printed as above 6% |
| Page ticker at capture | 3,128.30 | +5.62% | Business Today ticker, time unknown |
| 4:42 PM page | 3,134.40 | +5.61% | NewsBytes; closest to the close I could find |
| 52-week high | 3,840 | – | Gap from 3,134.40 is -18.4% (my calculation) |
Cite this table: PositionalCalls, “M&M Share Price Reaction Table, as of 5 November 2026”.
The printed percentages do not agree with each other: 3,134.40 against a Rs 2,952 close is +6.2% (my calculation), not the 5.61% shown, which implies an earlier close near Rs 2,968. Market capitalisation was reported at about Rs 3.9 lakh crore. Lapaas Voice says the shares rose “nearly 5%” with intraday gains above 6%. I treat all of these as reported intraday prices until I confirm the official close on the exchange. I found no brokerage notes with targets for this result, and I give no view on the stock. If you act on price, read our capital gains tax on shares guide first.
My 31 October sensitivity versus the actual M&M Q2 results FY27
The actual profit of Rs 4,588 crore sits inside my pre-results sensitivity range of Rs 4,408 crore to Rs 4,882 crore, 3.8% below the middle scenario, because the profit share was 7.97% rather than 8.27%.
| Scenario (31 October) | Revenue (Rs crore) | Profit share | Profit to owners (Rs crore) | Actual Rs 4,588 cr vs scenario |
|---|---|---|---|---|
| A: +20% revenue, Q2 FY26 share | 55,327 | 7.97% | 4,408 | +4.1% |
| B: +25% revenue, Q1 ex-gain share | 57,632 | 8.27% | 4,767 | -3.8% |
| C: +28% revenue, Q1 ex-gain share | 59,016 | 8.27% | 4,882 | -6.0% |
| Actual (reported) | 57,553 | 7.97% | 4,588 | – |
Cite this table: PositionalCalls, “M&M Sensitivity Versus Actual Table, as of 5 November 2026”.
This is a check on my own arithmetic, not a forecast and not a comparison with a market consensus, which I did not find. Revenue came in at 24.8% growth, almost exactly scenario B’s 25%. Profit came in below B because the profit share fell back to the year-ago 7.97% from the Q1 ex-gain 8.27%, which fits the margin pressure shown above. The lesson for the next quarter is that Q1’s share was not a safe run-rate even after removing the gain.
What to confirm in the M&M filing next
Open the filing and check six lines the reports do not give: profit before tax, consolidated EBITDA, exceptional or investment gains, minority interest, the dividend and the segment note.
| Line to read | What the reports give | Question to ask |
|---|---|---|
| Profit before tax and tax | Not given | Is the effective tax rate normal? |
| Consolidated EBITDA and margin | Standalone only | Did group margin fall as standalone did? |
| Investment or associate gains | Investment income -80% (one source) | Is there any gain in Q2 at all? |
| Minority interest | Not given | Does Rs 4,588 crore tie to owners’ profit in the statement? |
| Dividend | Not mentioned | Was an interim dividend declared? |
| Segment results | PAT by business only | What are the segment margins on the filing basis? |
Cite this table: PositionalCalls, “M&M Filing Checklist, as of 5 November 2026”.
How to read the M&M result and what to avoid
To read M&M Q2 results FY27, use the exchange filing and the company press release, and ignore any message that offers the result or a stock tip for a fee.
- Open the BSE or NSE announcements page for Mahindra & Mahindra and find the results filing.
- Read the consolidated statement, then the standalone one.
- Check the notes for gains on investments or exceptional items.
- Match the headline profit to owners, group or standalone with the table above.
- Compare segment results with the checklist.
- Note any dividend announcement and its record date.
Reading the result costs nothing. Dealing costs depend on your broker, so check the current charges schedule; tax on dividends and gains follows the current rules in our capital gains tax on shares guide. Fake result alerts, “sure-shot” tips and KYC or OTP links circulate around results. Never share an OTP.
What most people miss
Analyst’s note
- What stands out: a clean 25% rise in group profit with no Rs 641 crore gain this time, led by automotive profit up 55%.
- Easy to miss: standalone EBITDA margin fell 3.27 points to 15.17%, and farm profit fell 9% on festive timing.
- What would change the view: a filing note showing an unflagged gain, a group margin below the year-ago level, or a second weak tractor quarter.
- Caution: the sensitivity check is my own arithmetic, and no price target or buy or sell view is given.
- Reader action: match each headline profit to the definitions above and confirm them in the filing.
Bottom line
M&M Q2 results FY27 show profit to owners of Rs 4,588 crore (+25%) on revenue of Rs 57,553 crore, led by automotive profit up 55%, with farm down 9% and the standalone margin about 3.3 points lower. The Q1 gain did not repeat, so read the underlying lines before the growth rate, and confirm them in the filing.
Next read: see all Q2 result dates on the calendar hub.
Part of the Earnings series.
PositionalCalls WhatsApp channel
Never miss a results-day update
- Base-to-beat tables for big-cap results
- One-offs separated from the underlying number
- Corrections posted openly when a figure changes
FAQs on M&M Q2 results FY27
When did M&M announce Q2 results FY27?
M&M reported its Q2 FY27 results on Thursday, 5 November 2026 for the quarter ended 30 September 2026, with an analyst meet from 4:00 PM to 5:30 PM. I have not opened the board notice, so confirm the time on the exchange page.
What was the M&M Q2 net profit FY27?
Consolidated profit to owners was Rs 4,588 crore, up 25% from Rs 3,673 crore. H1 FY27 profit was Rs 10,042 crore, which matches Q1 (Rs 5,454.54 crore) plus Q2. Confirm in the filing.
What was M&M’s revenue in Q2 FY27 against the base?
Consolidated revenue was Rs 57,553 crore, up 24.8% from Rs 46,106 crore, while H1 revenue was Rs 1,15,741 crore, up 26%. Profit was 7.97% of revenue, the same share as a year ago (my calculation).
Was there a one-off gain in M&M’s Q2 FY27 profit?
None of the reports I read names one. Q1 FY27 carried a Rs 641.33 crore gain on an associate sale, and NewsBytes reports Q2 investment income down 80%. I have not seen the filing’s notes.
Which business drove M&M’s Q2 profit growth?
Automotive, with profit of Rs 2,388 crore, up 55%, on revenue of Rs 37,756 crore (+39%). Farm profit fell 9% to Rs 1,053 crore and services rose 18% to Rs 1,147 crore. Automotive supplied roughly 90% of the rise (my calculation).
Why did M&M’s margin fall in Q2 FY27?
Standalone EBITDA rose 4% to Rs 6,718 crore on revenue up 26%, so the margin fell to 15.17% from 18.44%. Reports cite commodity costs and lower farm volume. Farm PBIT margin was 16.8% against 19.7%.
How did SUV and tractor sales do in the Mahindra Q2 FY27 results?
Total vehicle sales were 330,896 (+26%), with about 1.83 lakh SUVs (+26%) at a 24.3% revenue share. Tractor sales were 116,027, down 6%, at a 41.5% share, after a 23% fall in September on festival timing.
What was the M&M share price after Q2 results?
Pages show about Rs 3,128 to Rs 3,144 on 5 November, up 5.6% to 6.5% on a close near Rs 2,952. Those are intraday prints; I could not find the official close. This is not a price target.
Did M&M declare a dividend with its Q2 FY27 results, and where can I read the filing?
None of the reports I read mentions a dividend; last year’s Q2 had none. Read the filing on the BSE and NSE announcement pages and the press release on Mahindra’s investor page to confirm.
Does this page give an M&M Q2 results FY27 buy or sell call?
No. This is research and education, not advice. PositionalCalls.com is not a SEBI-registered research analyst or investment adviser. Use the numbers to frame questions and speak to a registered adviser before investing.
Sources
- Business Today, 5 November 2026 (headline figures, price)
- APAC News Network, November 2026 (segment and subsidiary detail)
- Lapaas Voice, 5 November 2026 (H1, margins, volumes)
- NewsBytes, 5 November 2026 (owners’ profit, H1, price at 4:42 PM)
- Whalesbook, 5 November 2026 (segment revenue, standalone margin)
- M&M outcome of board meeting and Q1 FY27 results, NSE archive (30 July 2026) (opened)
- M&M press release on Q2 FY26 results, company website (4 November 2025)
- Mahindra Auto September 2026 sales release, company website
- Autocar Pro, Q2 FY26 results coverage, November 2025 (year-ago SUV share headline)
- BSE and NSE announcement pages: where the Q2 FY27 filing appears (I did not open it).
Editorial disclosure: PositionalCalls.com is not a SEBI-registered research analyst or investment adviser. Investments in securities markets are subject to market risks. Read all related documents carefully before investing. Returns are never guaranteed. PositionalCalls.com is an independent research and education site founded by Shubham Chaudhary. This page is not investment advice, a recommendation or a price target. How I researched this: I opened M&M’s Q1 FY27 filing, read five press reports of the Q2 FY27 results, tied half-year totals and business profits to the group figures, recomputed every derived number and listed conflicts openly; I have not opened the Q2 FY27 filing.

Shubham Chaudhary is the founder of PositionalCalls, an independent Indian stock market research website. He writes company fundamentals, quarterly results analysis, IPO analysis and sector research for NSE and BSE listed companies, with a focus on banking stocks, insurance and long-term value investing. Every article is built from primary sources such as RBI, SEBI, NSE and BSE filings and company annual reports, and states its risks plainly in simple language for retail investors.
Coverage areas Our research standards- Numbers checked against NSE, BSE and SEBI filings
- Risks and limits stated in every article
- No paid promotions or broker tie-ups
- Articles updated when new filings arrive