
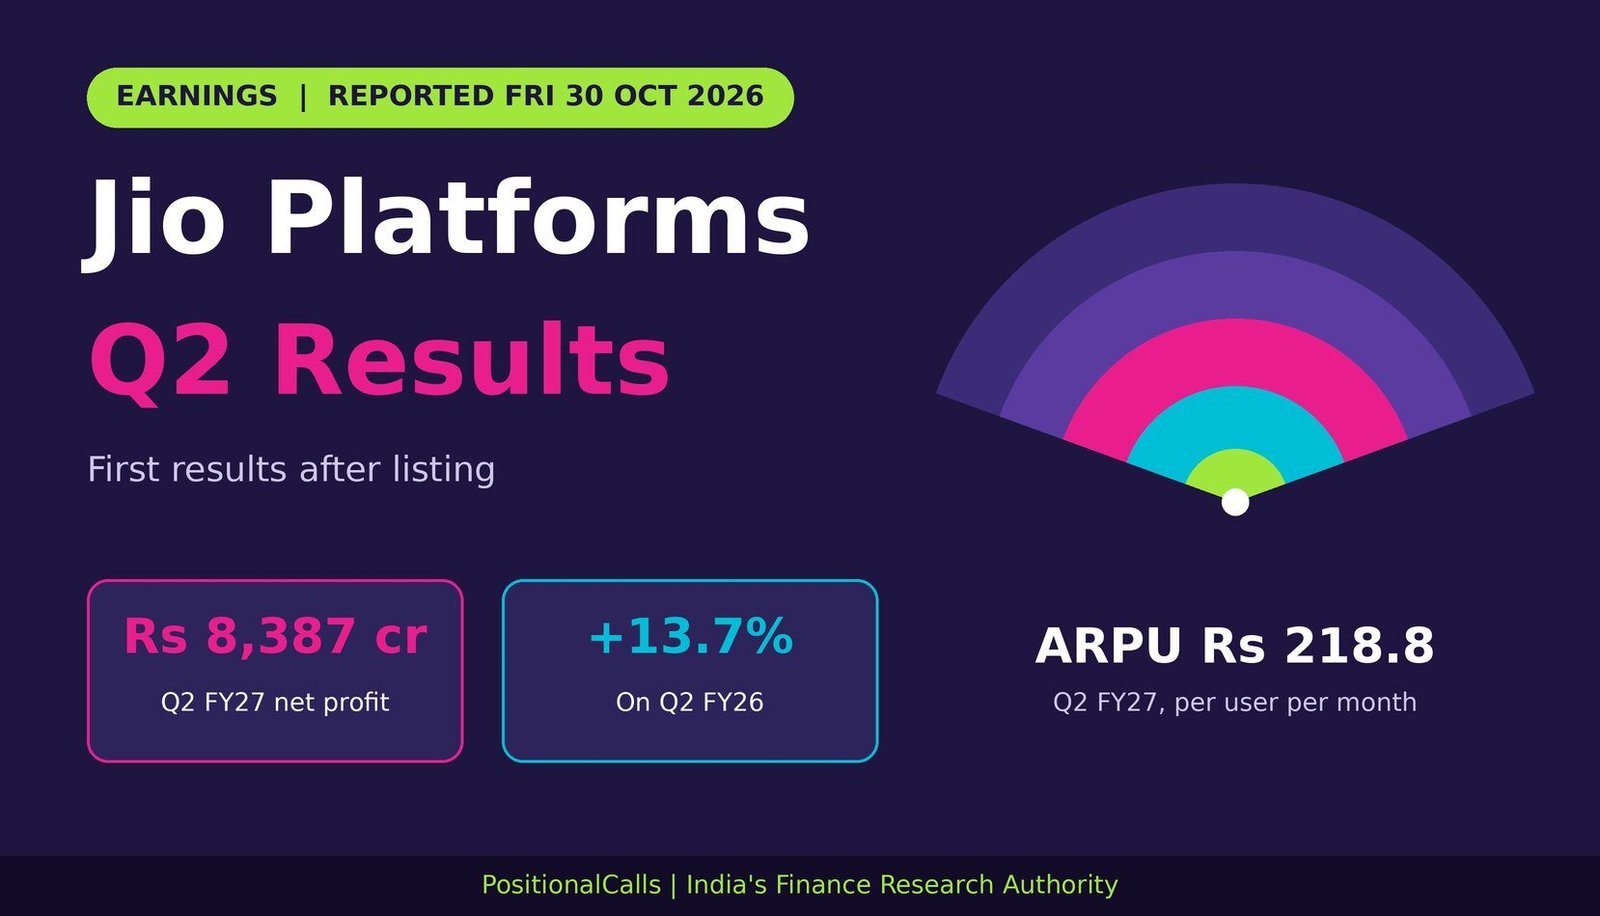
Earnings · Telecom · Jio Platforms
The Jio Platforms Q2 results are the first since the 28 October 2026 listing: profit up about 14%, ARPU at Rs 218.8 and a record-looking margin. But two profit versions and two EBITDA versions circulate, so here is how to read them.
Quick answer
Jio Platforms Q2 results, reported on Friday, 30 October 2026: consolidated net profit Rs 8,387 crore, up 13.7%, revenue from operations Rs 40,475 crore, up 11.4%, ARPU Rs 218.8. EBITDA shows as Rs 21,879 crore (54.1%) or Rs 20,901 crore (51.64%), as of 13 November 2026, 11:20 PM IST.
Latest update (Friday, 13 November 2026, 11:20 PM IST): I added the first trading-day price reports for 2 November, which differ, and Motilal Oswal’s Buy rating with a Rs 1,515 target as reported by NewsBytes (a single source). The results figures are unchanged.
- Monday, 2 November 2026, 11:00 AM IST: The page carried the reported Q2 FY27 numbers and replaced the preview; no share price after the results was given.
- Friday, 30 October 2026, 8:30 AM IST: The preview was published with the base figures, one broker estimate and the date check.
- Wednesday, 28 October 2026: The shares listed at Rs 1,358 against the Rs 1,119 issue price.
Key takeaways
- Profit: Rs 8,387 crore (+13.7%); Upstox shows Rs 8,389 crore on a Rs 7,379 crore base.
- Revenue: Rs 40,475 crore from operations (+11.4%); gross revenue Rs 47,485 crore (+11.3%).
- ARPU: Rs 218.8, up 3.5% on the year and 1.5% on Q1.
- EBITDA: Rs 21,879 crore (54.1%) or Rs 20,901 crore (51.64%), depending on the report.
- Customers: 542.4 million, 9.1 million added, 300 million on 5G.
- Brokerage, as reported: Motilal Oswal Buy, Rs 1,515 target, 2 November (single source); this page gives no call.
- Price: 2 November reports differ: up to Rs 1,475 or Rs 1,476.15, then Rs 1,402.65 at 3:45 PM IST.
In plain words: Jio Platforms runs India’s largest mobile network and a fast-growing home broadband business. ARPU is the money it earns per customer per month. This page shows what it reported, why reports differ, and what to check in the filing.
Data note: Analysis only. No buy or sell calls, targets or price zones. Price and brokerage items are as of 13 November 2026, 11:20 PM IST. Results come from PSU Connect, Asianet Newsable, Upstox and HDFC Sky reports; base figures from the earlier preview. I did not open the filing. The estimate and the brokerage rating are each from one source. Derived numbers are my calculation.
What did the Jio Platforms Q2 results show?
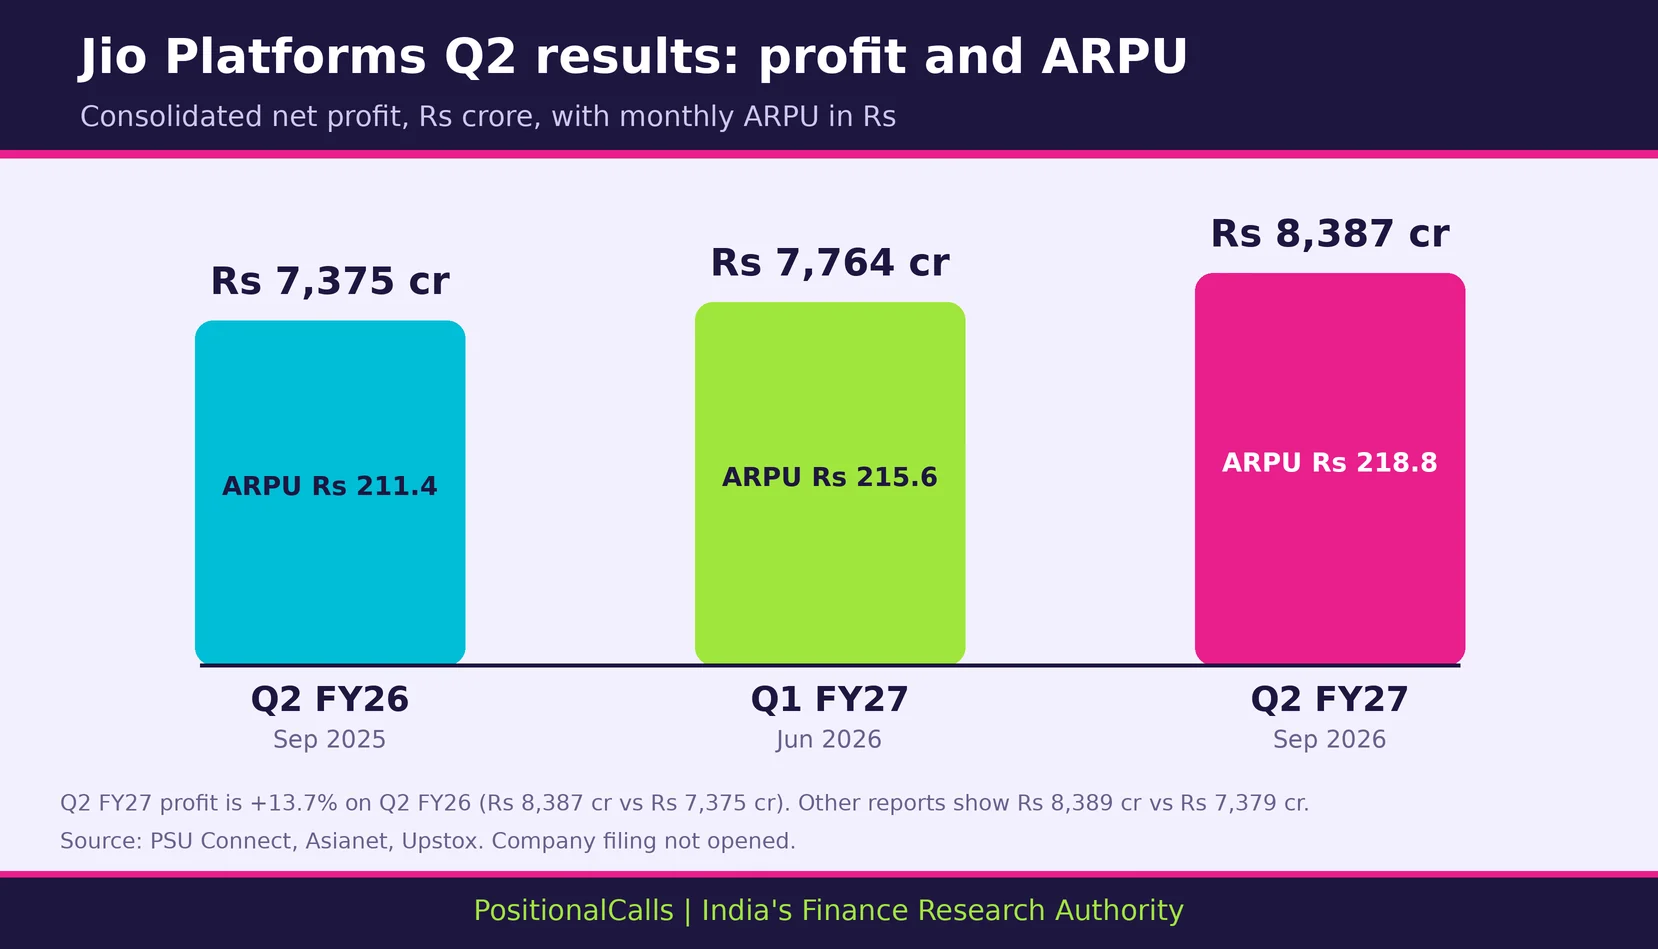
The Jio Platforms Q2 results show consolidated net profit of Rs 8,387 crore, up 13.7%, on revenue from operations of Rs 40,475 crore, up 11.4%, with ARPU of Rs 218.8.
| Measure (consolidated) | Q2 FY26 (Sep 2025) | Q1 FY27 (Jun 2026) | Q2 FY27 (Sep 2026) |
|---|---|---|---|
| Net profit, Rs crore | 7,375 (7,379 in other reports) | 7,764 | 8,387 (8,389 in other reports) |
| Revenue from operations, Rs crore | 36,332 | 39,173 | 40,475 (+11.4% year on year) |
| Gross revenue, Rs crore | 42,652 | 45,961 | 47,485 (+11.3%) |
| EBITDA, Rs crore | 18,757 or 18,103 | 20,865 | 21,879 or 20,901 |
| EBITDA margin on operations revenue | 51.6% or 49.8% | 53.3% | 54.1% or 51.6% |
| ARPU, Rs per month | 211.4 | 215.6 | 218.8 |
Cite this table: PositionalCalls, “Jio Platforms Q2 FY27 Results Table, as of 2 November 2026”.
The half-year profit, Rs 7,764 crore plus Rs 8,387 crore, is Rs 16,151 crore, which matches the first-half figure PSU Connect reported; against about Rs 14,485 crore a year earlier (7,110 plus 7,375) that is +11.5% (my calculation).
The company also reported a first-half free cash flow, EBITDA less cash capex, of Rs 32,130 crore, up 98%, according to PSU Connect. Asianet added that higher finance costs from capitalising 5G assets in March 2026 partly offset EBITDA growth, which is one reason profit grew less than EBITDA.
What is the Jio Platforms Q2 results date and filing time?
Jio Platforms released its Q2 results on Friday, 30 October 2026, after a board meeting that was announced on 28 October. The exact filing time is not in the reports I opened.
Asianet Newsable published the figures at 7:50 PM IST on 30 October and said the results were announced on Friday. Upstox’s results page showed the stock still trading before the numbers around 2:35 PM, and PSU Connect and HDFC Sky followed on 31 October and 2 November. Last year Reliance and Jio released their September-quarter numbers on the evening of 17 October 2025, so an evening filing fits the pattern, but I cannot state a time.
Treat any report on the Jio Platforms Q2 results that gives a different date or mixes in Jio Financial Services as a different company.
Which Jio Platforms Q2 net profit figure is right?
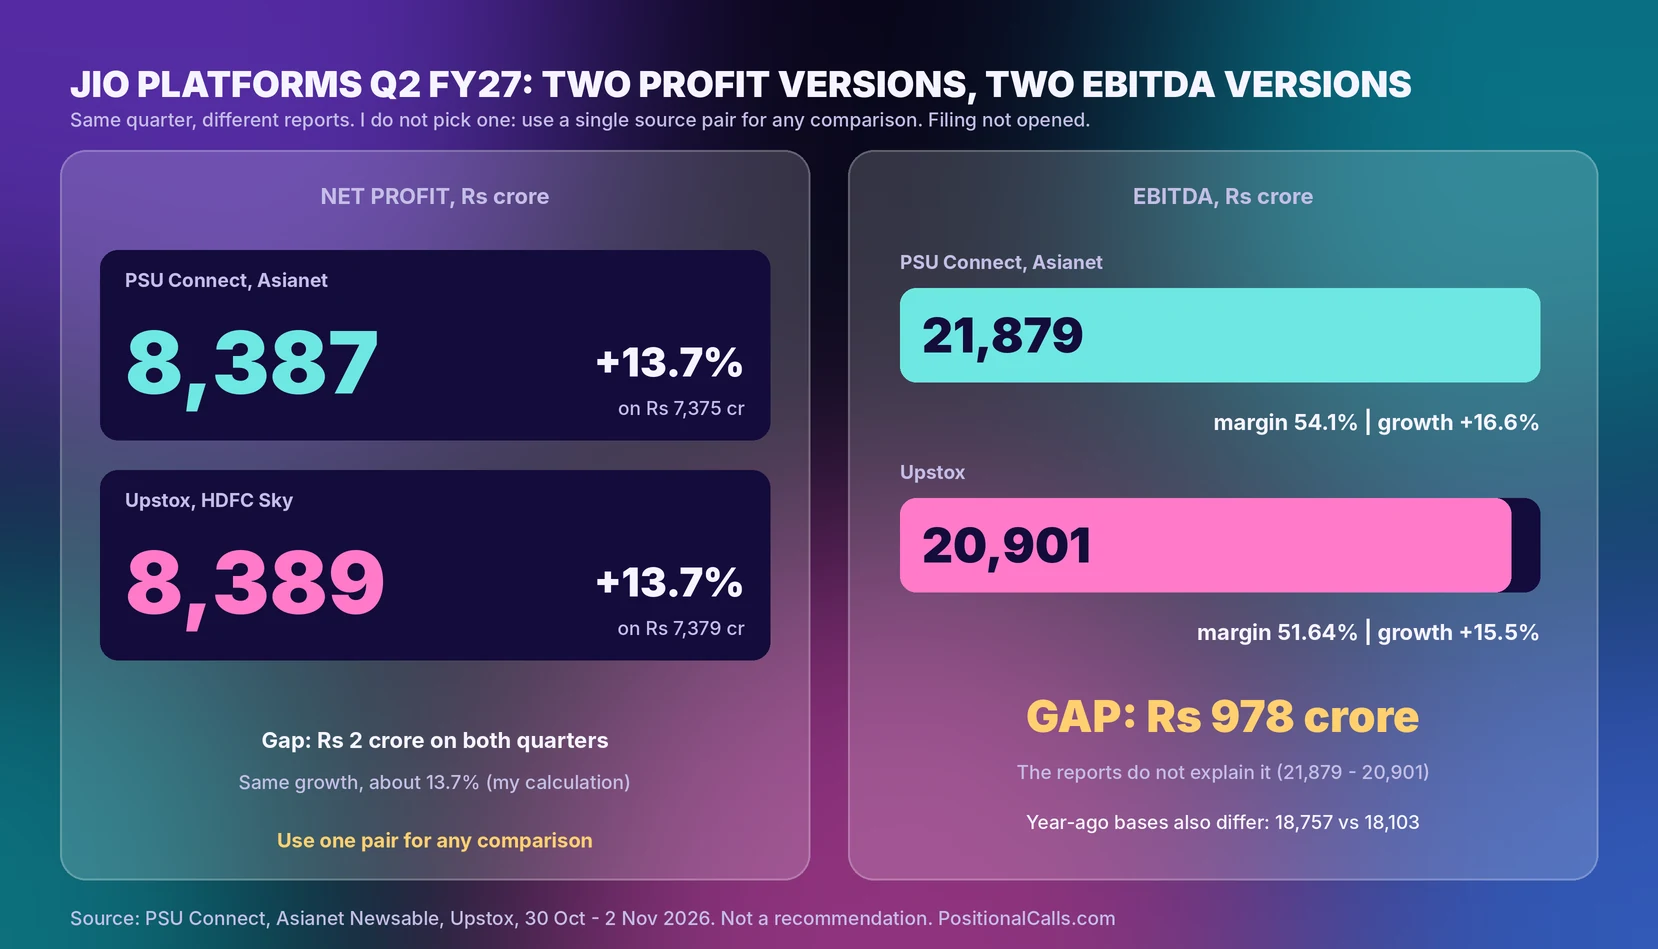
In the Jio Platforms Q2 results both pairs are close: Rs 8,387 crore against Rs 7,375 crore, and Rs 8,389 crore against Rs 7,379 crore. Each gives about 13.7% growth, so pick one pair and keep it.
| Figure | Version A | Version B | The trap |
|---|---|---|---|
| Q2 FY27 net profit, Rs crore | 8,387 (PSU Connect, Asianet) | 8,389 (Upstox, HDFC Sky) | Rs 2 crore apart |
| Q2 FY26 net profit, Rs crore | 7,375 (PSU Connect, Asianet) | 7,379 (Upstox; our preview, from PTI) | Rs 4 crore apart |
| Growth headline | 13.7% | 14% (rounded in headlines) | Same quarter, different rounding |
| Revenue, Rs crore | 40,475 from operations | 47,485 gross | Rs 7,010 crore apart (my calculation) |
| EBITDA, Rs crore | 21,879 | 20,901 | Rs 978 crore apart (my calculation) |
| Total expenses, Rs crore | 30,194 (Upstox) | Revenue minus EBITDA gives 19,574 (my calculation) | Upstox does not explain the gap |
Cite this table: PositionalCalls, “Jio Platforms Definition-Trap Table, as of 2 November 2026”.
The small profit gap likely comes from a restated base or a rounding or classification choice, but the reports do not say, so I treat it as an open question. For a Jio Platforms Q2 net profit comparison, use the pair that sits in one source, and write down which source it was.
Subsidiary versus parent
Reliance Jio Infocomm, the telecom subsidiary, reported Rs 6,972 crore of profit in Q2 FY26, and the listed parent reported Rs 7,379 crore. The two are different bases. Do not quote one as the other.
Gross revenue versus revenue from operations
Gross revenue of Rs 47,485 crore includes items that revenue from operations of Rs 40,475 crore leaves out. Growth rates are almost the same (11.3% and 11.4%), but margins differ by basis, so use one basis for every ratio.
Did the Jio Platforms Q2 results beat the estimate?
Against the one broker estimate I found, the Jio Platforms Q2 results had ARPU about 0.4% above it, and revenue and EBITDA growth were both double digits, as expected.
| Item | Elara Capital estimate (7 Oct 2026) | Reported | Comment (my calculation) |
|---|---|---|---|
| ARPU | About Rs 218 | Rs 218.8 | +0.4% above the estimate |
| Net additions | About 7.2 million mobile | 9.1 million net customer additions | Definitions may differ |
| Revenue growth | Double digit | +11.4% (operations) | In line |
| EBITDA growth | Double digit | +16.6% or +15.5% | In line on either version |
| Tariff hike | None assumed | None reported in the sources | No effect visible |
Cite this table: PositionalCalls, “Jio Q2 FY27 Actual versus Estimate Table, as of 2 November 2026”.
This is one broker, not a consensus; I found no Bloomberg or other consensus for the quarter. The ARPU rise came without a tariff hike in the reports I read, which suggests a better plan mix and more 5G and broadband customers, though I did not see the company’s explanation.
What did the TRAI data say?
Upstox, citing TRAI data for September 2026, reported that Reliance Jio added 27.13 lakh wireless subscribers, reaching 51.11 crore and a 39.32% share. TRAI counts and company-reported additions follow different definitions, so do not compare the two directly.
How did the preview scenarios compare with the Jio Platforms Q2 net profit?
The preview’s arithmetic scenarios sat below the actuals: revenue came in about +0.9% above the Rs 40,113 crore scenario and profit above the flat-profit scenario by +8.0%.
The scenarios in our Jio Platforms Q2 results preview were never forecasts. They are shown only to make the comparison concrete.
| Preview scenario | Scenario figure, Rs crore | Reported, Rs crore | Gap (my calculation) |
|---|---|---|---|
| Revenue up 2.4% on Q1 | 40,113 | 40,475 | +0.9% |
| Profit flat on Q1 | 7,764 | 8,387 | +8.0% |
| Profit up 4% on Q1 | 8,075 | 8,387 | +3.9% |
| EBITDA at a 53.3% margin | 21,380 | 21,879 or 20,901 | +2.3% or -2.2% |
Cite this table: PositionalCalls, “Jio Q2 FY27 Scenario Review, as of 2 November 2026”.
Why do two Jio Platforms EBITDA figures circulate?
In the Jio Platforms Q2 results, PSU Connect and Asianet give EBITDA of Rs 21,879 crore against Rs 18,757 crore; Upstox gives Rs 20,901 crore against Rs 18,103 crore. The reports do not explain the gap.
| Version | Q2 FY27, Rs crore | Q2 FY26, Rs crore | Growth | Margin on Rs 40,475 crore |
|---|---|---|---|---|
| PSU Connect, Asianet, HDFC Sky | 21,879 | 18,757 | +16.6% | 54.1% vs 51.6% |
| Upstox | 20,901 | 18,103 | +15.5% | 51.6% vs 49.8% |
| Q1 FY27 (Upstox series) | 20,864 | Not applicable | +0.2% quarter on quarter for Q2 | 53.3% |
Cite this table: PositionalCalls, “Jio Platforms EBITDA Versions Table, as of 2 November 2026”.
The Upstox series matches the Q1 FY27 EBITDA of Rs 20,865 crore that our preview used, which suggests it uses the same definition as the earlier quarter. If the Upstox series is right, EBITDA was almost flat on Q1 and the margin slipped from 53.3% to 51.6%; if the higher series is right, the margin rose to 54.1% (my calculations).
A headline saying margin “improved by 250 bps” or “181 bps” describes a different EBITDA line, not a different quarter. Read the filing’s definition note before you quote one.
Asianet reported that higher finance costs from capitalising 5G assets in March 2026 partly offset EBITDA growth, so profit growth of 13.7% trails the 16.6% EBITDA growth on the higher series.
Jio Platforms Q2 results: numbers calculated from the reported figures
My arithmetic on the reported numbers above, not new disclosures.
| Measure | Calculation (Rs crore) | Result |
|---|---|---|
| Net profit margin, Q2 FY27 | 8,387 ÷ 40,475 | 20.7% (20.3% a year ago; 19.8% in Q1) |
| Profit, quarter on quarter | 8,387 vs 7,764 | +8.0% |
| Revenue, quarter on quarter | 40,475 vs 39,173 | +3.3% |
| ARPU, quarter on quarter | Rs 218.8 vs Rs 215.6 | +1.5% |
| EBITDA margin gap, two versions | 54.1% vs 51.64% | 246 basis points (Rs 978 crore) |
| Customers added, year on year | 542.4 vs 506.4 million | +36.0 million |
Cite this table: Derived measures, my calculation from company-reported figures, as of 13 November 2026, 11:20 PM IST.
Hinglish summary: Jio Platforms ka Q2 FY27 net profit Rs 8,387 crore raha, saal-dar-saal 13.7% upar. Revenue Rs 40,475 crore (+11.4%) aur ARPU Rs 218.8 hai. EBITDA ke do alag aankde chal rahe hain, isliye source dekhna zaroori hai. Yeh sirf jaankari hai, buy ya sell salah nahi.
Illustration, not a forecast.
What is Jio ARPU in Q2 FY27 and what does it show?
Jio ARPU was Rs 218.8 per user per month in Q2 FY27, up 3.5% from Rs 211.4 a year earlier and 1.5% from Rs 215.6 in Q1 (my calculation).
| Quarter | ARPU, Rs per month | Change | Source |
|---|---|---|---|
| Q1 FY26 (Jun 2025) | 208.8 | Base | Free Press Journal |
| Q2 FY26 (Sep 2025) | 211.4 | +8.4% on Rs 195.1 | PTI |
| Q1 FY27 (Jun 2026) | 215.6 | +3.3% on the year | Inc42, Upstox |
| Q2 FY27 (Sep 2026) | 218.8 | +3.5% on the year; +1.5% on the quarter | PSU Connect, Asianet, Upstox |
Cite this table: PositionalCalls, “Jio ARPU Q2 FY27 Path, as of 2 November 2026”.
Subscribers, 5G and broadband
PositionalCalls WhatsApp channel
Get the Jio and Reliance Q2 numbers on WhatsApp
- Date and filing alerts for Jio Platforms and Reliance results
- The profit figures explained after the filing
- Links to updated Q2 FY27 analysis pages
| Operating line | Q2 FY27 | Comparison | Source |
|---|---|---|---|
| Total customers | 542.4 million | +7.1% on 506.4 million | Asianet |
| Net additions in the quarter | 9.1 million | Q1 FY27 was 8.9 million | PSU Connect; Inc42 |
| 5G customers | 300 million | +66 million in 12 months; 56% of wireless traffic | Upstox |
| Fixed broadband customers | 30 million | Jio AirFiber 15.1 million | PSU Connect; Upstox |
| Monthly churn | 1.6% | From 1.9% a year earlier | Asianet; Upstox |
| Data use per customer | 44.2 GB a month | Total traffic +22.1% | Upstox |
| Segment revenue growth | Connectivity +11%; digital services +16% | Gross revenue basis not stated | Asianet; Upstox |
Cite this table: PositionalCalls, “Jio Operating Metrics Table, as of 2 November 2026”.
What do the Jio Platforms results after listing change?
On 30 October, the day of the Jio Platforms Q2 results, Upstox said the shares settled 0.68% higher at Rs 1,437.50 on the NSE on 30 October, 5.9% above the Rs 1,358 listing price and 28.5% above the issue price (my calculations).
The shares listed at Rs 1,358 on 28 October, a 21.4% premium to the Rs 1,119 issue price, after the Rs 30,213 crore issue closed 22.19 times subscribed. PSU Connect gave the issue size as Rs 30,188 crore, a small difference between reports. Upstox put the market value at Rs 13,18,088.58 crore at 6:59 PM on 30 October.
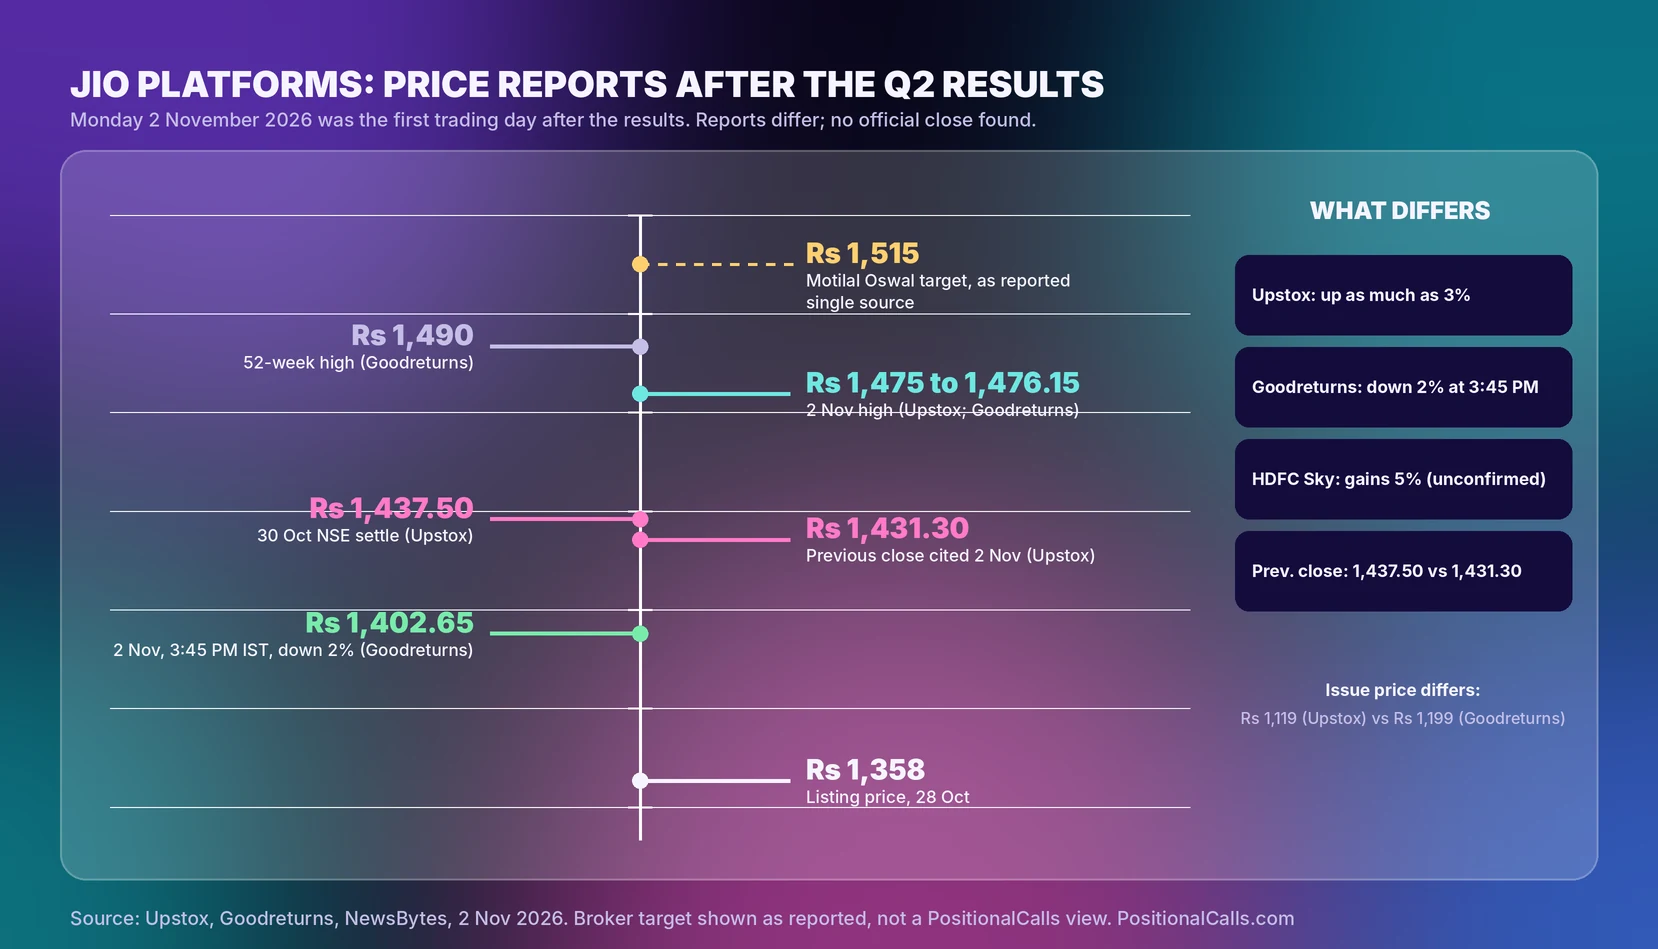
The first trading day after the results was Monday, 2 November, and the reports differ. Upstox says the stock rallied as much as 3% to Rs 1,475 on the NSE against a previous close of Rs 1,431.30. Goodreturns, published at 3:45 PM IST, says it touched Rs 1,476.15 and was at Rs 1,402.65, down 2%, with a market value of Rs 12,95,526.46 crore at the closing bell. HDFC Sky’s headline says the stock gained 5% for a second straight day, which fits neither report. I found no official close and no later price.
Jio Platforms share price after the Q2 results: what each report says
| Report | Time | Reading | Note |
|---|---|---|---|
| Upstox | 2 Nov, updated 10:36 AM | High Rs 1,475; previous close Rs 1,431.30 | Up as much as 3%; no close given |
| Goodreturns | 2 Nov, 3:45 PM | High Rs 1,476.15 (+3.1%); Rs 1,402.65 (-2%) | 52-week high Rs 1,490; value Rs 12,95,526.46 crore |
| HDFC Sky | 2 Nov, morning | “Gains 5% for 2nd straight day” | Body not available; not confirmed |
| Conflict: previous close | 30 Oct vs 2 Nov | Rs 1,437.50 (Upstox, 30 Oct) vs Rs 1,431.30 (Upstox, 2 Nov) | Gap of Rs 6.20; likely a different exchange or timing, unconfirmed |
| Conflict: issue price | As reported | Rs 1,119 (Upstox, this page) vs Rs 1,199 (Goodreturns) | I use Rs 1,119, the top of the Rs 1,065 to Rs 1,119 band |
Cite this table: Jio Platforms share price reports, Upstox and Goodreturns, as of 13 November 2026, 11:20 PM IST; no official close found.
Rs 1,402.65 is 3.3% above the Rs 1,358 listing price and 25.3% above the Rs 1,119 issue price (my calculation).
Did the IPO money show up in Q2?
No. The quarter ended on 30 September 2026, before the issue opened on 21 October. Jio planned to use up to Rs 27,500 crore of the proceeds to repay borrowings of Reliance Jio Infocomm, according to the DRHP as reported by Outlook Money, so any interest saving should appear in later quarters. Check the subsequent-events note in the accounts.
What is Reliance’s stake after the IPO?
Before the issue Reliance held 66.43% of 893.9 crore shares, about 593.8 crore shares. The fresh issue added 27 crore shares, making 920.9 crore, so the stake is about 64.5% (my calculation). HDFC Sky says about 66.4%, which is the pre-issue figure; confirm in the shareholding pattern filed after listing.
For the day-one record see our listing and allotment guide, and read the tax rules in our guide to capital gains tax on shares before you act on any gain. This page does not say whether any price is cheap or dear.
What are the Jio Platforms target price and brokerage ratings after the Q2 results, as reported?
The only broker rating I found after the Jio Platforms Q2 results is Motilal Oswal’s Buy with a target of Rs 1,515, reported on 2 November 2026 by NewsBytes. It is a single source, not a consensus, and this page gives no call.
| Broker (as reported) | Rating | Target, Rs | Date | Basis | Flag |
|---|---|---|---|---|---|
| Motilal Oswal | Buy | 1,515 | 2 Nov 2026, 10:28 PM | DCF, about 12.2x FY29 reported EBITDA | NewsBytes; single source |
| Elara Capital | Not found | Not found | 7 Oct 2026 | Pre-results ARPU and additions estimate only | No rating or target in the report found |
| Other brokers | None found | None found | Not applicable | Not applicable | No consensus found |
Cite this table: Jio Platforms brokerage views as reported, NewsBytes and Business Today, as of 13 November 2026, 11:20 PM IST. Not PositionalCalls targets.
As arithmetic only, Rs 1,515 is 5.8% above the Rs 1,431.30 previous close, 8.0% above Rs 1,402.65 and 5.4% above the Rs 1,437.50 settle of 30 October (my calculation). Those are earlier prices, not a current quote.
What does a brokerage target price mean for Jio Platforms?
A target price is a broker’s estimate of a share’s value a year or so ahead, built from a model. A DCF discounts forecast cash flows, and a multiple applies a ratio such as value to EBITDA to a forecast year; Motilal Oswal’s reported method is about 12.2x FY29 EBITDA. Brokers can reach different targets from the same Jio Platforms Q2 results because they assume different margins, growth and tariffs. This page gives no buy or sell view, target or price zone.
How do the Jio Platforms Q2 results connect to Reliance Industries?
Reliance reported on the same day and consolidates Jio, which supplied Rs 8,387 crore of the group’s Rs 29,550 crore total profit after tax before minority interest effects.
The Jio Platforms Q2 results and the Reliance results sit in one group. This compares figures from different reports and ignores minorities, so it is only a size check. Our Reliance Q2 results FY27 analysis shows that O2C did most of the group’s EBITDA growth, while Jio PAT of Rs 8,387 crore and ARPU of Rs 218.8 match this page.
| Company | Profit line | Q2 FY27, Rs crore | Trap |
|---|---|---|---|
| Jio Platforms Limited | Consolidated net profit | 8,387 (or 8,389) | Not the subsidiary’s profit |
| Reliance Industries | Profit attributable to owners | 25,548 | Different from total PAT of 29,550 |
| Reliance Industries | Total profit after tax | 29,550 | Includes associates and minorities |
Cite this table: PositionalCalls, “Same-Day Reliance Group Results, as of 2 November 2026”.
The Q2 results calendar and earnings calendar list the other companies reporting this season, including Airtel, Jio’s main telecom rival.
How to read the Jio Platforms Q2 results in 10 minutes
Read seven lines in order: consolidated profit, revenue, EBITDA definition, ARPU, net additions, the subsequent-events note and the standalone-versus-consolidated label.
| What to read | Mark to compare | Question to ask |
|---|---|---|
| Consolidated net profit | Rs 8,387 crore (or 8,389) | Which pair does the report use? |
| Revenue from operations | Rs 40,475 crore | Operations or gross revenue? |
| EBITDA and margin | Rs 21,879 crore or Rs 20,901 crore | Which definition does the filing use? |
| ARPU | Rs 218.8 | Is it the mobile-only figure? |
| Net additions and churn | 9.1 million; 1.6% | Are additions mobile or total? |
| Subsequent events note | IPO closed 23 October 2026 | Does it give the debt repayment plan? |
| Standalone or consolidated | Headline is consolidated | Which line did a headline use? |
Cite this table: PositionalCalls, “Jio Platforms Results-Day Decoder, as of 2 November 2026”.
How to read the Jio Platforms filing on NSE or BSE
Open the exchange announcement, find the consolidated statement and compare each line with the tables above, same measure, same basis.
- Open the BSE corporate announcements page or the NSE corporate filings page and search for Jio Platforms Limited.
- Choose the announcement titled outcome of board meeting for the quarter ended 30 September 2026.
- Find the consolidated statement first, then the standalone.
- Check the unit and whether a column is for the quarter or six months.
- Read revenue, expenses, EBITDA if shown, finance cost and profit after tax.
- Open the press release for ARPU, customers and segment growth.
- Check the notes for the IPO proceeds and other events after the period.
- Compare every figure with the tables above.
What it costs: reading a filing is free. Trading adds brokerage, securities transaction tax and other charges. Scam warning: on results day, fake “result alert” groups and sure-shot tips circulate. Nobody can guarantee a gain.
Jio Platforms Q2 results: what to compare in Q3 FY27
No Q3 estimate; the Q3 date is not announced.
| Measure | Q2 FY27 reported | Check in Q3 |
|---|---|---|
| Net profit | Rs 8,387 crore | Growth on base |
| ARPU | Rs 218.8 | Rise or fall |
| Customers | 542.4 million | Net additions and 5G users |
| EBITDA margin | 54.1% or 51.64% | Definition in the filing |
| Broker target | Rs 1,515, one source | New ratings and dates |
Cite this table: This page’s Q2 FY27 tables, as of 13 November 2026, 11:20 PM IST.
What are the risks around the Jio Platforms results?
What do most people miss about the Jio Platforms Q2 net profit?
- Two versions of EBITDA. A Rs 978 crore gap that the reports do not explain.
- Profit grew less than EBITDA. Finance costs on 5G assets took part of the gain.
- The IPO money is not in Q2. The quarter ended before the issue opened.
- Subsidiary profit is not parent profit. Rs 6,972 crore and Rs 7,379 crore are different bases.
- Net additions differ by definition. 9.1 million total is not the broker’s mobile-only 7.2 million.
Analyst’s note: how to think about this quarter
- What stands out (reasoning): in the Jio Platforms Q2 results profit grew about 8% in the quarter, which is more than a flat telecom business would deliver without a tariff rise.
- Easy to miss: the margin story depends entirely on which EBITDA line you accept.
- What would change the view: a filing that confirms the lower EBITDA series, or net additions that turn out to be mobile-only and lower.
- Caution: one quarter does not fix a long-term value. This page gives no target or recommendation.
- Reader action: choose one source pair, compare the same lines, and check the filing.
Bottom line
Known: the Jio Platforms Q2 results show consolidated net profit of about Rs 8,387 crore (+13.7%), revenue from operations of Rs 40,475 crore (+11.4%) and ARPU of Rs 218.8. Not known yet: which EBITDA line the filing uses, the exact filing time and the share price after the results. Your move: use the decoder table and compare same-basis figures. Next read: Reliance Q2 results FY27, which carries the parent’s numbers.
Part of the earnings coverage.
PositionalCalls WhatsApp channel
Results day, in one WhatsApp channel
- Filing alerts for Jio Platforms and other large companies
- The profit figures explained
- The next company on the results calendar
Jio Platforms Q2 results: frequently asked questions
When were the Jio Platforms Q2 results announced?
The Jio Platforms Q2 results were announced on Friday, 30 October 2026, the company’s first as a listed firm. Asianet Newsable published the numbers at 7:50 PM IST that day. The sources I opened do not give the exact filing time, so confirm it on the BSE or NSE announcement page.
What was the Jio Platforms Q2 net profit?
Consolidated net profit was Rs 8,387 crore, up 13.7% from Rs 7,375 crore, according to PSU Connect and Asianet. Upstox and HDFC Sky show Rs 8,389 crore against Rs 7,379 crore, which is also a rise of about 13.7%. Use one pair for any comparison.
What was Jio ARPU in Q2 FY27?
Monthly ARPU was Rs 218.8, against Rs 211.4 a year earlier (up 3.5%) and Rs 215.6 in Q1 FY27 (up 1.5%, my calculation). ARPU is revenue per customer per month. No tariff hike appears in the reports I read, so the rise points to plan mix and more 5G and broadband users (my reading).
What was Jio’s revenue and EBITDA?
Revenue from operations was Rs 40,475 crore (up 11.4%) and gross revenue Rs 47,485 crore (up 11.3%). EBITDA was Rs 21,879 crore, up 16.6%, at a 54.1% margin in the company-style summary, while Upstox shows Rs 20,901 crore at 51.64%. The bases differ.
Why do two EBITDA figures circulate?
PSU Connect and Asianet give Rs 21,879 crore against Rs 18,757 crore. Upstox gives Rs 20,901 crore against Rs 18,103 crore, which matches the Q1 FY27 series it also shows. The reports do not explain the gap, so open the filing before you compare.
Did the Jio Platforms Q2 results beat the Elara estimate?
Elara Capital (7 October 2026) expected ARPU near Rs 218; the actual was Rs 218.8, about 0.4% higher (my calculation). It expected about 7.2 million net additions; the company reported 9.1 million net customer additions, though the two may use different definitions.
How many subscribers does Jio have after Q2 FY27?
The company reported 542.4 million subscribers, up 7.1% from 506.4 million, with 300 million on 5G and 30 million fixed broadband customers, of which 15.1 million are on Jio AirFiber. Monthly churn was 1.6%. TRAI’s September data, per Upstox, show 51.11 crore wireless subscribers and a 39.32% share, on a different definition, so do not compare the two directly.
How did Jio shares react after the Jio Platforms Q2 results?
The first trading day after the results was Monday, 2 November 2026. Upstox says the stock rallied as much as 3% to Rs 1,475 from Rs 1,431.30; Goodreturns had it at Rs 1,402.65, down 2%, at 3:45 PM IST after a high of Rs 1,476.15. I found no official close and no later price.
Is Jio Platforms a buy after the Q2 results, and what is the target price?
This page gives no call. Motilal Oswal rated Jio Platforms Buy with a Rs 1,515 target, using a DCF of about 12.2x FY29 EBITDA, per NewsBytes on 2 November 2026. That is one broker, not a consensus. PositionalCalls is not SEBI-registered and gives no targets or price zones.
What was the Jio free cash flow in H1 FY27?
PSU Connect reported free cash flow, EBITDA less cash capex, of Rs 32,130 crore for the first half, up 98% on the year. I could not check the cash-capex basis, so treat it as the company’s own measure. Read the capex note in the filing before comparing it with other companies.
Sources
- NewsBytes: Motilal Oswal gives Jio Platforms Buy with Rs 1,515 target, 2 November 2026, 10:28 PM; single source.
- Upstox: Jio Platforms shares rally 3% after first Q2 results since listing, updated 2 November 2026, 10:36 AM.
- Goodreturns: Jio Platforms share falls after gaining 3% in a day, 2 November 2026, 3:45 PM IST.
- BSE corporate announcements: where the Jio Platforms filing appears.
- NSE corporate filings: financial results: the same filing on NSE.
- PSU Connect: Jio Platforms Q2 revenue and PAT, 31 October 2026.
- Asianet Newsable: Jio Platforms Q2 FY27 results, 30 October 2026.
- Upstox: Jio Platforms Q2 results highlights, 30 October 2026.
- HDFC Sky: stocks to watch on Monday, 2 November 2026.
- Whalesbook, 28 October 2026, and Upstox: board meeting date.
- Business Today, 7 October 2026: Elara Capital telecom preview.
- Inc42, 17 July 2026: Q1 FY27 figures.
- PTI, as carried by NewsDrum, 17 October 2025: Q2 FY26 figures.
- Daily Pioneer (PTI), 28 October 2026: listing price and market value.
- Outlook Money: DRHP use of proceeds.
How I researched this: I compared the reported Q2 FY27 figures across four news reports of the results, kept the base figures from the earlier preview, noted where sources differ, and marked every derived number as my calculation. I did not open the company filing. Results figures are as of 2 November 2026 and unchanged; price and brokerage items are as of 13 November 2026, 11:20 PM IST.

Shubham Chaudhary is the founder of PositionalCalls, an independent Indian stock market research website. He writes company fundamentals, quarterly results analysis, IPO analysis and sector research for NSE and BSE listed companies, with a focus on banking stocks, insurance and long-term value investing. Every article is built from primary sources such as RBI, SEBI, NSE and BSE filings and company annual reports, and states its risks plainly in simple language for retail investors.
Coverage areas Our research standards- Numbers checked against NSE, BSE and SEBI filings
- Risks and limits stated in every article
- No paid promotions or broker tie-ups
- Articles updated when new filings arrive