
Sector Outlook · India
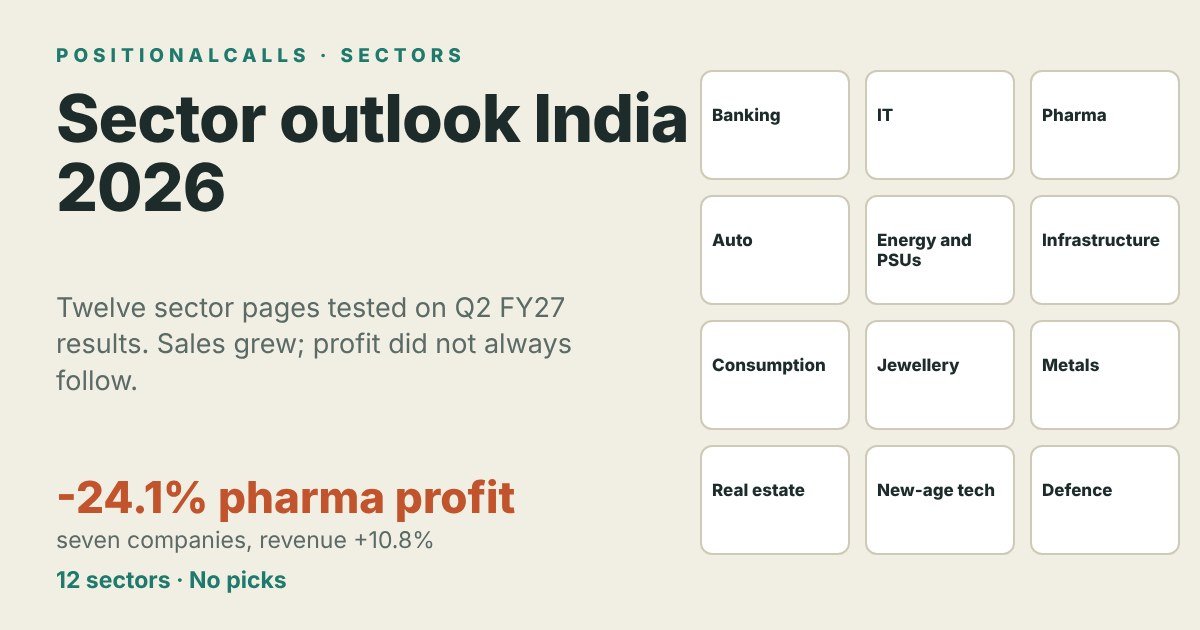
This sector outlook India hub explains how PositionalCalls tests twelve sectors against Q2 FY27 results, policy data and risks, shows what four recent pages found, records where sources disagree, and links every sector page.
Quick answer
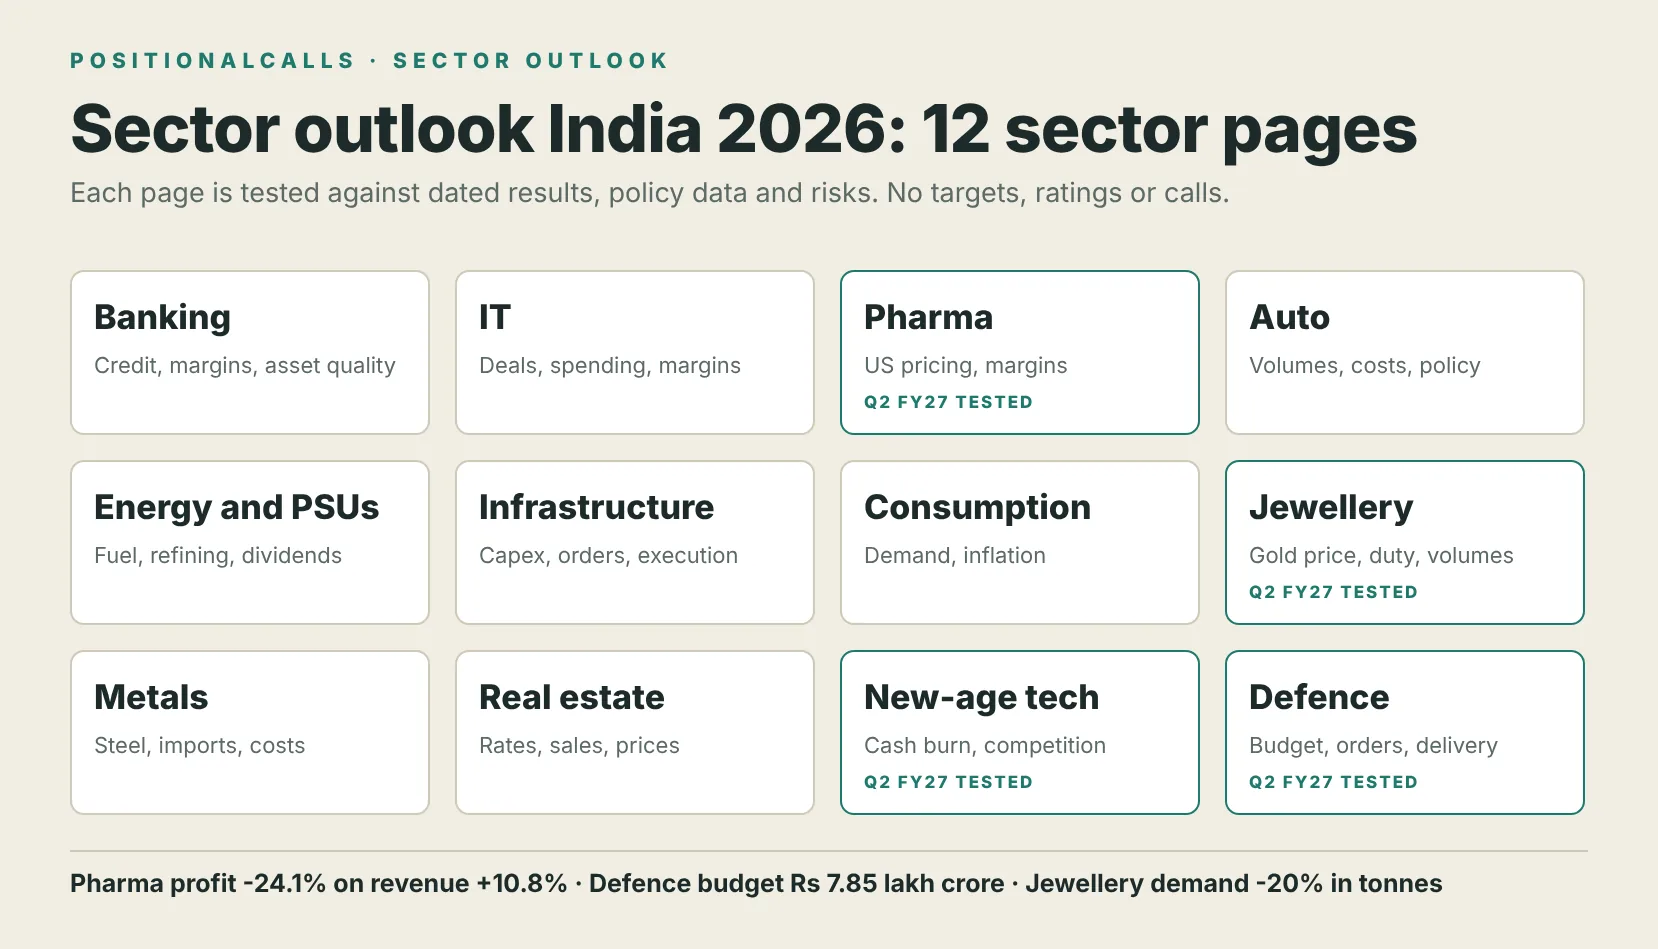
Sector outlook India on this site means twelve sector pages, each tested against dated results, official data and risks, with sources shown and no stock picks. In Q2 FY27 the tested pages show growth that does not always reach profit: pharma revenue rose about 10.8% while profit fell about 24.1%.
Key takeaways on the sector outlook India pages
- Coverage: twelve sector outlooks, with companion earnings or result pages for eight of them.
- Pattern: in the four pages tested here, revenue grew faster than profit, and one-off items changed the picture.
- Conflicts: six source conflicts are recorded in one table, with the version each page uses.
- Method: a five-question test shows what a weak sector page looks like.
- Rule: no targets, ratings or buy and sell calls anywhere in the section.
In plain words: this is the contents page for the sector section. It tells you which pages exist, what four of them found, where the numbers disagree and how to judge any sector page, including mine, before you lean on it.
Data note: as of Friday, 20 November 2026, 8:20 PM IST. The figures for pharma, jewellery, new-age tech and defence are taken from the live pages named in each section, which in turn cite the sources named there. I did not open exchange filings for this hub. For the other eight sectors the hub gives variables to check, not figures, so that it does not repeat a number that may change on the page itself.
Sector outlook India: which sector pages are on the site?
Twelve sectors have an outlook page, and eight of them have a companion earnings or company result page with the quarter’s numbers. The table lists each outlook, the main variables that move that sector and the pages that sit beside it. The variables are the standard drivers of each sector, not a summary of what each page concludes.
| Sector | Outlook page | Main variables | Companion pages |
|---|---|---|---|
| Banking | Banking sector outlook 2026 | Credit growth, margins, asset quality, capital | Banking sector earnings, PSU banks capital rotation |
| IT | IT sector outlook 2026 | Deal cycles, client spending, margins, currency | IT sector earnings Q2 FY27 |
| Pharma | Pharma sector outlook 2026 | US pricing, domestic growth, margins, regulation | Pharma sector earnings, Indian pharma outlook |
| Auto | Auto sector outlook 2026 | Monthly volumes, input costs, rural demand, policy | Auto sector earnings Q2 FY27 |
| Energy and PSUs | Energy PSU sector outlook 2026 | Fuel prices, refining margins, dividends, capex | Energy and PSU sector earnings |
| Infrastructure | Infrastructure sector outlook 2026 | Government capex, order books, execution, margins | Infrastructure sector earnings Q2 FY27 |
| Consumption | Consumption sector outlook 2026 | Urban and rural demand, inflation, margins | Consumption sector earnings Q2 FY27 |
| Jewellery | Jewellery sector outlook 2026 | Gold price, volumes, import duty, branded chains | Covered in the consumption pages |
| Metals | Metal sector outlook 2026 | Steel demand, commodity prices, imports, costs | Company result pages |
| Real estate | Real estate sector outlook 2026 | Interest rates, sales, prices, inventory | Company result pages |
| New-age tech | New-age tech stocks sector outlook 2026 | Cash burn, competition, profit, share supply | Company result pages |
| Defence | Defence sector outlook 2026 | Budget, orders, deliveries, margins | HAL Q2 results, Bharat Dynamics Q2 results |
Cite this table: Sector page index, PositionalCalls, Friday, 20 November 2026, 8:20 PM IST, variables are general sector drivers, not page conclusions.
The pharma section has two outlook pages written at different times, and the hub lists both so neither is orphaned. Insurance has no outlook page, but two stock-data pages cover it: best insurance stocks in India and best general insurance stocks in India. If you are new to the section, start with the sector you hold or follow, read its outlook page, and then open the companion page for the company figures.
A sector outlook India page is not a forecast of where a share price will go. It is a test of a sector view against dated evidence: what the budget or regulator did, what companies reported, what the data said about demand, and what could make the view wrong. That is why every page carries a data note and a risks section, and why the tables carry a line you can copy to cite them.
What did the sector outlook India pages find in Q2 FY27?
The four pages checked for this hub show growth in sales or order value, but profit growth was weaker or negative in each. The table quotes the headline each page carries, with the period and the source the page names. I checked these four pages on 20 November 2026 for this hub.
| Sector | Headline on the page | Period | Page |
|---|---|---|---|
| Pharma | Seven companies: revenue about +10.8%, net profit about -24.1% as reported | Q2 FY27 | Pharma outlook |
| Jewellery | Demand -20% in tonnes, value +16%; Titan jewellery revenue +24% | Jul-Sep 2026; Q2 FY27 | Jewellery outlook |
| New-age tech | Six of eight platforms reported a profit; Swiggy lost Rs 922 crore | Q2 FY27 | New-age tech outlook |
| Defence | Rs 7.85 lakh crore budget, Rs 2.12 lakh crore approvals, profit down at three of six companies | Budget 2026-27; Q2 FY27 | Defence outlook |
Cite this table: Headlines of four sector pages, PositionalCalls, Friday, 20 November 2026, 8:20 PM IST, as shown on each page; periods as stated there.
The next four sections give the figures behind each headline in the sector outlook India set, with the source the page names for each one. They are summaries of the pages, so open the page for the full table, the conflicts and the risks. The other eight sector pages are not summarised here, because I could not confirm their current figures against the live pages for this hub, and a stale number repeated on a hub is worse than no number.
Pharma sector outlook India: sales grew, profit did not
The pharma outlook shows revenue up about 10.8% and net profit down about 24.1% across seven large companies in Q2 FY27, the quarter to 30 September 2026. This page in the sector outlook India set says its data is as of 13 November 2026, and it makes no investment call.
| Item | Figure | Period | Source named on the page |
|---|---|---|---|
| Seven-company revenue | About Rs 56,239 crore, up about 10.8% (page calculation) | Q2 FY27 | Company results per Goodreturns, Kotak Neo, Investywise, The Week |
| Seven-company net profit | Down about 24.1% as reported; about 12.5% with Sun Pharma adjusted | Q2 FY27 | Page calculation |
| Sun Pharma reported profit | Rs 1,989 crore, down 36%, after Rs 1,269 crore of exceptional charges | Reported 30 Oct 2026 | Goodreturns |
| Indian pharma market | Value up 13.5%, volume up about 3% | September 2026 | Pharmarack, via BioSpectrum, 15 Oct 2026 |
| EBITDA margin | Lower at five of six companies with a year-ago figure; Divi’s rose to 42.6% from 32.7% | Q2 FY27 | Goodreturns, Kotak Neo, Investywise |
Cite this table: Pharma sector outlook figures, PositionalCalls, Friday, 20 November 2026, 8:20 PM IST, per the sources named in the table.
Why did pharma profit fall when sales rose?
The largest single reason on the page is one company. Sun Pharma took Rs 1,269 crore of exceptional charges, which pulled its reported profit down 36%. When the page replaces Sun’s reported figure with an adjusted one, the seven-company profit fall narrows from about 24.1% to about 12.5%. That is the page’s own calculation, and it shows how much one line can change a sector headline. Even after the adjustment, profit still fell while sales rose, and EBITDA margin was lower at five of the six companies that had a year-ago figure to compare.
What risks does the pharma page list?
The page names US generic price erosion, illustrated by lower lenalidomide sales at Dr Reddy’s, and regulatory action, with a Zydus site flagged after USFDA observations. It also lists currency, since a stronger rupee would cut export realisations, input costs, with Lupin’s staff costs up 28.8%, and delayed specialty launches. A 100% US Section 232 tariff on patented drugs was reported on 29 September 2026, and sources disagree on whether generics are covered. Generic semaglutide launched in India on 21 March 2026 at monthly prices of about Rs 1,290 to Rs 8,000, against Rs 8,800 for Novo Nordisk’s Ozempic, per ThePrint.
Jewellery sector outlook India: price-led growth, not volume-led
The jewellery outlook is mixed: gold jewellery demand fell in tonnes while prices rose, but branded chains grew revenue. This sector outlook India page puts it in one line: growth is price-led, not volume-led. It names no stock to buy.
| Item | Figure | Period | Source named on the page |
|---|---|---|---|
| India jewellery demand | 99.9 tonnes, down 20%; value Rs 1,48,700 crore, up 16% | Jul-Sep 2026 | World Gold Council via DT Next, 3 Nov 2026 |
| Average local gold price | Rs 1,48,891 per 10 grams, up 45% on a year earlier | Jul-Sep 2026 | World Gold Council via DT Next |
| Gold and silver import duty | Raised from 6% to 15% | 13 May 2026 | Business Today |
| Official bullion imports | 64 tonnes, down 70% | Jul-Sep 2026 | World Gold Council |
| Titan jewellery revenue | Rs 17,495 crore, up 24% | Q2 FY27 | Kotak Neo, 6 Nov 2026 |
| Kalyan Jewellers revenue | Rs 9,007 crore, up 32% | Q2 FY27 | Investywise, 10 Nov 2026 |
Cite this table: Jewellery sector outlook figures, PositionalCalls, Friday, 20 November 2026, 8:20 PM IST, per the sources named in the table.
How can demand fall 20% while chain revenue rises 24% to 32%?
Because the two measures count different things. The World Gold Council figure is tonnes of gold jewellery bought across India, and it fell 20% as the local price rose about 45%. Chain revenue is rupees, so a higher price lifts revenue even when fewer grams are sold, and organised chains can also gain share from smaller jewellers. The value of India’s jewellery demand still rose 16%, which fits that reading. It is my reading of the figures, not a statement from the sources.
What one-off items does the jewellery page flag?
Titan’s domestic jewellery EBIT margin was 14.3% as reported, but 11.1% excluding a Rs 490 crore one-time duty benefit, per Multibagg on 5 November 2026. That is a gap of 3.2 percentage points, so the reported margin is a poor guide to the underlying one. The page also lists further policy curbs, smuggling, with the World Gold Council estimating about 50 tonnes of unofficial inflows in the quarter, a weak rural economy after a poor monsoon, and September sales that unnamed industry sources put 8% to 10% lower on a year earlier.
New-age tech sector outlook India: six of eight made a profit
Six of the eight new-age tech stocks covered reported a Q2 FY27 profit, and quick commerce spending explains most of the gap between them. This sector outlook India page is a data review from secondary reports, not company filings, and it gives no buy, sell or rating call.
| Item | Figure | Period | Source named on the page |
|---|---|---|---|
| Groww net profit | Rs 725.65 crore, up 54.0% | Quarter ended 30 Sep 2026 | JM Financial, CNBC-TV18 |
| Swiggy net loss | Rs 922 crore | Quarter ended 30 Sep 2026 | Inc42, Kotak Neo |
| Instamart adjusted EBITDA | Loss of Rs 895 crore | Quarter ended 30 Sep 2026 | Inc42, StartupFeed |
| Blinkit adjusted EBITDA | Rs 184 crore | Quarter ended 30 Sep 2026 | Eternal shareholder letter via StartupFeed |
| Eternal cash | Rs 16,475 crore, down Rs 1,813 crore in the quarter | End of Sep 2026 | Investywise, Inc42 |
Cite this table: New-age tech sector outlook figures, PositionalCalls, Friday, 20 November 2026, 8:20 PM IST, per the sources named in the table.
What does the new-age tech page say about cash burn?
The page treats cash, not reported profit, as the main test. Instamart’s Rs 895 crore adjusted EBITDA loss and a Rs 705 crore fall in Swiggy’s cash show what it costs to compete with Blinkit, whose store network is about 2.2 times Instamart’s. Eternal’s cash fell by Rs 1,813 crore in the quarter even though Blinkit earned a positive adjusted EBITDA. A profit figure can hide that, which is why the page reports both lines side by side.
PositionalCalls WhatsApp channel
Follow sector pages in one place
- New sector outlooks as they are posted
- Results summaries without tips
- A message when a page is updated
What caveats does the new-age tech page carry?
The figures come from secondary reports, and the page says so. It cites a third-party summary that promoter shares are locked until 9 June 2027 and did not re-check it. It also says equity derivatives rule pressure continues in Q2 FY27, which affects Groww’s trading volumes, and that Eternal’s post-results share move is unconfirmed, since the share prices it cites predate the results. Those are the kinds of limits a data note exists to state.
Defence sector outlook India: strong on demand, unproven on delivery
The defence outlook says demand is strong and delivery is the test: the Budget gave defence Rs 7.85 lakh crore, yet profit fell at three of six companies in Q2 FY27. The Defence Acquisition Council cleared about Rs 2.12 lakh crore of proposals on 26 October 2026, per the Ministry of Defence. That is the case the defence page makes in the sector outlook India series.
| Company | Q2 FY27 revenue change | Q2 FY27 profit change |
|---|---|---|
| BEL | +26.5% | +19.8% |
| HAL | +14.9% | +16.0% |
| GRSE | +9% | +12.0% |
| Bharat Dynamics | +45.1% | -15.0% |
| Cochin Shipyard | +12% | -50.0% |
| Mazagon Dock | -16.5% | -53.8% |
Cite this table: Defence company results, Q2 FY27, change on a year earlier, PositionalCalls, Friday, 20 November 2026, 8:20 PM IST, as shown on the defence outlook page; the Mazagon Dock changes are that page’s own calculation.
What does the defence page say about orders and delivery?
The budget is large: Rs 7.85 lakh crore for 2026-27, up 15.19%, with Rs 2.19 lakh crore of capital outlay up 21.84%, per the Press Information Bureau. Defence exports were Rs 38,424 crore in FY26, up 62.66%, per the Ministry of Defence. But BEL’s order book of Rs 68,717 crore on 1 October 2026 was down about 7.7% in a year by my calculation, and HAL’s order book is about 7.7 times its FY26 revenue. Orders become revenue and profit only when equipment is delivered and accepted, so the page argues that delivery, margins and supply chains decide the next two years, not demand.
What do the sector outlook India pages have in common?
In all four pages the top line looked healthier than the bottom line, and a single one-off item or spending line explained much of the gap. The table sets the pages side by side, and the last column is my reading, not a quote from a source.
| Sector | Top-line signal | Profit or volume signal | What explains the gap |
|---|---|---|---|
| Pharma | Revenue +10.8% | Profit -24.1% as reported, -12.5% adjusted | One-time charges at Sun Pharma; lower margins at five of six |
| Jewellery | Value +16%; Titan jewellery revenue +24% | Tonnes -20%; Titan margin 14.3% reported, 11.1% adjusted | Gold price up 45%; a Rs 490 crore duty benefit |
| New-age tech | Six of eight platforms profitable | Swiggy loss Rs 922 crore; Instamart adjusted EBITDA loss Rs 895 crore | Quick commerce spending |
| Defence | Revenue up at five of six companies | Profit down at three of six | Delivery, margins and supply chains |
Cite this table: Cross-sector comparison, PositionalCalls, Friday, 20 November 2026, 8:20 PM IST, built from the four pages above; last column is the author’s reading.
Three habits follow from that pattern, and they apply to any sector outlook India page, including mine. First, ask whether a profit number is reported or adjusted, and by how much. Second, ask whether growth is in price or in volume, because the two carry different risks. Third, ask whether the headline measures sales, orders or cash, since a sector can look strong on one and weak on another. The pages are built to answer those three questions in their tables, and the conflicts section below shows where the answers differ by source.
Where do the sector outlook India sources disagree?
Six conflicts are recorded across the four pages, and each page says which version it uses. The table collects them so you can see how often a headline number in the sector outlook India pages depends on a choice of source.
| Item | Version A | Version B | How the page handles it |
|---|---|---|---|
| Defence capital outlay | Rs 2.19 lakh crore, up 21.84% (PIB, Ministry of Defence, Business Today) | Rs 2.31 lakh crore, up 20.1% (Motilal Oswal note, 1 Feb 2026) | Uses the official figure; did not open the Budget document |
| Mazagon Dock order book | Rs 16,443 crore, possibly standalone | Expected to exceed Rs 1 trillion | Leaves the larger figure out of its order-book cover table |
| Pharma profit change | Down about 24.1% as reported | Down about 12.5% with Sun Pharma adjusted | Shows both; the adjusted figure is the page’s own calculation |
| US tariff on generics | 100% Section 232 tariff on patented drugs | Sources disagree on whether generics are covered | Records the disagreement and the risk of a later review |
| Titan jewellery margin | 14.3% EBIT as reported | 11.1% excluding a Rs 490 crore duty benefit | Shows both and flags the one-off |
| New-age promoter lock-in | Locked until 9 June 2027, per a third-party summary | Not confirmed against a filing | States that the page did not re-check it |
Cite this table: Source conflicts across four sector pages, PositionalCalls, Friday, 20 November 2026, 8:20 PM IST, as recorded on each page.
Most of these conflicts are not errors. They come from different definitions, such as standalone against consolidated, reported against adjusted, or two dates for the same effective rule. A few come from a source that I could not check against the original, and the pages say so. When you see a conflict box on a page, read it before the headline, because it tells you how much weight the headline can bear.
What should you check on the other sector outlook India pages?
For the eight sectors of the sector outlook India set not summarised above, the table gives the variables that usually move the sector and what to check on the page. These are general sector drivers and official source types, not conclusions from any page, so they hold whichever date a page carries.
| Sector | Variables that usually move it | Where the data comes from | What to check on the page |
|---|---|---|---|
| Banking | Credit growth, net interest margin, gross NPA, capital ratios | RBI data, bank results, exchange filings | Whether margin is moving in the same direction as the repo rate path |
| IT | Deal wins, constant-currency growth, margins, attrition | Company results and investor presentations | Constant-currency growth, not rupee growth |
| Auto | Monthly dispatches, registrations, input costs, rural demand | Company monthly volumes, Vahan registrations | Dispatches against registrations, since stock can build at dealers |
| Energy and PSUs | Crude and gas prices, refining and marketing margins, dividends | Company results, PPAC data | Whether profit came from margin or from inventory gains |
| Infrastructure | Government capex, order inflow, execution pace, working capital | Budget documents, company order announcements | Order inflow against order book and the pace of execution |
| Consumption | Volume growth, inflation, rural demand, margins | Company results, CPI data from MoSPI | Volume growth separated from price growth |
| Metals | Steel and metal prices, imports, input costs, demand | Ministry of Steel, company results | Realisation per tonne against cost per tonne |
| Real estate | Home loan rates, pre-sales, prices, unsold inventory | Developer results, RBI repo rate | Pre-sales, since reported revenue lags |
Cite this table: Reading checklist for eight sector pages, PositionalCalls, Friday, 20 November 2026, 8:20 PM IST, general sector drivers, not page conclusions.
Before you rely on any of these pages, open its Updated line and the data note. If the date is before the latest results season, treat the page as background and the company results page as the current layer. The earnings pages in the index above are rebuilt after each results season for exactly that reason. A sector outlook India page is only as current as its last update, and the date is always on the page.
How should you read a sector outlook India page?
Read the quick answer, then the table of source conflicts, then the risks, and check the data note for the date of each figure. That order shows the view, the doubt and the limit of the data, in that sequence.
- Open the outlook page and read the quick answer for the sector view.
- Check the Updated line and the data note, since figures differ in date.
- Read where sources disagree before trusting a single number.
- Open the companion earnings page for the company numbers.
- Open the exchange filing or official release for any figure you will rely on.
What is a five-question test for any sector outlook India page?
The test works for pages from any publisher. A page that cannot answer these questions is giving you an opinion, not evidence.
| Question | Where to look | What a weak answer looks like |
|---|---|---|
| What is the sector view in one sentence? | Quick answer | Vague words with no figure or date |
| Which figures and dates support it? | Glance cards and tables | Numbers with no period or source |
| Where do the sources disagree? | Conflict boxes | No mention that sources differ |
| What would make the view wrong? | Risks section | Generic risks that fit any sector |
| What did the author not check? | Data note | No limits stated at all |
Cite this table: Five-question test for sector pages, PositionalCalls, Friday, 20 November 2026, 8:20 PM IST.
Why does the sector outlook India section avoid picks?
Because PositionalCalls is not a SEBI-registered research analyst or investment adviser. The sector outlook India pages are written to show evidence, so a reader can reach a view without a target on the page. Where a source quotes a brokerage target, the page either leaves it out or says it is that source’s opinion. Most sector lists published at the start of the year pair a sector with a list of stocks to buy. This section does the opposite: it shows the data and the doubt, and leaves the decision with the reader.
What other pages sit beside the sector outlook India pages?
The results scorecard and the bank-stock pages give the company layer under the sector view.
- All Q2 FY27 results in one view: Q2 FY27 results scorecard
- Bank stock data: best bank stocks in India and PSU bank stocks in India
- Insurance stock data: best insurance stocks in India
- Dates: earnings calendar
- The category archive of every sector post: sector outlook archive
Sources for the sector outlook India hub
Every figure in the four sector sections comes from the live PositionalCalls page named below, read on 20 November 2026, and from the third-party sources those pages name. I did not open the original filings, reports or Budget documents for this hub, so use the links on each page to go to the primary source.
- PositionalCalls: Pharma sector outlook 2026 (sources: Goodreturns, Kotak Neo, Investywise, The Week, Pharmarack via BioSpectrum, ThePrint, India Briefing)
- PositionalCalls: Jewellery sector outlook 2026 (sources: World Gold Council via DT Next, Business Today, Kotak Neo, Multibagg, Investywise)
- PositionalCalls: New-age tech stocks sector outlook 2026 (sources: JM Financial, CNBC-TV18, Inc42, Kotak Neo, StartupFeed, Investywise)
- PositionalCalls: Defence sector outlook 2026 (sources: Press Information Bureau, Ministry of Defence, Business Today, Motilal Oswal note of 1 February 2026)
Where the pages cite a source by name only, the name is given in the tables above so you can find it. If any figure differs from the live page, the live page governs, because it carries the current Updated line.
PositionalCalls WhatsApp channel
Keep sector updates together
- Quarterly result summaries
- Budget and policy changes
- Links to new sector pages
Sector outlook India: frequently asked questions
What is the sector outlook India hub on PositionalCalls?
It is the index to twelve sector pages, each tested against dated company results, official data and risks, with sources listed and no stock picks. The hub also shows what four recent pages found, records where sources disagree and explains how to read a sector page before you rely on any figure in it.
Which sectors does the sector outlook India hub cover?
Twelve: banking, IT, pharma, auto, energy PSUs, infrastructure, consumption, jewellery, metals, real estate, new-age tech and defence. Eight of them have companion earnings or company result pages. Insurance has no outlook page, but two stock-data pages cover it, and both are linked in the related pages section of this hub.
Does the sector outlook India section recommend stocks?
No. PositionalCalls is not a SEBI-registered research analyst or investment adviser. The pages report company and government figures with sources, label my own arithmetic, and record where sources disagree. Where a source quotes a brokerage target, the page leaves it out or names it as that source’s opinion. Nothing here is a target, rating or recommendation.
What did the pharma sector outlook find for Q2 FY27?
Across seven large companies, Q2 FY27 revenue rose about 10.8% to about Rs 56,239 crore, while net profit fell about 24.1% as reported. Excluding Sun Pharma’s one-time charges, the page’s own calculation puts the profit fall at about 12.5%. The page makes no investment call and lists US tariffs and price erosion as risks.
What did the jewellery sector outlook find?
Growth was price-led, not volume-led. India’s jewellery demand fell 20% to 99.9 tonnes in July to September 2026, while its value rose 16% to Rs 1,48,700 crore, per the World Gold Council as relayed by DT Next. Branded chains such as Titan and Kalyan still grew revenue by 24% and 32% in Q2 FY27.
What did the defence sector outlook find?
Demand is strong and delivery is unproven. The 2026-27 Budget gave defence Rs 7.85 lakh crore and the Defence Acquisition Council cleared about Rs 2.12 lakh crore on 26 October 2026. In Q2 FY27, profit fell at Bharat Dynamics, Mazagon Dock and Cochin Shipyard, while HAL and BEL grew. The page makes no stock call.
Why do sector outlook India pages show source conflicts?
Because sources often give different numbers for the same item, such as a budget line, an order book or a margin. Each page records both versions in a conflict box, says which one it uses and why, and states what the author did not open. A conflict you can see is safer than a single number that hides the doubt.
How often is the sector outlook India hub updated?
When a sector outlook is added or materially updated, and after each results season. Every individual page carries its own Updated line and a data note giving the date of its figures, so check that line first. Where a page was last edited before the latest results, treat its numbers as older data and open the sources it lists.
How should I read a sector outlook India page?
Read the quick answer, then the table of source conflicts, then the risks, then the data note, which gives the date of each figure. Open the companion earnings page for company numbers and the exchange filing for any figure you will rely on. The five-question test in this hub shows what a weak answer looks like.
Is this sector outlook India hub investment advice?
No. It is an index and a reading guide. PositionalCalls is not SEBI-registered, and nothing here is a target, rating or a buy or sell call. The figures are quoted from the pages and sources named, with dates, and may have changed since. Open the individual pages and the original filings before you decide anything.

Shubham Chaudhary is the founder of PositionalCalls, an independent Indian stock market research website. He writes company fundamentals, quarterly results analysis, IPO analysis and sector research for NSE and BSE listed companies, with a focus on banking stocks, insurance and long-term value investing. Every article is built from primary sources such as RBI, SEBI, NSE and BSE filings and company annual reports, and states its risks plainly in simple language for retail investors.
Coverage areas Our research standards- Numbers checked against NSE, BSE and SEBI filings
- Risks and limits stated in every article
- No paid promotions or broker tie-ups
- Articles updated when new filings arrive