
Earnings · Energy · Reliance Industries
Reliance reported a record September quarter on Friday, 30 October 2026. Profit rose 40.6%, but one business did most of the work while Retail profit fell 24%. Here are the clean numbers, the three profit figures and the lines to watch in the December quarter.
Quick answer
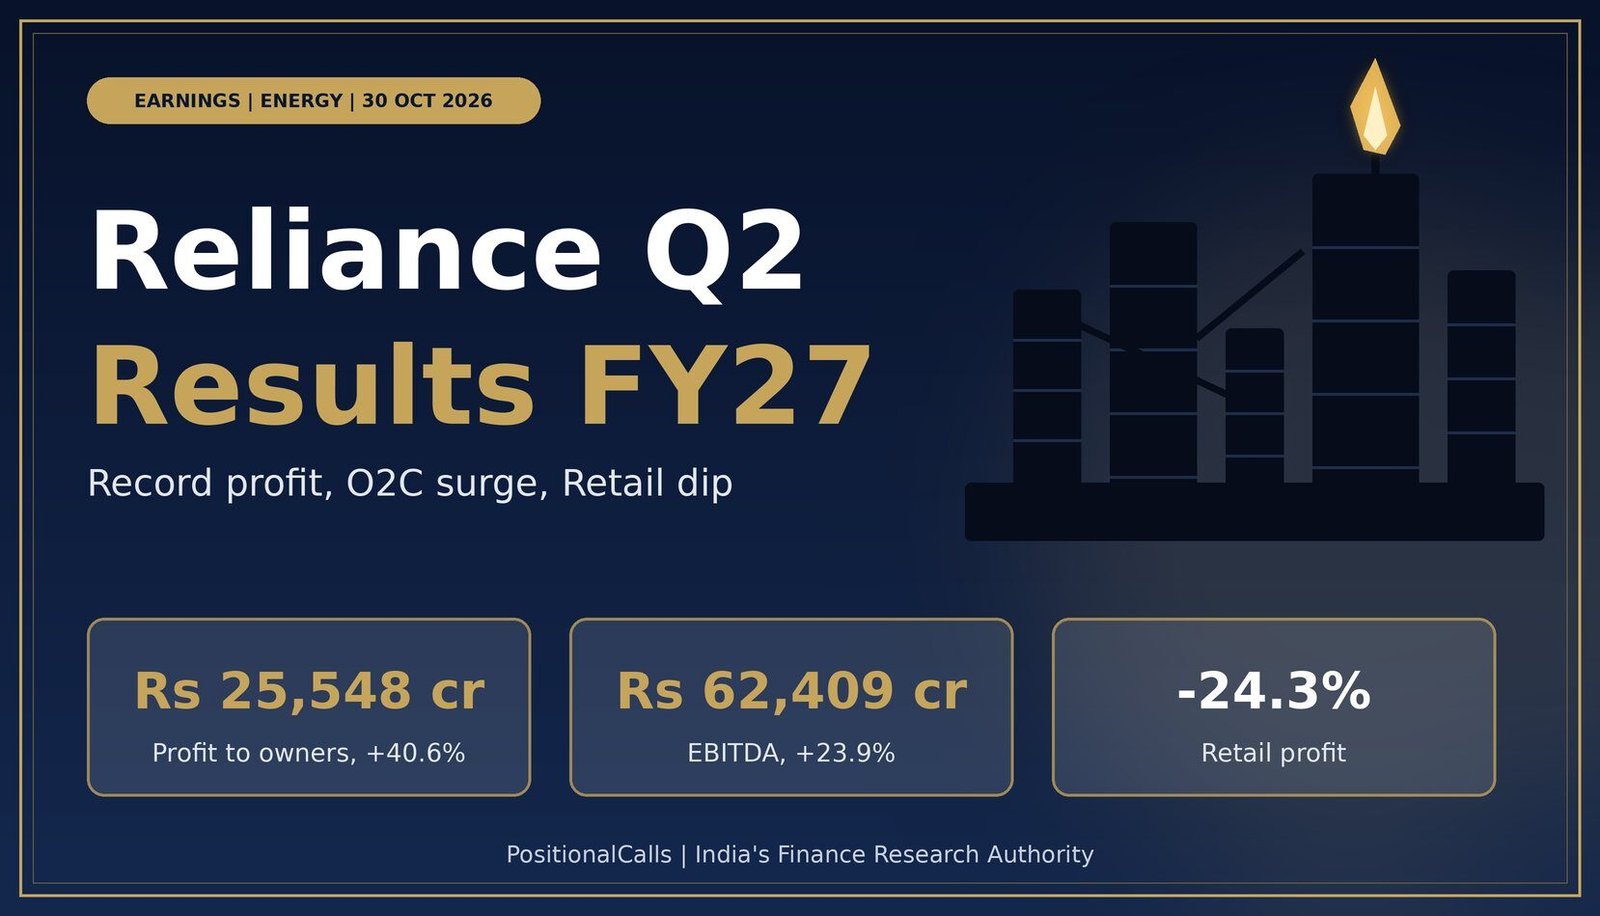
Reliance Q2 results FY27, reported on Friday, 30 October 2026, showed profit attributable to owners of Rs 25,548 crore, up 40.6%, and total profit after tax of Rs 29,550 crore, up 33.8%. EBITDA rose 23.9% to Rs 62,409 crore, led by O2C, while Retail profit fell 24.3%, as of 1 November 2026. Shares rose as much as about 6% in early trade on 2 November 2026.
Latest update (Monday, 2 November 2026, 10:00 AM IST): Reliance shares rose as much as about 6% in early trade on the first session after the results; the section on the share-price reaction below has the details and the broker estimate changes. The Q2 FY27 numbers are unchanged. They come from the investor-presentation summary as carried by news sites; I did not open Reliance’s own filing, so check the exchange filing. The day’s closing price is not covered yet.
Earlier entries:
- Sunday, 1 November 2026, 9:00 AM IST: The page was rebuilt with the reported Q2 FY27 numbers, replacing the preview.
- Friday, 30 October 2026: Reliance reported its Q2 FY27 results.
Key takeaways
- Profit: owners’ profit Rs 25,548 crore (+40.6%); total PAT Rs 29,550 crore (+33.8%).
- EBITDA: Rs 62,409 crore, up 23.9%, but margin on gross revenue slipped to 17.2% from 17.8%.
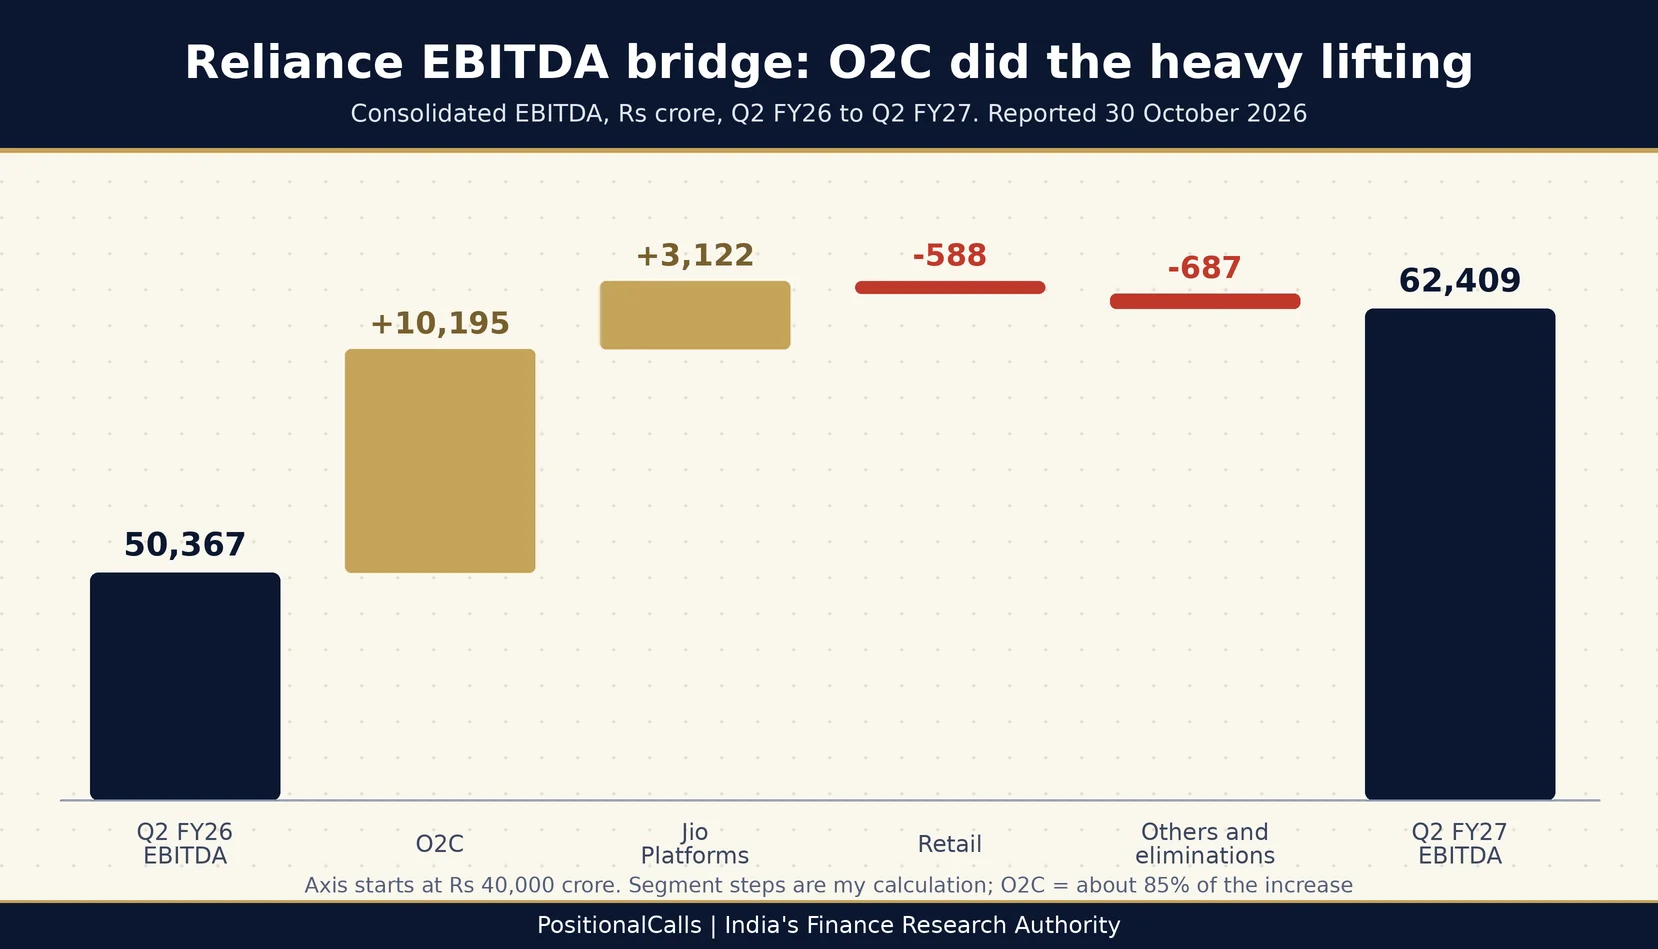
- O2C: EBITDA Rs 25,203 crore, up 67.9%, about 85% of the group’s EBITDA increase (my calculation).
- Retail: profit Rs 2,611 crore, down 24.3%; EBITDA before impairment down 8.6%.
- Shares: up as much as about 6% in early trade on Monday, 2 November 2026 (Upstox, Business Standard); close not covered.
- Debt: net debt Rs 1,17,140 crore, 0.47x annualised EBITDA, before any Jio IPO proceeds.
In plain words: Reliance owns a refining and chemicals business, India’s largest mobile network, the largest retailer and a media arm. This page shows what each reported, why the headline profit differs from page to page, and which parts of the growth may not repeat.
Data note: as of Monday, 2 November 2026, 10:00 AM IST. Q2 FY27 figures come from the investor-presentation summary as carried by NiftyTrader and Investing.com; Q2 FY26 comparatives are as restated in that coverage. The share-price and broker lines come from Upstox (updated 9:46 AM IST) and Business Standard on 2 November 2026. I did not open the filing or the press release. Estimates come from one broker preview. Derived numbers are my calculation.
What did Reliance report for Q2 FY27?
A record quarter on the headline: EBITDA of Rs 62,409 crore, gross revenue of Rs 3,62,268 crore and total profit after tax of Rs 29,550 crore.
The board met on Friday, 30 October 2026 under an exchange filing dated 27 October, with an analyst meet after the meeting. The same agenda covered a private-placement proposal for non-convertible debentures (NCDs); I did not find the amount. The results came two days after the Jio Platforms listing on 28 October 2026.
| Consolidated, Rs crore | Q2 FY27 | Q2 FY26 | YoY | Note |
|---|---|---|---|---|
| Gross revenue | 3,62,268 | 2,83,548 | +27.8% | Record |
| Revenue from operations | 3,32,861 | 2,58,898 | +28.6% | Different measure |
| EBITDA | 62,409 | 50,367 | +23.9% | Record |
| EBITDA margin on gross revenue | 17.2% | 17.8% | -60 bps | 15.9% in Q1 FY27 |
| Profit before tax | 38,613 | 29,124 | +32.6% | |
| Finance costs | 8,481 | 6,827 | +24.2% | Tax rose 34.2% to 9,363 |
| Capital expenditure | 38,153 | 40,010 | -4.6% | Mostly O2C and new energy |
Cite this table: PositionalCalls, “PositionalCalls Reliance Q2 FY27 Results Table, as of 1 November 2026”.
Half-year total PAT including associates was Rs 52,746 crore against Rs 43,951 crore, up 20.0% (my calculation). Total PAT rose 27.4% from Rs 23,196 crore in Q1 FY27. Remember that the year-ago column for Reliance Q2 results FY27 is the September 2025 quarter, which is why the base in our earlier preview of Rs 18,165 crore applies only to owners’ profit.
Which Reliance profit number is the right one?
Use Rs 25,548 crore (owners) for per-share comparisons and Rs 29,550 crore (total PAT including associates) for the company’s headline; growth is 40.6% on one and 33.8% on the other.
| Profit definition, Rs crore | Q2 FY27 | Q2 FY26 | YoY | Q1 FY27 |
|---|---|---|---|---|
| Profit attributable to owners | 25,548 | 18,165 | +40.6% | 20,946 |
| Total PAT incl. associates and JVs | 29,550 | 22,092 | +33.8% | 23,196 |
| PAT before associates and JVs | 29,250 | 22,146 | +32.1% | Not in sources |
| Minority interest (difference, my calculation) | 4,002 | 3,927 | +1.9% | Not derived |
Cite this table: PositionalCalls, “PositionalCalls Reliance Three-Profit Definitions Table, as of 1 November 2026”.
The gap explains the headline difference. Owners’ profit grew 40.6% because minority interest barely moved (up 1.9%) while profit before minority rose 33.8%. In Q2 FY26 minority share was 17.8% of total PAT (3,927 over 22,092); in Q2 FY27 it was 13.5% (4,002 over 29,550). My calculation; I did not find the filing’s explanation.
The margin and revenue traps
- Revenue: gross revenue (Rs 3,62,268 crore) and revenue from operations (Rs 3,32,861 crore) differ by about Rs 29,407 crore. Quote one consistently.
- EBITDA margin: 17.2% is on gross revenue. On revenue from operations my calculation gives about 18.7% against 19.5% a year earlier. Q2 FY26 pages that showed 19.4% used net sales.
- Q1 FY27 profit: Rs 20,946 crore (owners, reported) and Rs 23,196 crore (total PAT) both appear as “Q1 profit”. Q1 FY26’s Rs 26,994 crore included a one-off Rs 8,924 crore gain from the Asian Paints stake sale.
- Retail base: Q2 FY26 retail profit now appears as Rs 3,451 crore, restated for the Consumer Brands demerger, not the Rs 3,457 crore first reported.
Did Reliance beat estimates?
Against Nuvama’s preview, EBITDA beat by about 16% and owners’ profit by about 22%, but Retail missed.
| Item (Rs crore) | Nuvama estimate | Actual | Actual vs estimate (my calculation) |
|---|---|---|---|
| Consolidated EBITDA | 53,700 | 62,409 | +16.2% |
| Profit (owners; est. +15% on 18,165) | 20,900 | 25,548 | +22.2% |
| O2C EBITDA | 20,700 | 25,203 | +21.8% |
| Revenue (basis not stated) | 2,92,437 | 3,32,861 (from operations) | +13.8%, basis may differ |
| Retail EBITDA | About -1% YoY | -8.6% YoY | Worse than estimate |
| Oil and gas EBITDA | About -6% YoY | -2% YoY | Better than estimate |
Cite this table: PositionalCalls, “PositionalCalls Reliance Q2 FY27 Actual versus Estimate Table, as of 1 November 2026”.
This is one broker, not a consensus; I did not find a Bloomberg or other consensus for the quarter. Kotak Institutional Equities had projected EBITDA growth of about 15% on the year and 11.1% on the quarter; reported EBITDA grew 23.9% and 15.4% (62,409 over 54,067, my calculation). Estimates compiled before the results often used different profit bases, so compare like with like before calling a beat.
O2C: why EBITDA jumped 68%
In Reliance Q2 results FY27, O2C EBITDA of Rs 25,203 crore was up 67.9% and supplied about 85% of the group’s EBITDA increase; without that rise group EBITDA would have grown about 3.7%.
| O2C, Rs crore | Q2 FY27 | Q2 FY26 | YoY |
|---|---|---|---|
| Revenue | 2,31,601 | 1,60,558 | +44.2% |
| Exports | 1,04,250 | 70,955 | +46.9% |
| EBITDA | 25,203 | 15,008 | +67.9% |
| EBITDA margin | 10.9% | 9.3% | +160 bps |
Cite this table: PositionalCalls, “PositionalCalls Reliance O2C Table, as of 1 November 2026”.
My calculation: O2C EBITDA rose Rs 10,195 crore while group EBITDA rose Rs 12,042 crore, so O2C supplied 84.7% of the increase. If O2C had stayed at Rs 15,008 crore, group EBITDA would have been about Rs 52,214 crore, up 3.7% on the year. O2C was 40.4% of group EBITDA against 29.8% a year earlier.
Reliance attributed the jump to crude prices up 40.6% after Middle East disruption, transportation fuel cracks of three to 3.7 times last year at historic highs, product prices up 50% to 78% for fuels and 25% to 35% for most chemicals, and a polyester chain margin at a three-year high. It also cited higher crude premiums, freight, special additional excise duty costs and domestic fuel retail under-recoveries. Management said the first half tracks an annualised O2C EBITDA above Rs 80,000 crore. These conditions are unusual, so treat the quarter as peak-like rather than a new run-rate. A 31 October 2026 report headline says the petrol export duty was scrapped and the diesel levy raised to Rs 11.50; I did not read the notification, so check its effect on O2C.
PositionalCalls WhatsApp channel
Get the Reliance filing check and reaction update
- A note when this page is checked against the filing
- The O2C, Retail and profit-definition lines we track
- Links to Jio and the next Reliance result
Jio Platforms: ARPU, margins and the listing
In Reliance Q2 results FY27, Jio Platforms grew revenue 11.3%, EBITDA 16.6% and profit 13.7%, with ARPU of Rs 218.80, but finance costs rose 40.3%.
| Jio Platforms, Rs crore | Q2 FY27 | Q2 FY26 | YoY |
|---|---|---|---|
| Gross revenue | 47,485 | 42,652 | +11.3% |
| Revenue from operations | 40,475 | 36,332 | +11.4% |
| EBITDA | 21,879 | 18,757 | +16.6% |
| EBITDA margin | 54.1% | 51.6% | +250 bps |
| Profit after tax | 8,387 | 7,379 | +13.7% |
| Monthly ARPU (Rs) | 218.80 | 211.40 | +3.5% |
Cite this table: PositionalCalls, “PositionalCalls Jio Platforms Q2 FY27 Table, as of 1 November 2026”.
Customers reached 542.4 million (506.4 million a year earlier), with 9.1 million net additions, churn steady at 1.6%, 300 million 5G subscribers and over 30 million fixed broadband customers. Data use per customer rose to 44.2 GB from 38.7 GB. Profit growth trailed EBITDA growth because depreciation rose 14% to Rs 7,611 crore and finance costs rose 40.3% to Rs 3,009 crore, partly from capitalising 5G assets in March 2026.
The listing on 28 October 2026 came after the quarter ended, so the IPO’s fresh-issue money (reported as Rs 30,213 crore, and Rs 30,188 crore in one report) is not in these accounts. Read our Jio Platforms Q2 results page and the listing guide for the listed entity’s own view. For another telecom comparison see Airtel Q2 FY27 results.
Reliance Retail: why profit fell 24%
In Reliance Q2 results FY27, Retail revenue grew 6.4% but profit fell 24.3% to Rs 2,611 crore as the festive calendar moved into the December quarter and costs rose.
| Reliance Retail, Rs crore | Q2 FY27 | Q2 FY26 (restated) | YoY |
|---|---|---|---|
| Gross revenue | 91,716 | 86,169 | +6.4% |
| Revenue from operations | 80,220 | 75,836 | +5.8% |
| EBITDA before impairment | 6,228 | 6,816 | -8.6% |
| EBITDA margin | 7.8% | 9.0% | -120 bps |
| PAT incl. associates and JVs | 2,611 | 3,451 | -24.3% |
Cite this table: PositionalCalls, “PositionalCalls Reliance Retail Q2 FY27 Table, as of 1 November 2026”.
The investor presentation notes that Navratri fell on 11 October and Diwali on 8 November in 2026, against 22 September and 20 October a year earlier. That moves the main festive selling into Q3 FY27, so Q2 had little festive activity. The company also cited digital commerce investment and input-cost inflation it absorbed for customers. A one-time impairment charge sits below the EBITDA line; I did not find its amount.
Other marks: 303 stores opened and the network stood at 19,947 stores with 77.5 million square feet; customer transactions grew 7%; JioMart revenue grew 42% and digital commerce share of B2C grocery rose 270 bps; consumer electronics grew 8% like for like and fashion 3%. Depreciation rose 18.1% to Rs 1,820 crore and finance costs rose 53.9% to Rs 905 crore. For the quick-commerce rival, see our Eternal Q2 FY27 results.
JioStar and oil and gas
JioStar’s profit fell 13.2% to Rs 1,147 crore and oil and gas EBITDA fell 2% on lower KG-D6 output.
| Segment, Rs crore | Q2 FY27 | YoY | Note |
|---|---|---|---|
| JioStar revenue from operations | 6,806 | +10.1% | JioHotstar about 440 million monthly users, +10% |
| JioStar EBITDA from operations | 1,372 | -10.5% | Total EBITDA 1,502, -13.6% |
| JioStar profit after tax | 1,147 | -13.2% | |
| Oil and gas revenue | 6,020 | -0.6% | KG-D6 gas Rs 8.88 per MMBtu vs 9.97 |
| Oil and gas EBITDA | 4,901 | -2.0% | Margin 81.4%; CBM price $13.24 |
Cite this table: PositionalCalls, “PositionalCalls Reliance Other Segments Table, as of 1 November 2026”.
KG-D6 produced about 24 million standard cubic metres of gas a day and about 15,903 barrels a day of oil and condensate. Higher CBM prices and volumes partly offset the fall.
Net debt, cash and capex
At the end of Reliance Q2 results FY27 quarter, net debt was Rs 1,17,140 crore, down slightly from Rs 1,18,545 crore, because cash rose as fast as borrowings.
| Rs crore | September 2026 | September 2025 | Change (my calculation) |
|---|---|---|---|
| Cash and equivalents | 2,67,812 | 2,29,685 | +38,127 |
| Outstanding debt | 3,84,952 | 3,48,230 | +36,722 |
| Net debt | 1,17,140 | 1,18,545 | -1,405 |
| Net debt to annualised EBITDA | 0.47x | 0.59x (0.57x in one report) |
Cite this table: PositionalCalls, “PositionalCalls Reliance Balance Sheet Table, as of 1 November 2026”.
The Jio IPO closed on 23 October and listed on 28 October, so its proceeds fall in the December quarter. The company’s reported plan was to use much of the fresh issue to prepay Jio Infocomm borrowings, which would lower interest costs later. Capex of Rs 38,153 crore went mainly to O2C and new energy projects. Gross debt rising Rs 36,722 crore while net debt fell shows large borrowings held as cash; watch finance costs, which rose 24.2%.
After the Reliance Q2 results FY27, the shares rose as much as about 6% in early trade on Monday, 2 November 2026; the day’s close is not covered here.
Upstox, in a report updated at 9:46 AM IST, said the stock rose as much as 6.21% on the NSE to a high of Rs 1,237.30. Business Standard put the BSE high at about Rs 1,234, up about 6%. The two prices differ by exchange and timing, and neither report gave an opening gain or a close. A reaction in early trade shows what the market expected, not a view on the quarter.
| Source | What it changed or said (estimates only) | Reported by |
|---|---|---|
| Jefferies | Raised FY27 and FY28 EBITDA estimates by 6% and 2%; said Q2 consolidated EBITDA beat its estimate by 6%, led by O2C, and retail EBITDA was 6% below its estimate | Upstox; Business Standard |
| Emkay Global | Raised FY27, FY28 and FY29 EPS estimates by 15%, 8% and 3% | Business Standard |
| Dolat Capital | Raised its FY27 profit estimate by 6.2% | Business Standard |
| Nomura | Changed FY27 and FY28 EBITDA estimates by +2% and -5%, with higher O2C and lower Retail forecasts | Business Standard |
| Kotak Institutional Equities | Said a Retail recovery depends on festive demand and returns from digital-commerce investments | Upstox |
Cite this table: PositionalCalls, “PositionalCalls Reliance Broker Estimate Changes Table, as of 2 November 2026”.
Several brokerages also changed price targets and ratings. This page does not report them, because they are opinions that can change within days and PositionalCalls gives no target or recommendation. Business Standard’s headline says brokerages pared targets even as earnings estimates rose; my reading is that the cuts reflect lower valuation multiples and weaker Retail, not lower expected earnings for the quarter.
Two figures that differ in the coverage
- EBITDA: Upstox cites Jefferies using consolidated EBITDA of Rs 56,616 crore, while the headline figure on this page is Rs 62,409 crore. The bases differ, and the reports do not explain the gap, so open the filing before you compare them.
- Retail: Business Standard reports Retail revenue up 1% and EBITDA down 10%, while this page uses revenue up 5.8% and EBITDA before impairment down 8.6%. The basis of the Business Standard figures is not stated.
What comes next?
After Reliance Q2 results FY27, the December quarter carries the festive test for Retail, the first Jio quarter as a listed company and a test of whether O2C margins hold.
- O2C margins: fuel cracks were at historic highs. Any easing would show quickly.
- Retail recovery: festive sales fall in Q3 FY27. The question is margin, not only sales.
- Jio finance costs: proceeds from the IPO should lower borrowings; confirm in the filing.
- NCD fundraising: the board considered a private placement; check the terms.
- Dividend: the 30 October notice identified no dividend proposal.
- Share-price reaction: up as much as about 6% in early trade on Monday, 2 November 2026; see the section above. The close is not covered.
I did not find the Q3 FY27 results date. Track it on the results calendar hub and in our earnings coverage. Tax on any dividend follows the current rules; see our capital gains tax on shares guide.
Results-day decoder: how to check the filing
For Reliance Q2 results FY27, match each headline to its definition, then compare segment lines with the tables above.
| What to read | Mark in this analysis | Question to ask |
|---|---|---|
| Profit line | Rs 25,548 crore (owners); Rs 29,550 crore (total PAT) | Which does the headline use? |
| EBITDA and margin | Rs 62,409 crore; 17.2% on gross revenue | Gross or net revenue basis? |
| O2C EBITDA | Rs 25,203 crore | How much was cracks and inventory? |
| Retail impairment | Amount not found | What is the one-time charge? |
| Net debt | Rs 1,17,140 crore | Before IPO proceeds? |
| Minority interest | Rs 4,002 crore (my calculation) | Why did it barely rise? |
Cite this table: PositionalCalls, “PositionalCalls Reliance Filing Check Table, as of 1 November 2026”.
What most people miss
Analyst’s note
- What stands out: a 40.6% profit rise built on one business, with Retail profit down and finance costs up 24%.
- Easy to miss: minority interest rose just 1.9%, which is why owners’ profit grew faster than total PAT.
- What would change the view: O2C EBITDA below Rs 20,000 crore in a quarter, or a retail margin below 7% after the festive quarter.
- Caution: the O2C ex-increase figure is my own arithmetic, not a forecast or target. This note is reasoning from reported figures.
- Reader action: match each headline profit to the definitions above before comparing.
Bottom line
Reliance Q2 results FY27 were a record on the headline: owners’ profit Rs 25,548 crore and EBITDA Rs 62,409 crore. O2C delivered about 85% of the EBITDA increase, Jio grew steadily and Retail profit fell 24%. Read the profit definition and the O2C share before the growth percentage.
Next read: see Jio Platforms’ own Q2 results.
Part of the Earnings series.
PositionalCalls WhatsApp channel
Follow Reliance and big-cap results on WhatsApp
- Results summaries across large companies
- Base-to-beat and profit-definition tables
- A link to each update when it goes live
FAQs on Reliance Q2 results FY27
What were the Reliance Q2 results FY27?
Reliance reported on Friday, 30 October 2026 profit attributable to owners of Rs 25,548 crore (up 40.6%), total profit after tax of Rs 29,550 crore (up 33.8%), EBITDA of Rs 62,409 crore (up 23.9%) and gross revenue of Rs 3,62,268 crore (up 27.8%).
Reliance shares rose as much as about 6% in early trade on Monday, 2 November 2026. Upstox reported an NSE high of Rs 1,237.30, up 6.21%, and Business Standard reported a BSE high of about Rs 1,234. Neither report gave the closing price, and the move reflects expectations, not a forecast.
Which profit figure should I use for Reliance Q2 results FY27?
For per-share comparisons use profit attributable to owners, Rs 25,548 crore against Rs 18,165 crore. The company’s headline uses total profit after tax including associates and joint ventures, Rs 29,550 crore against Rs 22,092 crore. The growth rates differ: 40.6% and 33.8%.
When did Reliance announce its Q2 FY27 results?
The board met on Friday, 30 October 2026, under an exchange filing dated 27 October 2026, with an analyst meet after the meeting. The filings I read did not state the exact time. The board also considered a private-placement NCD proposal; I did not find the amount.
Why did Reliance’s O2C EBITDA jump 68%?
O2C EBITDA rose to Rs 25,203 crore from Rs 15,008 crore. Reliance cited sharply higher transportation fuel cracks, stronger polyester margins and crude prices up 40.6% after Middle East disruption. My calculation: O2C supplied about 85% of the group’s year-on-year EBITDA increase.
Why did Reliance Retail profit fall 24%?
Retail profit fell to Rs 2,611 crore from a restated Rs 3,451 crore. Reliance cited the festive calendar moving to the December quarter, digital commerce investment and absorbed input costs. EBITDA before a one-time impairment fell 8.6% to Rs 6,228 crore.
What was Jio’s ARPU in Q2 FY27?
Jio Platforms reported monthly ARPU of Rs 218.80 against Rs 211.40 a year earlier, up 3.5%. Its customer base was 542.4 million, with 9.1 million net additions in the quarter. Jio Platforms profit rose 13.7% to Rs 8,387 crore.
Did Reliance beat estimates in Q2 FY27?
Against the one broker preview I found, Nuvama, yes: EBITDA of Rs 62,409 crore compared with an estimate of Rs 53,700 crore, and owners’ profit of Rs 25,548 crore compared with about Rs 20,900 crore. Retail EBITDA fell more than Nuvama’s expected 1% decline.
Did the Jio IPO proceeds show in the Reliance Q2 numbers?
No. Jio Platforms listed on 28 October 2026, after the quarter ended on 30 September, so IPO proceeds are not in the September-quarter balance sheet. Net debt at 30 September 2026 was Rs 1,17,140 crore, before any proceeds.
Will Reliance declare a dividend with Q2 FY27 results?
The board notice I found for 30 October listed results and an NCD proposal and identified no dividend proposal. I did not see a dividend declaration in the results coverage. Check the company’s filing for any announcement.
Does this page give a Reliance Q2 results FY27 buy or sell call?
No. This is research and education, not advice. PositionalCalls.com is not a SEBI-registered research analyst or investment adviser. Use the numbers to frame questions and speak to a registered adviser before investing.
Sources
- Reliance Industries investor relations page: results, press release and presentation.
- NSE corporate announcements and BSE corporate announcements: the exchange filing.
- NiftyTrader, Reliance Q2 FY27 results (31 October 2026) and preview with Nuvama estimates (28 October 2026)
- Investing.com, Reliance Q2 FY27 investor-presentation summary (30 October 2026)
- Upstox, Kotak Neo and Multibagg, Reliance Q2 FY27 board meeting reports (27 to 31 October 2026)
- Upstox: Reliance shares soar 6% after Q2 earnings, 2 November 2026.
- Business Standard: RIL’s Q2 beat lifts earnings outlook, even as brokerages pare price targets, 2 November 2026.
- Business Standard, Reliance Q2 FY26 results coverage (17 and 20 October 2025)
Editorial disclosure: PositionalCalls.com is not a SEBI-registered research analyst or investment adviser. Investments in securities markets are subject to market risks. Read all related documents carefully before investing. Returns are never guaranteed. PositionalCalls.com is an independent research and education site founded by Shubham Chaudhary. This page is not investment advice, a recommendation or a price target. How I researched this: I compared the reported Q2 FY27 figures across two news summaries of the investor presentation, took the share-price and broker lines from Upstox and Business Standard on 2 November 2026, checked the year-ago base against the earlier coverage and recalculated every derived figure. I did not open the company’s filing; own calculations are labelled.

Shubham Chaudhary is the founder of PositionalCalls, an independent Indian stock market research website. He writes company fundamentals, quarterly results analysis, IPO analysis and sector research for NSE and BSE listed companies, with a focus on banking stocks, insurance and long-term value investing. Every article is built from primary sources such as RBI, SEBI, NSE and BSE filings and company annual reports, and states its risks plainly in simple language for retail investors.
Coverage areas Our research standards- Numbers checked against NSE, BSE and SEBI filings
- Risks and limits stated in every article
- No paid promotions or broker tie-ups
- Articles updated when new filings arrive