
Earnings · ITC Limited
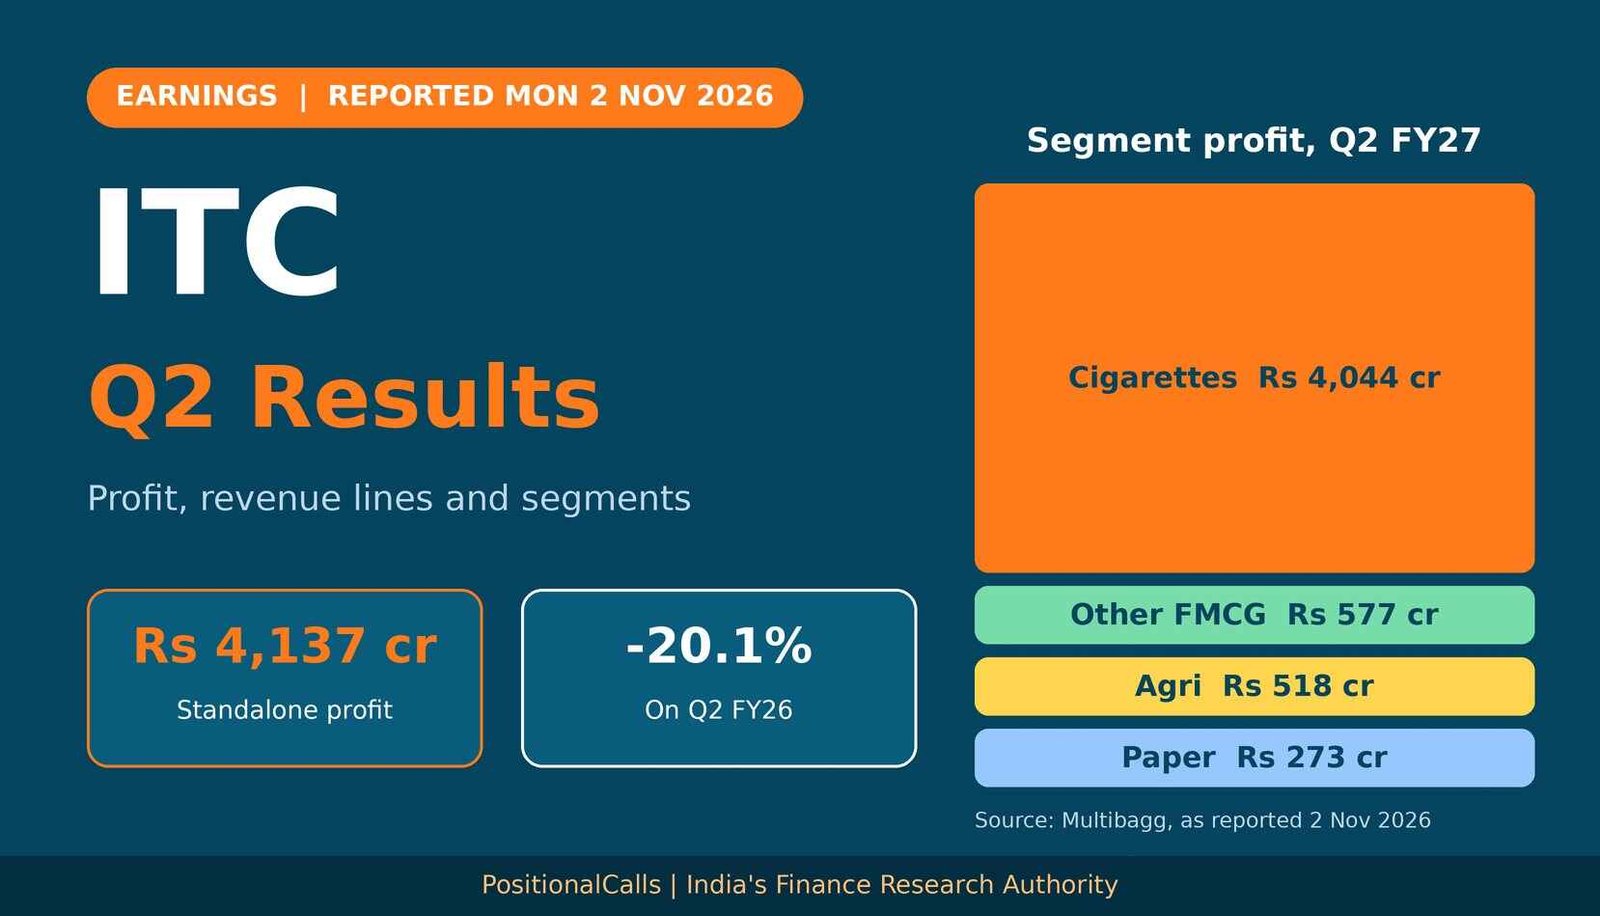
The ITC Q2 results, reported on 2 November 2026, standalone profit of Rs 4,137 crore, down 20% on the year but up 15.6% on Q1. Here are the figures, the three revenue lines, the broker marks against the actuals, the share-price reaction and what is still unconfirmed.
Quick answer
ITC Q2 results, reported on Monday, 2 November 2026, show standalone profit of Rs 4,137 crore, down 20.1% and up 15.6% on Q1. EBITDA was Rs 5,160 crore (-17%), cigarette segment profit fell 26%, and brokerages put volume down 7% to 8%. The shares closed at Rs 278.80 on 9 November, against Rs 266.40 before the results.
Latest update (Saturday, 14 November 2026, 2:30 AM IST): ITC closed at Rs 273.90 on Tuesday, 3 November, up 2.82%, and at Rs 278.80 on Monday, 9 November, down 1.64%, per 5paisa headlines; I did not find a later close. Equentis lists post-result brokerage targets from Rs 285 to Rs 390 (single source, 3 November). Business Standard reports consolidated profit attributable to owners of Rs 4,168.40 crore. I did not open the company’s filing.
Earlier entries:
- Wednesday, 4 November 2026, 1:15 PM IST: shares rose about 3% to Rs 282 in early trade and led the Nifty 50, from a pre-results close of Rs 266.40.
- Tuesday, 3 November 2026, about 1:04 PM IST: shares at Rs 268.30, up 0.71%, after reports ranged from flat to +1.5% earlier in the session.
- Monday, 2 November 2026, 10:45 PM IST: the page was converted from preview to results with the reported Q2 FY27 numbers.
- Friday, 30 October 2026, 10:00 PM IST: the preview was published with the base figures, two broker views and the date check.
Key takeaways
- Profit: standalone Rs 4,137 crore (-20.1%); consolidated Rs 4,229 crore (-18.5%).
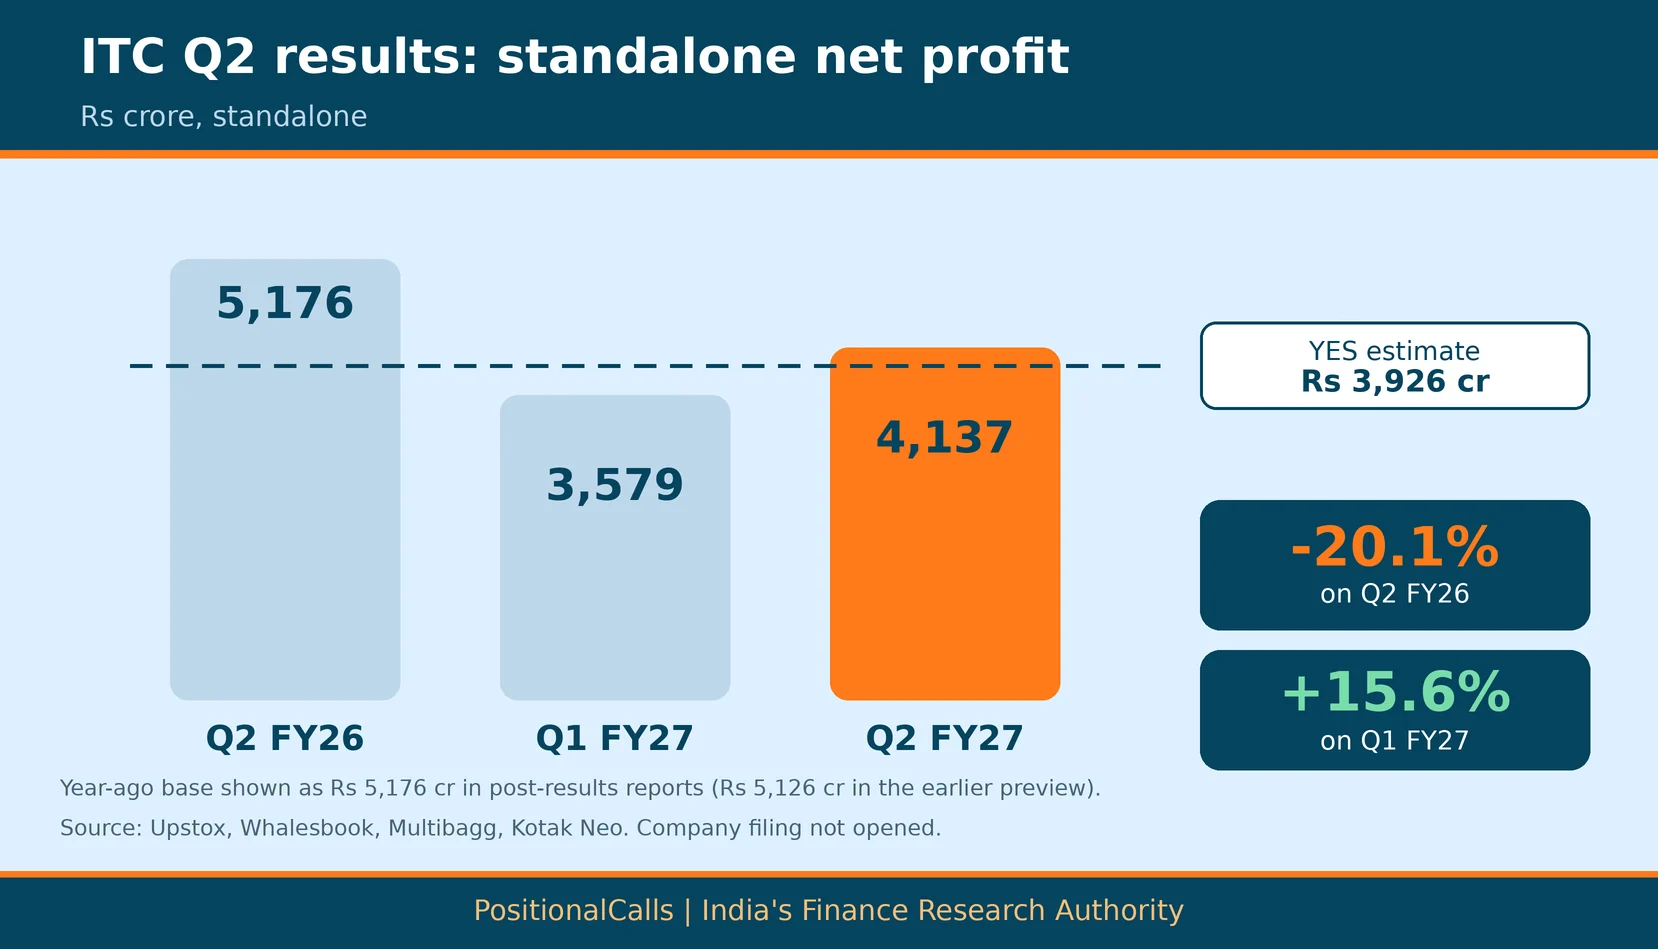
- Against Q1: standalone profit is up 15.6% on Rs 3,579 crore (my calculation).
- Against the broker view: 5.4% above YES Securities’ Rs 3,925.8 crore (my calculation); one broker is not a consensus.
- Cigarettes: segment profit down 26%; volume down about 7% to 8% per brokerages.
- Shares: Rs 273.90 close on 3 November (+2.82%) and Rs 278.80 on 9 November (-1.64%), from Rs 266.40 before the results.
- Trap: three revenue lines circulate, +43.9%, +28% and +3.9%.
In plain words: ITC earns most of its profit from cigarettes, then from packaged foods and personal care (FMCG-others), farm products (agri) and paper. Higher cigarette taxes cut that main profit pool. This page shows what ITC reported, why revenue looks so different across reports, how the shares reacted, and how the quarter compares with the marks set before the results.
Data note: Figures are as of Saturday, 14 November 2026, 2:30 AM IST. Numbers come from news reports of the results (Upstox, Whalesbook, Multibagg, The Week, Businessworld, Business Standard) and the earlier preview; I did not open the filing. Price moves come from Business Standard, Goodreturns and Moneycontrol via TradingView. Estimates come from two brokerages cited by Business Today before the results. Correction: the earlier version of this page said cigarette volume was not found and described Rs 4,168.40 crore as a consolidated figure that did not match; brokerages put volume down about 7% to 8%, and Rs 4,168.40 crore is profit attributable to owners. Derived numbers are my calculation.
What did ITC report for Q2 FY27?
This ITC Q2 results analysis starts with the headline: standalone net profit of Rs 4,137 crore, down 20.1% on the year, and EBITDA of Rs 5,160 crore, down about 17%. The cigarette segment carried the fall, while FMCG-others, agri and paper all grew.
| Measure | Q2 FY27 | Q2 FY26 | Change | Basis |
|---|---|---|---|---|
| Net profit, Rs crore | 4,137.12 | 5,175.70 | -20.1% | Standalone |
| Net profit, Rs crore | 4,229.33 | 5,186.55 | -18.5% | Consolidated |
| EBITDA, Rs crore | 5,160 | 6,251 | about -17% | Upstox |
| Profit before tax, Rs crore | 5,481.75 | Not in sources | – | Standalone |
| Tax, Rs crore | 1,344.63 | Not in sources | – | Standalone |
| Other income, Rs crore | 507.36 | 584.40 | -13.2% | Standalone |
Cite this table: PositionalCalls, “ITC Q2 Results: Headline Table, as of 2 November 2026”.
Profit before tax of Rs 5,481.75 crore and tax of Rs 1,344.63 crore imply a tax rate of 24.5% (my calculation). Other income fell to Rs 507.36 crore from Rs 584.40 crore. Standalone profit before exceptional items was Rs 5,720.28 crore against Rs 6,890.60 crore, down 17.0% (my calculation). Multibagg lists an exceptional acquisition-related expense of Rs 25.66 crore this year and an insurance settlement gain of Rs 88.08 crore a year earlier.
The gap between the two profit lines is itself a flag. Rs 5,720.28 crore less Rs 5,481.75 crore is Rs 238.53 crore, more than the Rs 25.66 crore exceptional item stated, so another item must sit in between. The source flags this too; the filing notes would show it.
When did the ITC Q2 results come out, and at what time?
The ITC Q2 results came on Monday, 2 November 2026, after market hours, as the preview had said. Upstox noted that the results came after the close, with its article stamped 7:28 PM IST and The Week’s stamped 8:21 PM IST.
The exact filing time is not in the reports I opened. Do not quote a time unless the exchange page shows it. The Rs 266.40 close on 2 November, up 0.30% with an intraday range of Rs 264.00 to Rs 269.30 (Upstox), was before the results; the reaction is in the share-price section below.
Which ITC Q2 results profit and base should you compare?
ITC net profit Q2 FY27 has two bases, so compare standalone with standalone and consolidated with consolidated, and note that the year-ago standalone base has moved. The preview used Rs 5,126.11 crore from Business Standard; the post-results reports compare with Rs 5,175.70 crore.
| Figure | Q2 FY27 | Year-ago base | Change | Source note |
|---|---|---|---|---|
| Standalone profit, Rs crore | 4,137.12 | 5,175.70 | -20.1% | Upstox, Whalesbook, Multibagg |
| Standalone, older base | 4,137.12 | 5,126.11 | -19.3% | My calculation on the preview base |
| Consolidated profit, Rs crore | 4,229.33 | 5,186.55 | -18.5% | The Week, Multibagg |
| Consolidated, attributable to owners | 4,168.40 | 5,126.11 | -18.7% | Business Standard, Whalesbook headline; excludes the minority share |
| Businessworld | 4,137 | about 5,178 | -20.1% | Labelled consolidated; matches standalone |
Cite this table: PositionalCalls, “ITC Q2 Results: Profit Definition Table, as of 2 November 2026”.
Why the base moved is not explained in the reports. The difference is Rs 49.59 crore (5,175.70 less 5,126.11, my calculation). It may be a restatement, but I did not open the filing, so I treat it as unexplained. On either base the story is the same: a fall of about 19% to 20%.
The two consolidated figures are explained. Business Standard reports Rs 4,168.40 crore as profit attributable to owners, and Rs 4,229.33 crore is total consolidated profit; the gap of Rs 60.93 crore is the minority share (my calculation).
Against Q1 FY27, the picture is better. Standalone profit of Rs 4,137 crore is +15.6% on Rs 3,579 crore. Consolidated profit of Rs 4,229 crore is -6.2% against Q1’s Rs 4,509 crore, but that Q1 figure held a Rs 406 crore gain, and +3.1% against the Rs 4,103 crore before exceptional items (my calculation). Which Q1 line you pick changes the direction of the sequential comparison.
ITC Q2 results: how do the broker marks compare with the actuals?
Before the ITC Q2 results, two brokerages were cited by Business Today. ITC EBITDA Q2 FY27 came in at Rs 5,160 crore. The reported standalone profit was above the YES Securities estimate and EBITDA landed inside Emkay’s range. Two views are not a consensus.
| Item (standalone) | YES Securities | Emkay Global | Reported | Read |
|---|---|---|---|---|
| Net profit | Rs 3,925.8 cr | Not given | Rs 4,137 cr | +5.4% vs YES |
| EBITDA | Rs 4,783.3 cr (-23.5%) | -15% or -18% | Rs 5,160 cr (-17%) | +7.9% vs YES; inside Emkay |
| Net revenue | Rs 17,394 cr | Net sales +3% | Rs 20,269 cr (+3.9%) | Bases may differ |
| Cigarette EBIT | Not given | -29% | -26% (-27% per CLSA, JP Morgan) | Smaller fall than Emkay |
| Cigarette volume | -6% | High single digit fall | -7% to -8% (JP Morgan) | Inside the marks |
| Other FMCG revenue | +11.5% | +13% | +19.1% | Above both |
| Agri revenue | +35.0% | +6% | +12.7% | Nearer Emkay |
| Paper revenue | +9.0% | +30% incl. Century | +35.9% | Above both; acquisition included |
Cite this table: PositionalCalls, “ITC Q2 Results: Estimates Versus Actuals, as of 2 November 2026”.
Businessworld cites a Bloomberg consensus of Rs 4,129 crore and says the actual was marginally above it, but it labels Rs 4,137 crore as consolidated. The same figure is standalone in other reports, so I do not use that comparison. The preview figure for net revenue, Rs 17,394 crore, is a broker estimate on its own base; the reported net revenue after excise is Rs 20,269 crore, so it is not a like-for-like beat.
ITC share price after Q2 results: how did the stock react?
ITC shares closed at Rs 273.90 on Tuesday, 3 November 2026, up 2.82%, the first session after the results, rose about 3% to Rs 282 in early trade on 4 November, and closed at Rs 278.80 on 9 November, down 1.64%, from a pre-results close of Rs 266.40.
| Time | Price, Rs | Move | Source |
|---|---|---|---|
| Close, Monday 2 November (before results) | 266.40 | +0.30% | Upstox |
| Early trade, Tuesday 3 November | 266.50 | About flat | Moneycontrol via TradingView |
| About 9:36 AM IST, Tuesday 3 November | Not stated | +1.5% | Business Standard |
| About 1:04 PM IST, Tuesday 3 November | 268.30 | +0.71% | Goodreturns |
| Close, Tuesday 3 November | 273.90 | +2.82% | 5paisa headline |
| Early trade, Wednesday 4 November | 282 | About +3% on the day; top Nifty 50 gainer | Moneycontrol via TradingView |
| Close, Monday 9 November | 278.80 | -1.64%; closed near the session low | 5paisa headline |
Cite this table: PositionalCalls, “ITC Q2 Results: Share Price Reaction Table, as of 14 November 2026”.
Reports differed on Tuesday’s direction intraday: one Zee Business piece says the shares traded in the red, while Business Standard and Goodreturns show gains. The 5paisa close of Rs 273.90 is 2.8% above Rs 266.40 (my calculation). I did not find the closes between 4 and 6 November or after 9 November.
What does the move after the ITC Q2 results mean in rupees?
Take 100 shares held from the Rs 266.40 close, purely as an illustration. At the Rs 278.80 close of 9 November the paper gain is Rs 1,240 before charges and taxes (12.40 times 100, my calculation). It says nothing about whether the quarter was good, and prices can reverse.
ITC Q2 results: brokerage targets as reported
Equentis, 3 November 2026, lists post-result ratings from Neutral to Buy and targets from Rs 285 to Rs 390; this is a single source, and the targets are the brokerages’ views, not PositionalCalls targets.
| Brokerage | Rating | Target | Gap to Rs 278.80 (my calculation) |
|---|---|---|---|
| Morgan Stanley | Equal-weight | Rs 312 (cut from Rs 340) | +11.9% |
| Goldman Sachs | Neutral | Rs 290 | +4.0% |
| JPMorgan | Neutral | Rs 310 | +11.2% |
| Jefferies | Buy | Rs 350 | +25.5% |
| UBS | Buy | Rs 345 | +23.7% |
| CLSA | Outperform | Rs 390 | +39.9% |
| Macquarie | Neutral | Rs 300 | +7.6% |
| Emkay Global | Add | Rs 300 | +7.6% |
| Motilal Oswal | Neutral | Rs 285 | +2.2% |
| Nuvama | Buy | No target stated | n/a |
Cite this table: PositionalCalls, “ITC Brokerage Targets After Q2 FY27, as reported by Equentis on 3 November 2026; gap to the 9 November close”.
CLSA kept its Outperform rating and said cigarette EBIT was 4% above its estimate. JP Morgan said the cigarette business performed in line with expectations, with volume down 7% to 8%, and expects price increases to narrow the fall in cigarette EBIT. Goldman Sachs said the quarter was mostly in line with non-cigarette businesses accelerating. The gap column is arithmetic on a closing price, not a forecast. This page gives no targets, ratings or recommendations of its own, and PositionalCalls is not SEBI-registered. One plausible reading, my inference, is that the market focused on non-cigarette growth and on volume landing inside the preview marks, not on the headline profit fall.
PositionalCalls WhatsApp channel
Get the ITC Q2 numbers on WhatsApp
- The ITC filing time and headline numbers, stamped
- Base-to-beat tables for the next company results
- Links to updated Q2 FY27 pages
ITC Q2 results revenue: which of three lines should you use?
In the ITC Q2 results, three standalone revenue lines circulate, with growth of +43.9%, +28% and +3.9%. Only revenue after excise duty is comparable with last year, and it is the line to set against net revenue estimates.
| Revenue line | Q2 FY27, Rs crore | Year-ago, Rs crore | Growth | What it includes |
|---|---|---|---|---|
| Revenue from operations (reported) | 30,578.40 | 21,255.86 | +43.9% | Includes excise duty under accounting rules |
| Revenue after excise duty | 20,268.63 | 19,501.63 | +3.9% | Calculated from the filing per Multibagg |
| Revenue from operations (Whalesbook, Upstox) | 28,317.67 | 19,441.50 | +28% | Definition not stated |
| Total income from operations | 29,125.19 | Not in sources | – | Standalone |
| Businessworld “consolidated” revenue | 18,401 | 18,081 | +1.8% | Does not reconcile with the lines above |
Cite this table: PositionalCalls, “ITC Q2 Results: Revenue Definition Table, as of 2 November 2026”.
The gap between reported revenue and revenue after excise is Rs 10,309.77 crore (30,578.40 less 20,268.63, my calculation). In Q1 FY27 the gap between gross and net revenue was Rs 9,982 crore. Net revenue of Rs 20,269 crore is +20.6% on Q1’s Rs 16,812 crore (my calculation), which includes the Century Pulp and Paper business from August. The 43.9% is a presentation effect of the excise change, not demand.
For margins, the quoted EBITDA margin of 18.22% uses the Rs 28,318 crore line. On revenue after excise, Rs 5,160 crore is 25.5% against 32.1% a year earlier (my calculation). The year-ago margin printed in the source, 31.15%, does not match 6,251 divided by 19,442, which is 32.2%. Use the same revenue line on both sides.
How did cigarettes and the other segments do in the ITC Q2 results?
In the ITC Q2 results, cigarette segment profit fell 26% to Rs 4,044 crore, and that fall explains most of the group decline. FMCG-others, agri and paper all grew, and ITC said cigarette performance improved on Q1.
| Segment | Revenue Q2 FY27, Rs crore | Revenue growth | Segment profit, Rs crore | Profit change |
|---|---|---|---|---|
| Cigarettes | 16,237.11 (excise-affected) | Not comparable | 4,044.49 (vs 5,462.10) | -26% |
| Other FMCG | 7,218.36 | +19.1% | 576.69 | +31.4% |
| Agri | 4,550.60 | +12.7% | 518.41 | +14.3% |
| Paperboards, paper and packaging | 3,017.45 | +35.9% | 273.32 | +50.7% |
Cite this table: PositionalCalls, “ITC Q2 Results: Segment Table, as of 2 November 2026”.
Two sets of segment revenue circulate. Whalesbook and Businessworld show cigarettes at Rs 15,536.13 crore, other FMCG at Rs 6,967.17 crore, agri at Rs 4,451.69 crore and paper at Rs 3,015.85 crore. Multibagg shows the higher figures above. I use Multibagg for growth rates because they match the company’s own statements closely, but the revenue levels are unreconciled, so check the segment note in the filing.
On the company’s own statement, as carried by Upstox, ITC reported the fourth consecutive quarter of double-digit revenue growth in its non-cigarette businesses. Biscuits, snacks, noodles, spices, salt, frozen snacks, homecare and notebooks grew above 20%; dairy and personal wash grew in the high teens. Digital-first and organic brands have an annual run rate above Rs 1,800 crore, growing over 70%. Businessworld put FMCG-others PBIT at Rs 558 crore, up 27.8%, a little below Multibagg’s Rs 577 crore, up 31.4%; the sources differ on the exact figure.
Agri revenue grew 12.7% with value-added products strong and leaf tobacco hit by lower domestic demand, and with West Asia disruption and delayed customer call-offs cited. Paper revenue grew 35.9% and segment profit about 48% to 51%, and the Century Pulp and Paper integration in August 2026 adds acquired revenue, so the growth is not all organic.
ITC cigarette volume Q2 FY27 is not in the company statement I read, but brokerages put it down about 7% to 8%: JP Morgan said 7% to 8% and Business Standard cites another brokerage at 8%. That sits inside the preview marks of a 6% fall (YES Securities) and a high-single-digit fall (Emkay). CLSA and JP Morgan both put cigarette EBIT down 27% on the year. ITC says legal industry volumes stayed under pressure after an unprecedented tax increase; the company presentation should give the exact volume.
Which other results land around ITC?
Marico reported on the same day as the ITC Q2 results, and its numbers are on our Marico Q2 results page. Bajaj Finserv and SBI both reported on Tuesday, 3 November; see our Bajaj Finserv Q2 results and SBI Q2 results pages. For the method of a results read in other sectors, see Titan Q2 results and Jio Platforms Q2 results. The Q2 results calendar lists the companies that have reported. The Kotak Neo list is partial, and dates may change.
If you hold ITC shares and plan to sell later, our guide to capital gains tax on shares covers how gains are taxed. It is general information, not tax advice.
How to read the ITC Q2 results in 10 minutes
Read the ITC Q2 results in seven lines, in this order: standalone profit, revenue after excise, EBITDA, cigarette segment profit, FMCG-others, agri and the notes on one-off items.
| What to read | Mark to compare | Question to ask |
|---|---|---|
| Standalone net profit | Rs 5,176 cr (Q2 FY26); Rs 3,579 cr (Q1 FY27) | Is it up on Q1 and how far below last year? |
| Revenue after excise | Rs 19,502 cr (Q2 FY26) | Is growth about 4%, not 44%? |
| EBITDA | Rs 6,251 cr (Q2 FY26) | Same revenue line on both sides? |
| Cigarette segment profit | Rs 5,462 cr (Q2 FY26) | Fall of about 26%; volume down 7% to 8%? |
| FMCG-others | +19% revenue; +11.5% to +13% views | Did growth stay in double digits? |
| Agri and paper | +12.7% and +35.9% | How much of paper is acquired? |
| Exceptional items | Rs 25.66 cr expense; Rs 88.08 cr year-ago gain | Is the gap to PBT explained? |
Cite this table: PositionalCalls, “ITC Q2 Results: Results-Day Decoder, as of 2 November 2026”.
How to read the ITC Q2 results filing on NSE or BSE
- Open the BSE corporate announcements page or the NSE corporate filings page and search for ITC.
- Choose the financial results announcement for the quarter ended 30 September 2026.
- Find the standalone statement first, then the consolidated one.
- Check the unit and the revenue line, since excise duty is inside reported revenue.
- Read the year-ago column to see whether the base was restated.
- Open the segment table for cigarettes, FMCG-others, agri and paper.
- Check the notes for exceptional items.
What it costs: reading a filing is free. If you trade the stock, brokerage, securities transaction tax and other charges apply, so check your broker’s current schedule. Scam warning: after results, fake “result alert” groups and sure-shot tips circulate. Nobody can guarantee a gain, and official filings are free.
What is the results checklist for ITC?
- Confirm the figures on the BSE or NSE announcement page.
- Note the filing time and stamp what you read with it.
- Open the standalone statement before any headline.
- Compare standalone profit with Rs 5,176 crore and Rs 3,579 crore.
- Use revenue after excise for growth, not reported revenue.
- Check whether the year-ago base was restated from Rs 5,126 crore.
- Find the exact cigarette volume in the company presentation.
- Read the note that explains the profit-before-tax gap.
- Write your own plan before the price moves.
What are the risks around the ITC Q2 results?
What do most people miss on ITC results day?
- Revenue growth of 44% is not demand. It reflects excise duty sitting inside revenue.
- Standalone and consolidated differ. The two fell 20.1% and 18.5%, and some reports swap the labels.
- The base moved. Rs 5,126 crore became Rs 5,176 crore in post-results reports.
- Up on Q1, down on the year. Both are true at once.
- The beat is against one broker. It is not a consensus.
- Paper growth is partly acquired.
- The shares rose after a 20% profit fall. Volume landed inside the marks and non-cigarette growth was strong.
Analyst’s note: how to think about this quarter
- What stands out (reasoning): a cigarette tax hit pulled profit 20% below last year, yet profit rose 15.6% on Q1, landed above the one broker view, and the shares rose.
- Easy to miss: the revenue line you pick decides whether the quarter looks like +44% or +4%.
- What would change the view: a cigarette volume figure well outside the 7% to 8% fall brokerages cite, or a filing note that restates the base further.
- Caution: one quarter does not fix a long-term value. This page gives no target or recommendation.
- Reader action: read the standalone statement first and match each line to the base table.
Bottom line
Known: the ITC Q2 results show standalone profit of Rs 4,137 crore, down 20.1% on the year and up 15.6% on Q1, EBITDA down about 17%, cigarette volume down about 7% to 8% per brokerages, and shares up about 3% to Rs 282 on 4 November.
Not known yet: the exact filing time, the company’s own cigarette volume figure, the reason the base moved and any close after 9 November.
Your move: use the decoder table and compare same-basis figures.
Next read: Marico Q2 results, another FMCG result from the same day.
Part of the earnings coverage.
PositionalCalls WhatsApp channel
Results day, in one WhatsApp channel
- Filing alerts for ITC and other large companies
- The profit and revenue figures explained
- The next company on the results calendar
ITC Q2 results: frequently asked questions
When did ITC report its Q2 FY27 results?
ITC reported on Monday, 2 November 2026, after market hours. Upstox stamped its article at 7:28 PM IST and others carried the numbers by about 8:21 PM IST. The sources I opened do not give the exact filing time, so confirm it on the BSE or NSE announcement page.
What was ITC net profit in Q2 FY27?
Standalone net profit was Rs 4,137 crore, down 20.1% from Rs 5,176 crore, as reported by Upstox, Whalesbook and Multibagg. Consolidated net profit was Rs 4,229 crore, down about 18.5% from Rs 5,187 crore; the part attributable to owners was Rs 4,168.40 crore, down 18.7%, per Business Standard. Some reports label the standalone figure as consolidated, so check the basis.
How do the ITC Q2 results compare with Q1 FY27?
Standalone profit of Rs 4,137 crore is up 15.6% on Q1 FY27’s Rs 3,579 crore (my calculation). Consolidated profit of Rs 4,229 crore is 6.2% below Q1’s Rs 4,509 crore, which included a Rs 406 crore one-time gain, and 3.1% above the Q1 pre-exceptional figure of Rs 4,103 crore (my calculation).
Did the ITC Q2 results beat estimates?
Against the one broker estimate on this site, yes. YES Securities expected standalone profit of Rs 3,925.8 crore, and the reported Rs 4,137 crore is 5.4% higher (my calculation). Businessworld cites a Bloomberg consensus of Rs 4,129 crore without stating its basis, so treat that comparison as unconfirmed.
Why does ITC revenue show 44% growth in one report and 4% in another?
Standalone revenue from operations of Rs 30,578 crore, up 43.9%, includes excise duty. Revenue after excise duty was Rs 20,269 crore, up about 3.9% from Rs 19,502 crore, as Multibagg calculated from the filing. Another set shows Rs 28,318 crore, up 28%. The three lines have different definitions.
What happened to cigarette profit and volume in the ITC Q2 results?
Cigarette segment profit was Rs 4,044 crore, down 26% from Rs 5,462 crore, according to Multibagg’s read of the filing; JP Morgan and CLSA put cigarette EBIT down 27%. JP Morgan estimated volume down 7% to 8%. Emkay had expected cigarette EBIT down 29%. ITC said legal industry volumes stayed under pressure after an unprecedented tax increase.
How did ITC’s other businesses do?
Other FMCG revenue rose 19.1% with segment profit up 31.4%, agri revenue rose 12.7%, and paperboards and packaging revenue rose 35.9% with segment profit up 50.7% (Multibagg). Paper includes the Century Pulp and Paper business integrated in August 2026, so part of that growth is acquired.
What was the ITC EBITDA in Q2 FY27?
Upstox reports EBITDA of Rs 5,160 crore, down 17% from Rs 6,251 crore. Emkay had expected a fall of 15% or 18%, and YES Securities expected Rs 4,783 crore. The quoted margin of 18.22% is measured on the Rs 28,318 crore revenue line, so it is not comparable with margins on other revenue lines.
How did the ITC share price react to the ITC Q2 results?
ITC closed at Rs 266.40 on 2 November, before the results, and at Rs 273.90 on 3 November, up 2.82% (5paisa). On 4 November it rose about 3% to Rs 282 in early trade and led the Nifty 50, and on 9 November it closed at Rs 278.80, down 1.64%. Closes after 9 November were not found; intraday quotes differ by time and source.
Did ITC announce a dividend with the Q2 results?
The reports I opened do not mention a dividend. I did not open the exchange filing, so check the BSE or NSE announcement page for any dividend decision before assuming there is none. Treat any dividend alert as unconfirmed until it appears there.
Sources
- BSE corporate announcements: where the ITC filing appears.
- NSE corporate filings: financial results: the same filing on NSE.
- Upstox: ITC Q2 FY27 result, 2 November 2026.
- Multibagg: ITC Q2 FY27 profit falls 20%, 2 November 2026.
- Whalesbook: ITC Q2 profit and revenue, 2 November 2026.
- The Week: ITC Q2 net profit falls 18.45%, 2 November 2026.
- Businessworld: ITC cigarette business slumps 27%, 2 November 2026.
- Business Today: ITC Q2 expectations, 30 October 2026.
- Business Standard: ITC up 1% after weak Q2, 3 November 2026.
- Goodreturns: ITC share price report, 3 November 2026.
- Moneycontrol via TradingView, 3 and 4 November 2026: share-price moves and brokerage views; Zee Business, 3 November 2026: brokerage views; Equentis, 3 November 2026: brokerage ratings and targets; 5paisa, 3 and 9 November 2026: closing prices.
- Kotak Neo, Q1 FY27 article, and Business Standard and Newsdrum, Q2 FY26 articles: base figures from the preview.

Shubham Chaudhary is the founder of PositionalCalls, an independent Indian stock market research website. He writes company fundamentals, quarterly results analysis, IPO analysis and sector research for NSE and BSE listed companies, with a focus on banking stocks, insurance and long-term value investing. Every article is built from primary sources such as RBI, SEBI, NSE and BSE filings and company annual reports, and states its risks plainly in simple language for retail investors.
Coverage areas Our research standards- Numbers checked against NSE, BSE and SEBI filings
- Risks and limits stated in every article
- No paid promotions or broker tie-ups
- Articles updated when new filings arrive