
Earnings · Auto · Mahindra & Mahindra
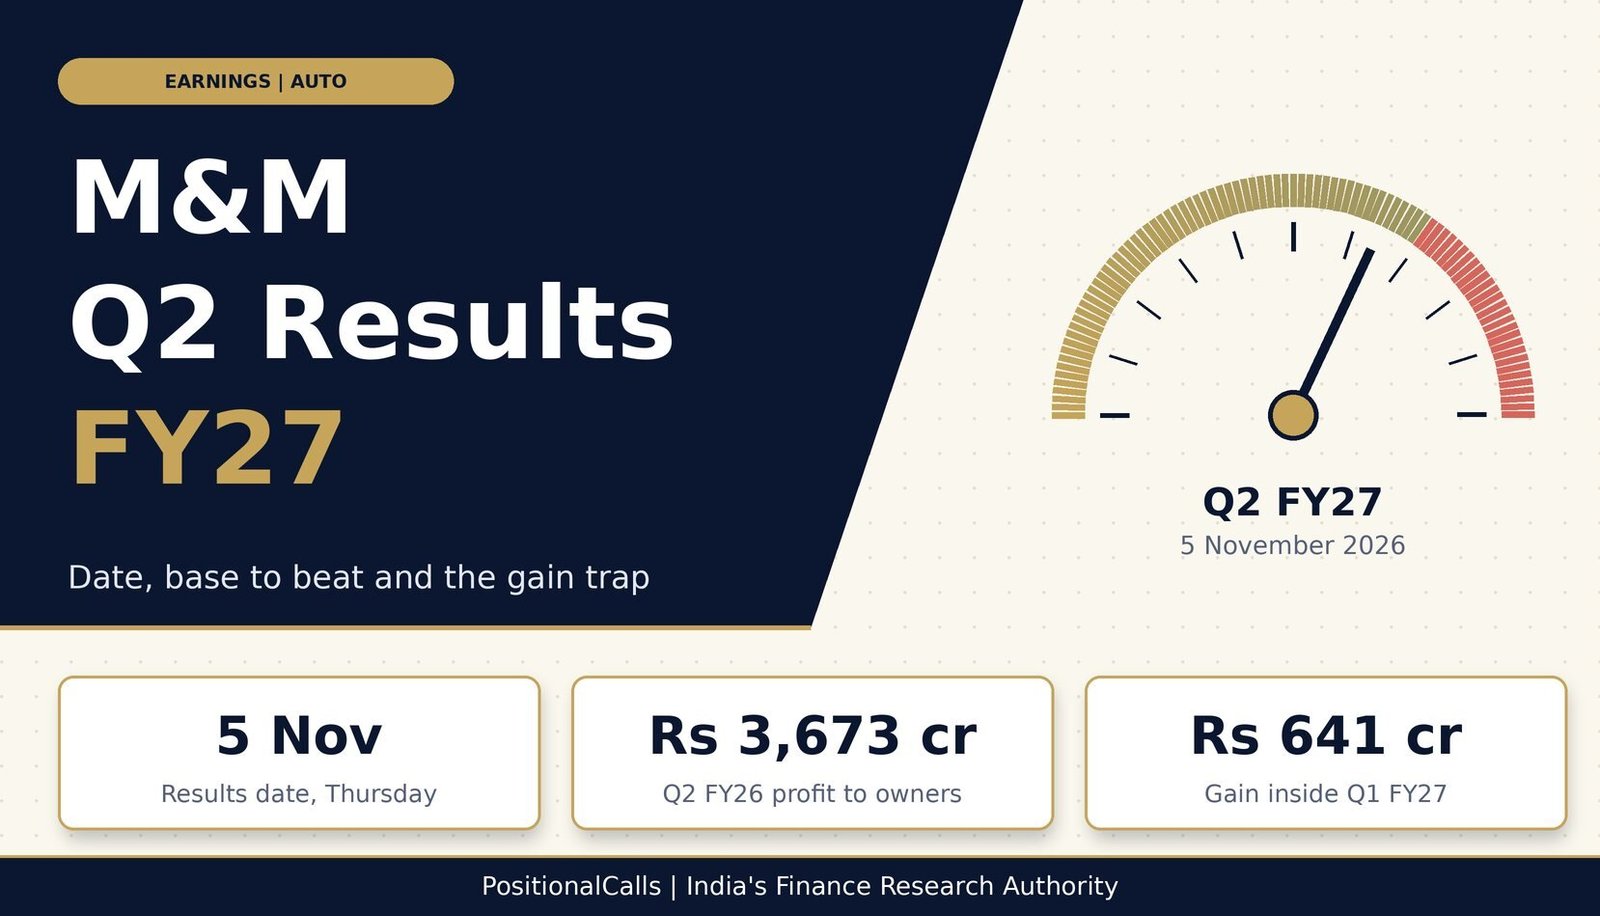
Mahindra & Mahindra is reported to announce its September-quarter results on Thursday, 5 November 2026. Last quarter’s profit carried a Rs 641 crore gain, and tractor sales dipped in September. Here are the date, the clean base and the lines to read first.
Quick answer
M&M Q2 results FY27 are due on Thursday, 5 November 2026, per a board-meeting report. The base to beat is Rs 3,673 crore profit to owners and Rs 46,106 crore revenue from Q2 FY26. Q1 FY27 profit to owners was Rs 5,455 crore but included a Rs 641 crore gain, as of 31 October 2026.
Latest update (31 October 2026, 8:30 PM IST): A trade report puts the M&M board meeting on 5 November 2026, and the company has set an analyst meet for the same day. I did not see the board notice and did not find a published Q2 FY27 profit consensus as of this update.
Key takeaways
- Date: board meeting reported for Thursday, 5 November 2026; analyst meet 4:00 PM to 5:30 PM; trading window closed until 7 November.
- Base to beat: Q2 FY26 consolidated profit to owners Rs 3,673 crore on revenue of Rs 46,106 crore.
- Gain trap: Q1 FY27 profit to owners of Rs 5,455 crore includes a Rs 641.33 crore gain on an associate stake.
- Volumes: SUV sales were up about 26% in Q2, but domestic tractor sales were down about 7% as September fell 23%.
- Three profits: Rs 3,673 crore, Rs 3,964 crore and Rs 4,521 crore all describe Q2 FY26.
In plain words: M&M sells SUVs, tractors and commercial vehicles, and also owns a finance company and other businesses. This page tells you when the September-quarter result is due, which year-ago numbers it will be compared with, and why profit appears as several different figures.
Data note: as of Saturday, 31 October 2026, 8:30 PM IST. Q1 FY27 figures come from M&M’s filing of 30 July 2026, which I opened. Q2 FY26 figures come from M&M’s press release and news reports. Monthly volumes come from company sales releases as carried by trade sites. Q2 FY27 results are not reported yet.
When are M&M Q2 results FY27 due?
Thursday, 5 November 2026, according to a Sahi report; the company’s analyst meet on the same day and a trading-window closure to 7 November fit that date.
Sahi reports that the board will meet on 5 November 2026 to consider Q2 FY27 results. A ScanX note says M&M will host its Q2 FY27 analyst meet in Mumbai on 5 November from 4:00 PM to 5:30 PM, with a replay until 5 December. PSU Connect reports the insider trading window closed from 1 October to 7 November 2026, which reopens 48 hours after results, so a 5 November result fits. I did not open the board notice, so confirm the date on the BSE or NSE page.
Timing pattern: for Q1 FY27 the board met from 11:10 AM to 12:50 PM on 30 July 2026, and last year the Q2 results came during market hours on Tuesday, 4 November 2025. Results can therefore land before the 4:00 PM analyst meet.
M&M Q2 results FY27: what changed and when
| Event | Date | Weekday | Status |
|---|---|---|---|
| Q2 FY26 results | 4 November 2025 | Tuesday | Filed; this is the year-ago base |
| Q4 FY26 results | 5 May 2026 | Tuesday | Filed |
| Q1 FY27 results | 30 July 2026 | Thursday | Filed; gain of Rs 641 crore inside |
| Q2 FY27 analyst meet | 5 November 2026 | Thursday | 4:00 PM to 5:30 PM, Mumbai |
| Q2 FY27 results | 5 November 2026 | Thursday | Reported date; confirm in filing |
The legal deadline is 14 November 2026. Other results the same day include Titan, Airtel and LIC. Track every date on the results calendar hub.
What numbers does M&M have to beat?
Revenue of Rs 46,106 crore and profit to owners of Rs 3,673 crore from Q2 FY26, with Q1 FY27 as the current run-rate.
| Consolidated, Rs crore | Q2 FY26 (year-ago base) | Q1 FY27 | Gap (my calculation) | Why it matters |
|---|---|---|---|---|
| Revenue (income from operations) | 46,106 | 58,188 | +12,082 (+26.2%) | Headline growth measure |
| Profit before tax | 6,058 | 7,628 | +1,570 (+25.9%) | Includes Rs 641 crore gain in Q1 |
| Profit to owners | 3,673 | 5,455 | +1,781 (+48.5%) | Basis for earnings per share |
| Profit incl. minority interest | 3,964 | 5,998 | +2,034 (+51.3%) | Group profit before minority split |
| Standalone profit after tax | 4,521 | 3,685 | -836 (-18.5%) | Parent company only |
Cite this table: PositionalCalls, “PositionalCalls M&M Q2 FY27 Base-to-Beat Table, as of 31 October 2026”.
The gap column reads across two different quarters, so it is a guide, not a seasonal comparison. The year-on-year test for M&M Q2 results FY27 uses the base column. Q2 FY26 revenue appears as Rs 46,106 crore (the company’s headline, consistent with income from operations) and Rs 45,885 crore (revenue from operations); I use Rs 46,106 crore for comparison with Q1 FY27’s Rs 58,188 crore on the same basis. Standalone profit fell below the base even as consolidated profit rose, which makes the parent-versus-group split worth watching.
Which M&M profit number is the right one?
Use consolidated profit attributable to owners (Rs 5,454.54 crore in Q1 FY27), and strip out the Rs 641.33 crore gain before judging trend.
| Profit definition, Rs crore | Q2 FY26 | Q1 FY27 | Q1 FY26 | Where you see it |
|---|---|---|---|---|
| Profit to owners (consolidated) | 3,673.32 | 5,454.54 | 4,083.32 | Company headline; news |
| Profit incl. minority interest | 3,963.75 | 5,997.56 | 4,376.58 | Data pages; statement |
| Minority share (difference, my calculation) | 290.43 | 543.02 | 293.26 | Not shown on its own |
| Standalone profit after tax | 4,520.52 | 3,684.97 | 3,449.84 | Parent-only filing |
Cite this table: PositionalCalls, “PositionalCalls M&M Profit Definitions Table, as of 31 October 2026”.
Q1 FY27 note 2 says income from investments includes a gain of Rs 641.33 crore on sale of an investment in an associate. The associate list shows CIE Automotive as an associate only until 13 May 2026, which is consistent with that sale, but the note does not name it. My calculation: Rs 5,454.54 crore less Rs 641.33 crore is Rs 4,813.21 crore, which is 31.0% above the Q2 FY26 base of Rs 3,673.32 crore. That ignores tax on the gain, so the true underlying figure is higher; the reported figure is 48.5% above the base.
The base has its own adjustment
For Q2 FY26 the company described profit of Rs 3,673 crore as up 28%, excluding a one-time land-sale gain in Q2 FY25. The unadjusted rise was 15.8% (3,673.32 against 3,170.72). So the base year carried an adjustment, and Q2 FY27 coverage may quote growth either as reported or as adjusted. Ask which one before you compare.
Q1 FY27 bridge
| Q1 FY27, Rs crore | Amount | Note |
|---|---|---|
| Total income | 59,203.60 | Income from operations 58,187.57 plus other income 1,016.03 |
| Profit before associates and tax | 7,260.60 | After expenses of 51,943.00 |
| Share of associates and joint ventures | 367.49 | Added |
| Profit before tax | 7,628.09 | Reported |
| Tax | 1,630.53 | Current 1,597.80 plus deferred 32.73 |
| Profit after tax | 5,997.56 | Reported |
| Minority share | 543.02 | Deducted |
| Profit to owners | 5,454.54 | Reported |
What did Q2 volumes show for SUVs and tractors?
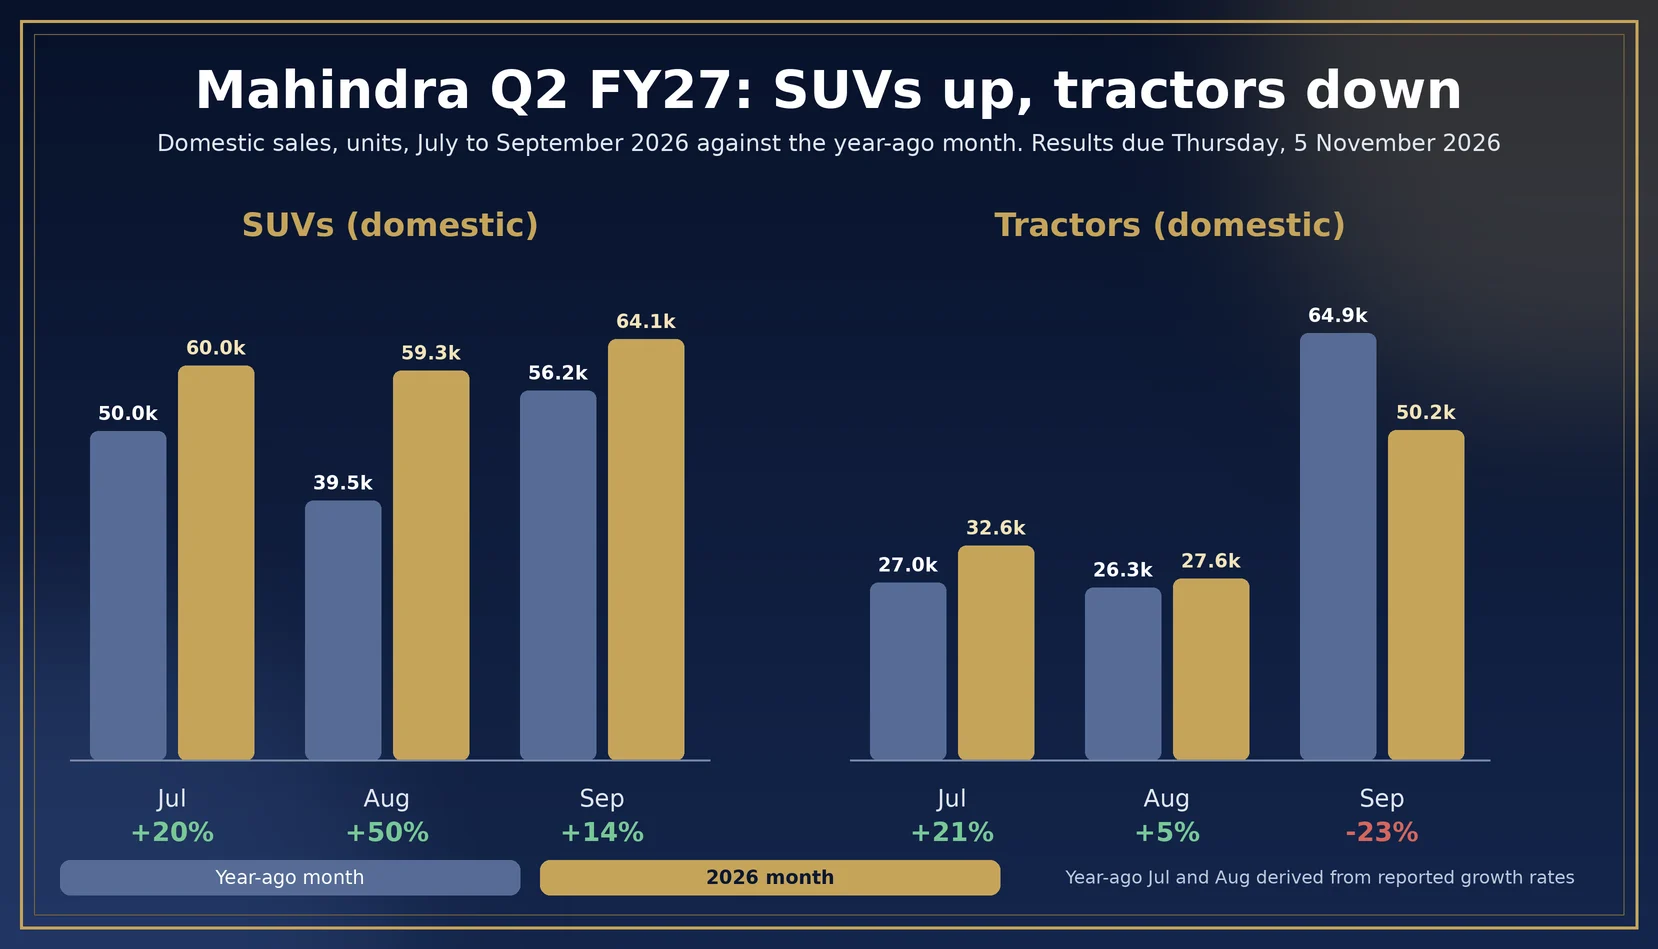
SUV sales were up about 26% in the quarter on my calculation, but domestic tractor sales were down about 7% after a 23% fall in September.
| Domestic sales, units | July 2026 | August 2026 | September 2026 | Q2 total (my sum) |
|---|---|---|---|---|
| Utility vehicles (SUVs) | 60,048 (+20%) | 59,257 (+50%) | 64,092 (+14%) | 183,397 |
| Tractors | 32,643 (+21%) | 27,595 (+5%) | 50,208 (-23%) | 110,446 |
Cite this table: PositionalCalls, “PositionalCalls Mahindra Q2 FY27 Monthly Volumes Table, as of 31 October 2026”.
My calculation from the reported growth rates puts last year’s Q2 at about 145,800 SUVs and about 118,200 tractors (the September 2025 tractor figure of 64,946 is reported; July and August are derived from rounded percentages). That gives SUV growth of about 26% and tractor growth of about minus 7%, so treat both as approximate. Cumulative April to September domestic tractor sales were still 262,872 units, up 6% on 247,336. Mahindra linked the September fall to later festive timing.
Year-ago Q2 FY26 volumes were strong: the company reported tractors up 32% and a record Q2 market share. A volume dip on a high base can lower farm segment margins even if pricing holds. Total September vehicle sales including exports were 114,874 units, up 15%, with exports down 7% to 4,019 units. Compare how another auto name reports in our Maruti Suzuki Q2 FY27 results coverage.
PositionalCalls WhatsApp channel
Get the M&M Q2 result note on 5 November
- Alerts when M&M files its Thursday results
- The profit, gain and segment lines we check first
- A link when this page is updated with the numbers
How did each business do in Q1 FY27?
Revenue grew 26% against the Q2 FY26 base, but automotive and farm margins slipped on a like-for-like Q1 basis; financial services and industrial businesses lifted profit.
| Segment (consolidated), Rs crore | Q2 FY26 revenue (base) | Q1 FY27 revenue | Change | Q1 FY27 result (margin) |
|---|---|---|---|---|
| Automotive | 27,171 | 34,387 | +26.6% | 2,650 (7.7%) |
| Farm Equipment | 10,225 | 12,501 | +22.3% | 1,782 (14.3%) |
| Financial Services | 5,016 | 5,698 | +13.6% | 1,201 (21.1%) |
| Industrial and Consumer Services | 5,033 | 7,201 | +43.1% | 995 (13.8%) |
| Total segment revenue | 47,444 | 59,787 | +26.0% | 6,628 before associates |
Cite this table: PositionalCalls, “PositionalCalls M&M Segment Table, as of 31 October 2026”.
Segment results are on the filing’s basis: after exceptional items and before share of associates. The margins are my calculation. On the same basis a year earlier (Q1 FY26) automotive earned 8.0% (2,083.53 on 25,998.71), farm 15.0%, financial services 13.3% and industrial and consumer services 4.3%. So Q1 FY27 automotive margin fell about 0.3 points and farm about 0.7 points, while financial services rose 7.7 points and industrial and consumer services 9.5 points. I could not tell from the filing which segment carries the Rs 641 crore gain.
Standalone numbers point the same way. Standalone automotive segment result was Rs 2,211.62 crore against Rs 2,220.94 crore a year earlier on revenue up 24%, and the filing’s standalone operating margin was 12.19% against 14.33%. The company’s Q2 FY26 presentation put consolidated automotive and farm profit before interest and tax at Rs 2,538 crore and Rs 1,608 crore; that basis differs from the filing’s segment results, so do not compare the two directly.
What could Q2 profit look like? A sensitivity table
Under my arithmetic, M&M Q2 results FY27 could show profit to owners between about Rs 4,408 crore and Rs 4,882 crore; this is a sensitivity, not a forecast.
Assumptions: Q2 FY26 revenue of Rs 46,106 crore grows by the stated rate; profit to owners is a share of revenue. The 7.97% share is Q2 FY26’s (3,673.32 over 46,106). The 8.27% share is Q1 FY27 without the Rs 641.33 crore gain (4,813.21 over 58,187.57), a conservative cut because the gain’s tax is unknown.
| Scenario | Revenue (Rs crore) | Profit share | Profit to owners (Rs crore) | vs 3,673 base |
|---|---|---|---|---|
| A: +20% revenue, Q2 FY26 share | 55,327 | 7.97% | 4,408 | +20.0% |
| B: +25% revenue, Q1 ex-gain share | 57,632 | 8.27% | 4,767 | +29.8% |
| C: +28% revenue, Q1 ex-gain share | 59,016 | 8.27% | 4,882 | +32.9% |
Cite this table: PositionalCalls, “PositionalCalls M&M Q2 FY27 Profit Sensitivity Table, as of 31 October 2026”.
These are not estimates, and I found no published Q2 FY27 consensus. Q1 FY27 revenue grew 27.8% on a year earlier, and September SUV volume growth of 14% was slower than July and August, so the revenue range is a reasonable frame rather than a prediction. If another associate or investment gain appears in Q2, reported profit will look higher than these figures; judge M&M Q2 results FY27 on the underlying lines.
Results-day decoder: what to read first
For M&M Q2 results FY27, read consolidated revenue and profit to owners first, then exceptional or investment gains, then segment margins, then standalone profit.
| What to read | Mark to beat | Question to ask |
|---|---|---|
| Consolidated revenue | Rs 46,106 crore (year-ago); Rs 58,188 crore (Q1) | Is growth near 25%? |
| Profit to owners | Rs 3,673 crore (year-ago) | Is the headline owners’ profit or group profit? |
| Investment or associate gains | Rs 641.33 crore in Q1 | Is there a new gain in Q2? |
| Automotive segment margin | 7.7% (Q1, filing basis) | Did it hold or recover? |
| Farm Equipment margin | 14.3% (Q1, filing basis) | Did tractor volume hurt it? |
| Financial Services result | Rs 1,201 crore (Q1) | Was it sustained? |
| Standalone profit | Rs 4,521 crore (year-ago); Rs 3,685 crore (Q1) | Did standalone recover? |
Cite this table: PositionalCalls, “PositionalCalls M&M Results-Day Decoder, as of 31 October 2026”.
How to read the result and what to avoid
To read M&M Q2 results FY27, use the exchange filing and the company press release, and ignore any message that offers the result early.
- Open the BSE or NSE announcements page for Mahindra & Mahindra and find the results filing.
- Read the consolidated statement, then the standalone one.
- Check the notes for gains on investments or exceptional items.
- Match the headline profit to owners, group or standalone using the table above.
- Compare segment results with the decoder.
- Note any dividend or merger announcement.
What it costs and what to avoid
Reading the result costs nothing. Dealing costs depend on your broker, so check the current charges schedule. Tax on dividends and gains follows the current rules, so see our capital gains tax on shares guide. Fake result alerts, “sure-shot” tips, KYC or OTP links and fake vehicle-booking pages circulate around auto results. Never share an OTP.
What most people miss
Analyst’s note
- What stands out: Q1 FY27 profit growth of 48.5% on the Q2 FY26 base is flattered by a Rs 641 crore gain, and even ex-gain growth is about 31% before tax effects.
- Easy to miss: standalone profit of Rs 3,685 crore is 18.5% below the Q2 FY26 standalone base while consolidated profit rose.
- What would change the view: a new one-off gain, a farm margin below 14%, or a further automotive margin slip.
- Caution: the sensitivity table is my own arithmetic, not a forecast or target. This note is reasoning from the filings.
- Reader action: on 5 November, match each headline profit to the definitions above.
Bottom line
M&M Q2 results FY27 are due on Thursday, 5 November 2026 per a trade report. The base is Rs 3,673 crore profit to owners on Rs 46,106 crore revenue. Last quarter’s profit includes a Rs 641 crore gain and tractor volumes dipped in September, so read the underlying lines before the growth percentage.
Next read: see all Q2 result dates on the calendar hub.
Part of the Earnings series.
PositionalCalls WhatsApp channel
Follow auto and big-cap results on WhatsApp
- Results calendar changes across auto companies
- Base-to-beat tables for SUV, tractor and truck results
- A link to each analysis when it is updated
FAQs on M&M Q2 results FY27
When are M&M Q2 results FY27 due?
M&M’s board is reported to meet on Thursday, 5 November 2026 to approve Q2 FY27 results, and the company has set an analyst meet for 4:00 PM to 5:30 PM the same day. The trading window is closed until 7 November. I did not see the board notice, so confirm it on the exchange page.
What is the base to beat for M&M Q2 results FY27?
From Q2 FY26 the company reported consolidated revenue of Rs 46,106 crore and consolidated profit after tax of Rs 3,673 crore, up 28% on an adjusted base. Profit including minority interest was about Rs 3,964 crore. Q2 FY27 growth is measured against these figures.
Which M&M profit figure should I use?
Use consolidated profit attributable to owners for per-share comparisons: Rs 5,455 crore in Q1 FY27 against Rs 3,673 crore in Q2 FY26. Profit including minority interest was Rs 5,998 crore in Q1 FY27. Standalone profit was Rs 3,685 crore. Always label which one you quote.
What one-off gain is in M&M’s Q1 FY27 profit?
The Q1 FY27 filing says income from investments includes a Rs 641.33 crore gain on sale of investment in an associate. Without it, pre-tax, owners’ profit would be about Rs 4,813 crore (my calculation). The note does not name the associate or the tax on the gain.
What were M&M’s Q1 FY27 results?
For the June 2026 quarter M&M reported consolidated income from operations of Rs 58,188 crore (up 27.8%), profit before tax of Rs 7,628 crore, profit after tax of Rs 5,998 crore and profit to owners of Rs 5,455 crore, up 33.6% on Rs 4,083 crore.
How did M&M’s SUV and tractor sales do in Q2 FY27?
Domestic SUV sales were about 183,400 units across July to September 2026, roughly 26% above last year by my calculation. Domestic tractor sales were about 110,400 units, roughly 7% below last year, after a 23% fall in September on a festive shift.
Why did Mahindra’s tractor sales fall in September 2026?
Mahindra sold 50,208 domestic tractors in September 2026 against 64,946 a year earlier, down 23%. Company and trade reports attribute the fall to later festive timing. Cumulative April to September domestic tractor sales were still 6% higher at 262,872 units.
Will M&M declare a dividend with its Q2 FY27 results?
A broker summary of the Q2 FY26 filing says the board announced no interim dividend for that quarter. I did not find a Q2 FY27 dividend notice. Only a board announcement can confirm one, so check the filing on 5 November.
Where can I read the official M&M Q2 results?
Read the filing on the BSE and NSE corporate announcement pages and the press release on Mahindra’s investor page. Compare the consolidated table with the base on this page, and ignore unofficial messages or screenshots that claim an early result.
Does this page give an M&M Q2 results FY27 buy or sell call?
No. This is research and education, not advice. PositionalCalls.com is not a SEBI-registered research analyst or investment adviser. Use the numbers to frame questions and speak to a registered adviser before investing.
Sources
- M&M outcome of board meeting and Q1 FY27 results, NSE archive (30 July 2026)
- M&M press release on Q2 FY26 results, company website (4 November 2025)
- Mahindra Auto September 2026 sales release, company website
- Sahi, ScanX and PSU Connect, M&M Q2 FY27 board and analyst meet reports, October 2026
- Autocar Pro and Tractor Junction, Mahindra monthly sales, July to September 2026
- Bajaj Broking, Muthoot Securities and Business Standard, Q2 FY26 results, November 2025
Editorial disclosure: PositionalCalls.com is not a SEBI-registered research analyst or investment adviser. Investments in securities markets are subject to market risks. Read all related documents carefully before investing. Returns are never guaranteed. PositionalCalls.com is an independent research and education site founded by Shubham Chaudhary. This page is not investment advice, a recommendation or a price target. How I researched this: I opened M&M’s Q1 FY27 filing, cross-checked the year-ago base against the company press release and news reports and recalculated every derived figure; own calculations are labelled.

Shubham Chaudhary is the founder of PositionalCalls, an independent Indian stock market research website. He writes company fundamentals, quarterly results analysis, IPO analysis and sector research for NSE and BSE listed companies, with a focus on banking stocks, insurance and long-term value investing. Every article is built from primary sources such as RBI, SEBI, NSE and BSE filings and company annual reports, and states its risks plainly in simple language for retail investors.
Coverage areas Our research standards- Numbers checked against NSE, BSE and SEBI filings
- Risks and limits stated in every article
- No paid promotions or broker tie-ups
- Articles updated when new filings arrive