
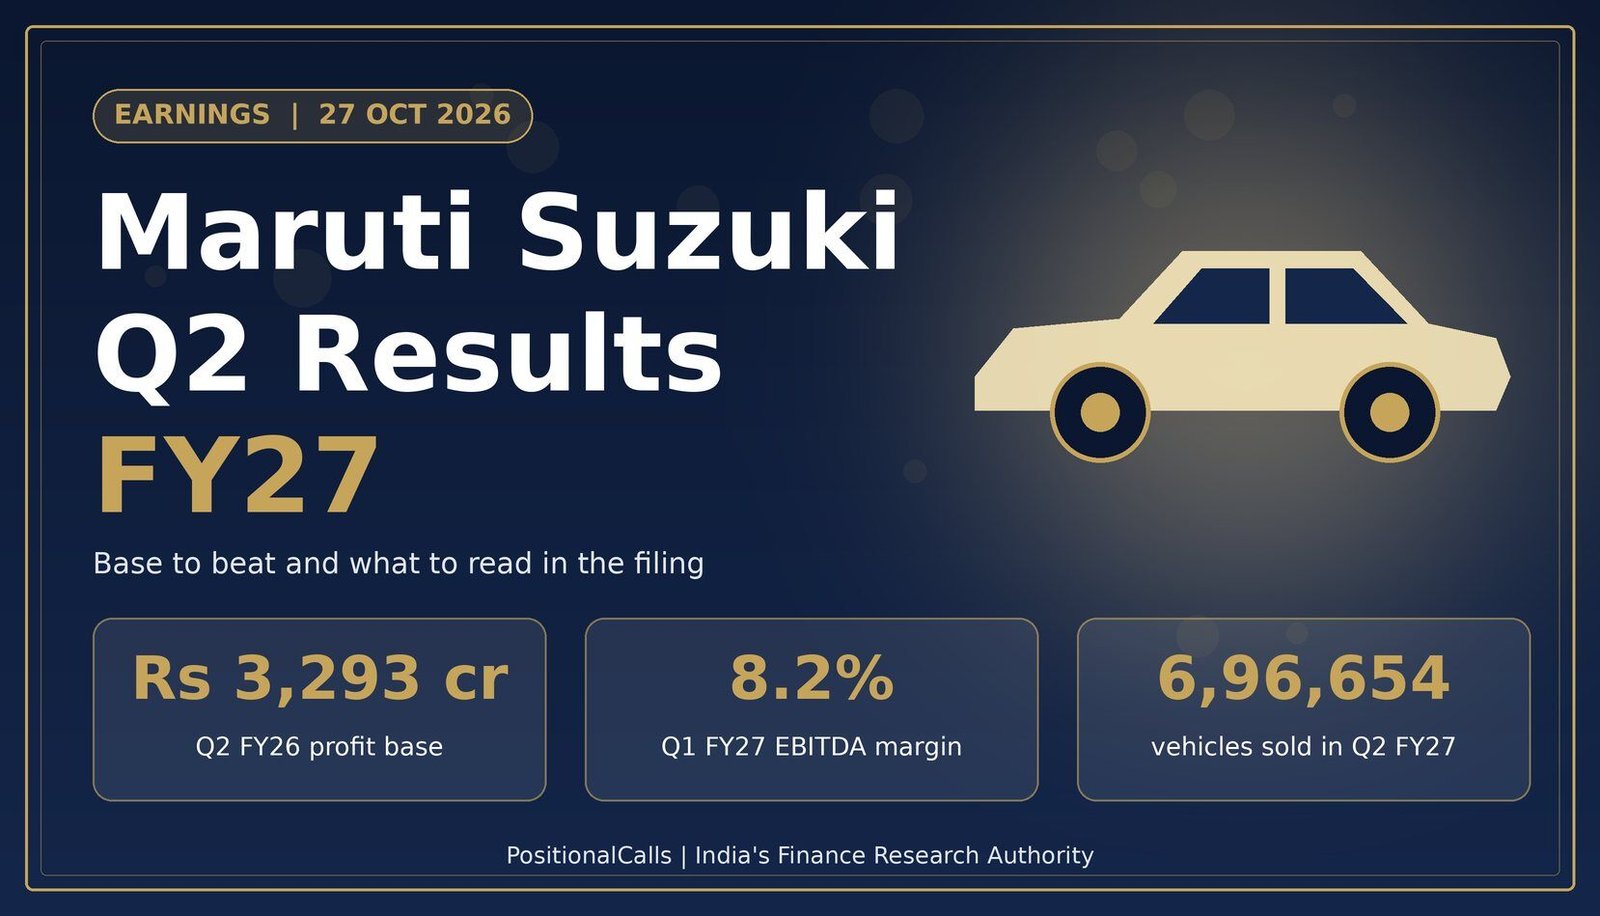
Earnings · Auto Q2 FY27
Volumes are already known at 6,96,654 vehicles. What the filing must still answer is whether price hikes, mix and cost control can hold the EBITDA margin near the 8.2% of Q1 FY27 while revenue is estimated to rise by about 27%.
Quick answer
Maruti Suzuki Q2 results FY27 are scheduled for Tuesday, 27 October 2026, covering the quarter ended 30 September 2026. The base to beat is Rs 42,101 crore revenue, Rs 4,434 crore EBITDA and Rs 3,293 crore profit (standalone, Q2 FY26). Volumes are already known at 6,96,654 vehicles; the margin, not the sales count, is the open question.
Latest update (Tuesday, 27 October 2026, 1:00 PM IST): The board meets on 27 October 2026 to approve the unaudited results. The sources checked show no filed numbers yet. This page carries estimates reported on 26 October 2026 and will be rewritten into the analysis after the filing.
Key takeaways
- Date: board meeting on Tuesday, 27 October 2026 for the quarter ended 30 September 2026.
- Volumes (known): 6,96,654 vehicles, up 26.46% year on year and about 2.0% on Q1 FY27 (my calculation).
- Base to beat: Rs 42,101 crore revenue, Rs 4,434 crore EBITDA at 10.53%, Rs 3,293 crore profit (standalone Q2 FY26).
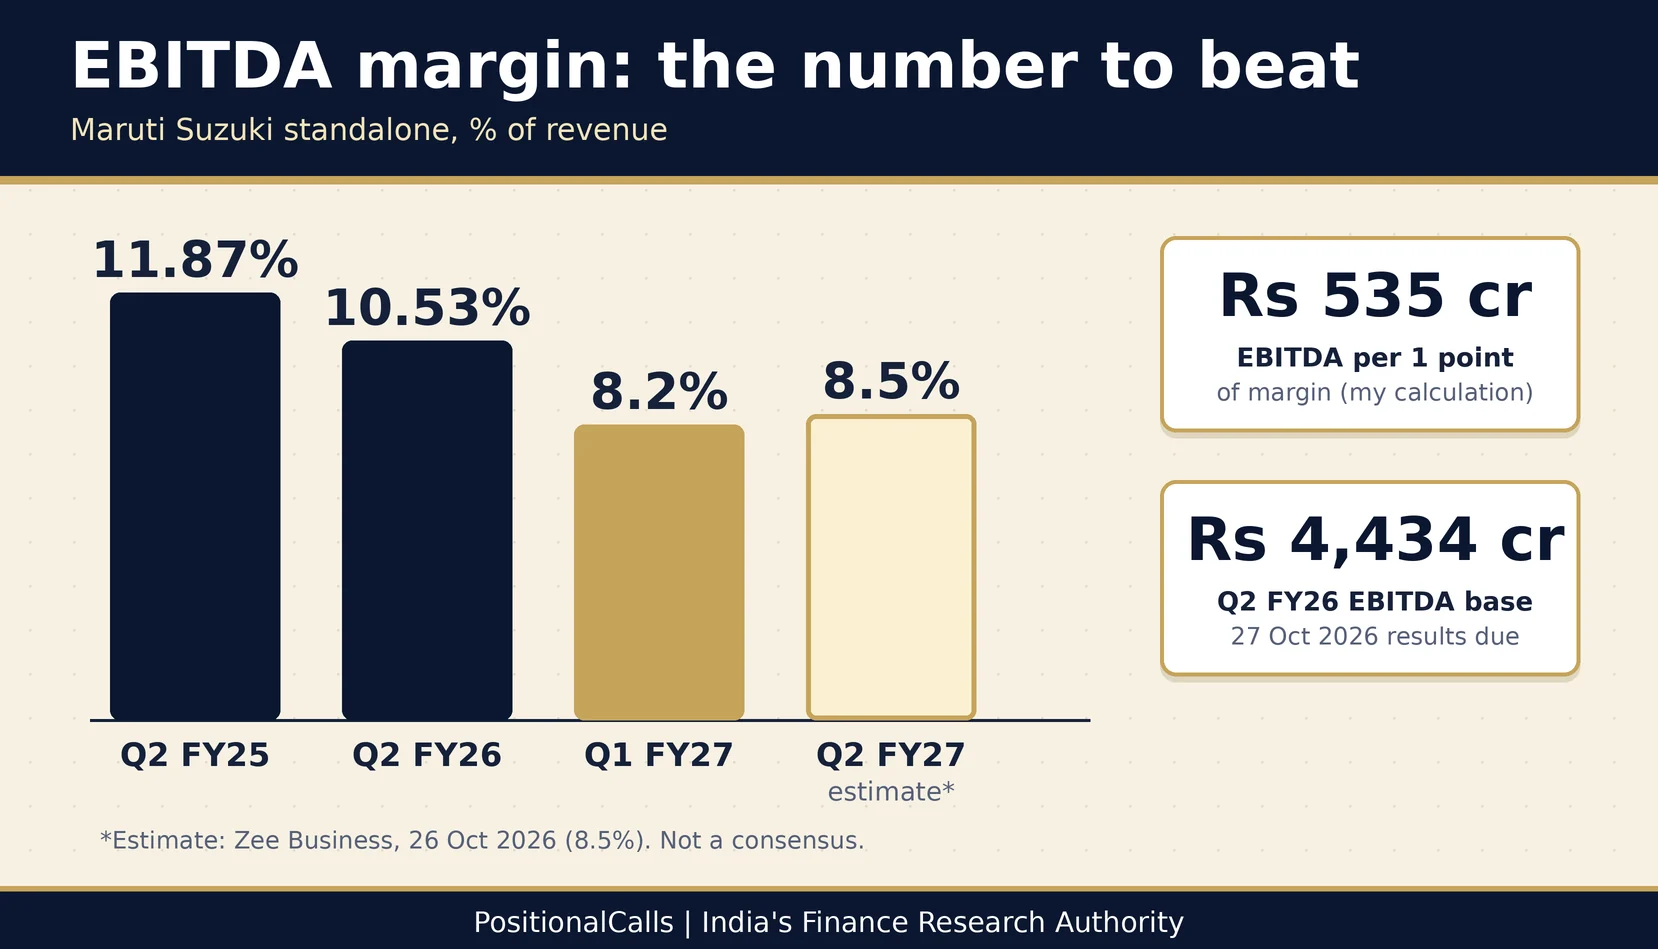
- Margin test: EBITDA margin was 8.2% in Q1 FY27; each 1 percentage point on Rs 53,465 crore revenue is about Rs 535 crore EBITDA (my calculation).
- Estimates differ: Zee Business sees profit down about 14% to Rs 2,832 crore; there is no confirmed consensus.
In plain words: EBITDA is operating profit before interest, tax, depreciation and amortisation. EBITDA margin is EBITDA divided by revenue. A carmaker can sell more cars and still earn less per car if metal, energy and other input costs rise faster than prices.
Data note: estimates are as reported on 26 and 27 October 2026 and are not a consensus. Year-ago figures are standalone and come from secondary reports of the Q2 FY26 filing; the exchange filing is final. Volumes come from Maruti Suzuki’s monthly sales releases. All as of Tuesday, 27 October 2026, 1:00 PM IST.
What is the base to beat in Maruti Suzuki Q2 results FY27?
The base to beat is Rs 42,101 crore revenue, Rs 4,434 crore EBITDA at a 10.53% margin and Rs 3,293 crore standalone profit from Q2 FY26 (July–September 2025). Q1 FY27 is the second yardstick, because it shows where costs stood in the quarter to 30 June 2026.
| Metric (standalone) | Q2 FY26 (year ago) | Q1 FY27 (previous quarter) | Why it matters |
|---|---|---|---|
| Revenue from operations | Rs 42,101 crore | Rs 52,456 crore | Sets the scale of growth |
| EBITDA | Rs 4,434 crore | Rs 4,311 crore | Operating profit before other income |
| EBITDA margin | 10.53% | 8.2% | The number most likely to move the result |
| Profit after tax | Rs 3,293 crore | Rs 3,352 crore | Bottom line after other income, depreciation, tax |
| Vehicles sold | 5,50,874 | 6,82,724 | Volume is a known input |
| Revenue per vehicle (my calculation) | Rs 7.64 lakh | Rs 7.68 lakh | Shows price and mix; includes spares and other revenue |
Cite this table: PositionalCalls.com, “Maruti Suzuki Q2 FY27 base-to-beat table”, as of 27 October 2026.
Maruti Suzuki reports standalone and consolidated numbers, so Maruti Suzuki Q2 results FY27 can read differently on each. For Q2 FY26 the consolidated profit was Rs 3,349 crore on revenue of Rs 42,344 crore, as reported. Brokers do not always use the same basis, so compare like with like before calling anything a beat or a miss. As a quick check, profit was 74.3% of EBITDA in Q2 FY26 (3,293 divided by 4,434) and 77.8% in Q1 FY27 (3,352 divided by 4,311). That gap between EBITDA and profit is why other income and depreciation need a look.
When will Maruti Suzuki announce its Q2 results?
Maruti Suzuki Q2 results FY27 are due after the board meets on Tuesday, 27 October 2026 to approve the unaudited results for the quarter ended 30 September 2026; the company told the exchanges on 8 October 2026. The exact filing time was not confirmed in the sources checked as of 27 October 2026, 1:00 PM IST. For Q1 FY27 the announcement was reported for 5:15 PM IST on 31 July 2026.
| Date | Event | Status |
|---|---|---|
| 31 July 2026 | Q1 FY27 results (reported schedule 5:15 PM IST) | Filed; used as the previous-quarter yardstick |
| 1 October 2026 | September 2026 sales release (236,013 units) | Published by the company |
| 8 October 2026 | Board meeting date intimated to exchanges | Confirmed |
| 27 October 2026 | Board approves Q2 FY27 unaudited results | Scheduled; numbers not seen as of 1:00 PM IST |
When Maruti Suzuki Q2 results FY27 are filed, read them first on the company’s investor Financials page or on the BSE stock page for scrip 532500. Media summaries arrive minutes later and sometimes mix standalone and consolidated figures.
How many vehicles did Maruti Suzuki sell in Q2 FY27?
Ahead of Maruti Suzuki Q2 results FY27, volumes are already known: the company sold 6,96,654 vehicles in July–September 2026, up 26.46% from 5,50,874 a year earlier, with domestic passenger vehicles up 38.11% and exports down 2.14% (as reported from the company’s monthly releases).
| Segment | Q2 FY27 units | Change vs Q2 FY26 |
|---|---|---|
| Domestic passenger vehicles | 5,55,012 | +38.11% |
| Light commercial (Super Carry) | 10,441 | +23.46% |
| Exports | 1,08,119 | -2.14% |
| Supplies to other OEMs (Toyota) | 23,082 | -23.20% |
| Total | 6,96,654 | +26.46% |
Cite this table: PositionalCalls.com, “Maruti Suzuki Q2 FY27 volume table”, as of 27 October 2026.
For Maruti Suzuki Q2 results FY27 the segments add up to the total: 5,55,012 plus 10,441 plus 1,08,119 plus 23,082 is 6,96,654. By month, July was 2,41,421 and September 2,36,013, which implies about 2,19,220 for August (my calculation from the quarter total). Q2 volume is about 2.0% above the 6,82,724 of Q1 FY27 (my calculation).
Mix matters. Exports were about 15.5% of Q2 FY27 volume against about 20.1% a year earlier (my calculation), so the quarter leaned on the domestic market. Maruti Suzuki also described the quarter as its best ever for domestic sales, as reported.
What are brokerages expecting for the Maruti Suzuki Q2 profit?
Estimates for Maruti Suzuki Q2 results FY27 point to revenue up roughly 27–28% but a lower margin and lower profit; no confirmed consensus figure was found in the sources I could open. Treat each row as one view, not a benchmark.
| Source (as reported) | Revenue | EBITDA | Profit | Volume |
|---|---|---|---|---|
| Zee Business, 26 Oct 2026 | Rs 53,465 crore (+27%) | Rs 4,556 crore (+2.8%); margin 8.5% vs 10.5% | Rs 2,832 crore (-14%) | 6.96 lakh (+26.5%) |
| Citi, 8 Oct 2026 (via an aggregator) | +28.5% | -11.6% | Not stated | +26.5% |
The two views differ most on EBITDA: one has it slightly up, the other down by double digits. Zee’s profit estimate also implies profit of 62.2% of EBITDA (2,832 divided by 4,556, my calculation), well below the 74.3% and 77.8% seen above. I cannot tell from the report whether that reflects lower other income, higher depreciation or tax, so the filing is the place to look.
Two operating facts frame the debate on Maruti Suzuki Q2 results FY27. In the Q1 FY27 call, management pointed to higher commodity and energy costs and said margin pressure should ease in Q2 as price increases take effect (as summarised by Investing.com). The Kharkhoda plant started in May 2026 and the fourth Hansalpur plant in July 2026, lifting capacity to 29 lakh units a year (as reported by Motilal Oswal); new plants can add depreciation and start-up cost.
PositionalCalls WhatsApp channel
Follow Maruti Suzuki’s Q2 filing as it lands
- A note when the Q2 FY27 numbers are filed and this page is rewritten
- The base-to-beat table updated with the actual figures
- Plain-English results explainers through the Q2 season
What should you read first in the Maruti Suzuki filing?
To read Maruti Suzuki Q2 results FY27 well, take six things in order: the basis, the EBITDA margin, revenue per vehicle, other income and depreciation, the export and Toyota mix, and management commentary.
- Confirm the basis. Note whether the headline is standalone (base Rs 3,293 crore) or consolidated (base Rs 3,349 crore).
- Find the EBITDA margin. Compare it with 10.53% a year ago and 8.2% in Q1 FY27, then look at material cost as a share of revenue.
- Divide revenue by vehicles. Compare with Rs 7.64 lakh and Rs 7.68 lakh to see whether price hikes offset mix.
- Check other income and depreciation. They explain the gap between EBITDA and profit.
- Check exports and Toyota supplies. Both were lower in the quarter, as reported.
- Read the commentary. Q1 FY27 reported an order book of about 1,30,000 units, dealer inventory of 13 days and a roughly 10% volume growth guide for FY27 (as reported).
How much does EBITDA margin change the Maruti Suzuki Q2 result?
For Maruti Suzuki Q2 results FY27, on Rs 53,465 crore of revenue, each 1 percentage point of EBITDA margin is about Rs 535 crore, and the gap between 10.53% and 8.2% is about Rs 1,246 crore. These are own calculations with stated assumptions, not forecasts. Revenue is the Zee Business estimate, used only as a yardstick.
| EBITDA margin | EBITDA (my calculation) | Versus Q2 FY26 EBITDA of Rs 4,434 crore | Reading |
|---|---|---|---|
| 8.2% (Q1 FY27 level) | Rs 4,384 crore | -1.1% | 27% more revenue, slightly lower EBITDA |
| 8.5% (Zee estimate) | Rs 4,556 crore (Zee figure) | +2.8% | Costs absorb most of the growth |
| 9.5% (illustrative) | Rs 5,079 crore | +14.6% | Partial margin recovery |
| 10.53% (Q2 FY26 level) | Rs 5,630 crore | +27.0% | EBITDA grows in line with revenue |
Cite this table: PositionalCalls.com, “Maruti Suzuki EBITDA margin sensitivity table”, as of 27 October 2026.
Arithmetic: 53,465 multiplied by 8.2% is 4,384; by 9.5% is 5,079; by 10.53% is 5,630. The 2.33-point gap between 10.53% and 8.2% equals 2.33 times 534.65, or about 1,246. That is more than 28% of the year-ago EBITDA.
What changed and when: the GST 2.0 base effect
The base effect matters for Maruti Suzuki Q2 results FY27: from 22 September 2025, GST on small petrol and CNG cars up to 1,200 cc and 4 metres fell from 28% plus cess to 18%, so the year-ago quarter had only about nine days of the lower prices. Maruti Suzuki announced price cuts of up to Rs 1.29 lakh from the same date, as reported.
| Category | Before 22 Sep 2025 | From 22 Sep 2025 |
|---|---|---|
| Petrol/CNG up to 1,200 cc, up to 4 m | 28% + 1% cess (about 29%) | 18% |
| Diesel up to 1,500 cc, up to 4 m | 28% + 3% cess (about 31%) | 18% |
| Larger cars and SUVs | 28% + up to 22% cess | 40%, no cess |
The nine days run from 22 to 30 September 2025 (my count). My reading: Q2 FY27 compares a full quarter at the lower small-car prices with a base that was mostly at the old prices. That helps volume growth more than it helps margin, which is why a 38% rise in domestic passenger vehicles can sit alongside a lower margin. Rates are as reported by secondary sources; the GST Council notification is the primary document.
Results-day checklist and common mistakes
- Open the exchange filing for Maruti Suzuki Q2 results FY27, not a forwarded screenshot.
- Note standalone or consolidated, then compare with the matching base.
- Write down EBITDA margin and compare with 10.53% and 8.2%.
- Divide revenue by 6,96,654 vehicles and compare with Rs 7.64 lakh.
- Check other income, depreciation and any one-off item.
- Read the commentary on costs, order book and exports.
- Update your own view after the call, not before.
What you need: nothing beyond the filing to read results; a demat account only if you trade. Costs and tax: brokerage and charges differ by broker, so check your broker’s current schedule; for tax on gains, read our capital gains tax on shares guide or ask a tax adviser.
Analyst’s note
- What stands out: in Maruti Suzuki Q2 results FY27 volume is no longer uncertain, so any surprise must come from margin, other income or one-off items.
- Easy to miss: the gap between estimates of EBITDA and profit is as wide as the gap on revenue. Check depreciation and other income.
- What would change the reading: a margin well above 8.5% would suggest price hikes and cost control are working; a margin near 8% would suggest costs are still ahead.
- Plain caution: one quarter in a cyclical business is a single data point, and this page gives no target or advice.
- Reader action: write down the three numbers above before the filing, then compare.
Bottom line
The base to beat in Maruti Suzuki Q2 results FY27 is Rs 42,101 crore revenue, 10.53% EBITDA margin and Rs 3,293 crore profit. Volumes are known; the margin and the gap down to profit are not. This page will be rewritten with the actual numbers after the filing on 27 October 2026.
Next read: Paytm Q2 results FY27
Part of our Q2 FY27 results series, with Infosys, Reliance, Bajaj Finance and Eternal.
PositionalCalls WhatsApp channel
Maruti Suzuki’s margin read, right after the filing
- A post-results look at margin, mix and commentary
- A dated calendar of the big Q2 FY27 results
- Tax and demat explainers when the rules change
FAQs on Maruti Suzuki Q2 results FY27
When are Maruti Suzuki Q2 results FY27?
Maruti Suzuki’s board meets on Tuesday, 27 October 2026 to approve unaudited results for the quarter ended 30 September 2026. The company told exchanges on 8 October 2026. The filing time was not confirmed in the sources checked as of 27 October 2026, 1:00 PM IST.
What is the base to beat in Maruti Suzuki Q2 results FY27?
On a standalone basis, Q2 FY26 revenue was Rs 42,101 crore, EBITDA Rs 4,434 crore (10.53% margin) and profit Rs 3,293 crore, as reported. Consolidated profit was Rs 3,349 crore. Check which basis the company headline uses.
How many vehicles did Maruti Suzuki sell in Q2 FY27?
Maruti Suzuki sold 6,96,654 vehicles in July–September 2026, up 26.46% from 5,50,874 a year earlier, as reported. Domestic passenger vehicles rose 38.11%, while exports fell 2.14%. September 2026 sales were 2,36,013 units.
What is the Maruti Suzuki Q2 profit estimate?
Zee Business, on 26 October 2026, estimated Q2 FY27 profit of Rs 2,832 crore, down about 14%, on revenue of Rs 53,465 crore. Other reports differ. No confirmed consensus figure was found, so treat every estimate as one view.
Why is the EBITDA margin the key number in Maruti Suzuki Q2 results?
Volumes are already known, so surprises can only come from cost and price. EBITDA margin was 8.2% in Q1 FY27 against 10.53% in Q2 FY26. On Rs 53,465 crore revenue, each 1 percentage point is about Rs 535 crore of EBITDA (my calculation).
What were Maruti Suzuki’s Q1 FY27 results?
As reported by Axis Securities, Q1 FY27 standalone revenue was Rs 52,456 crore, EBITDA Rs 4,311 crore, margin 8.2% and adjusted profit Rs 3,352 crore, down about 10% year on year. The order book was about 1,30,000 units.
Where can I check Maruti Suzuki Q2 results FY27?
Read the filing on BSE under scrip code 532500, on NSE under the symbol MARUTI, or on the company’s investor Financials page. Exchange filings and the company site are the primary sources; news summaries can contain errors.
No. This page explains the numbers to read in Maruti Suzuki Q2 results FY27. It gives no price target and no advice to buy, hold or sell. Investments in securities markets are subject to market risks. Returns are never guaranteed.
Sources
- Maruti Suzuki, sales in September 2026 (press release, 1 October 2026)
- Maruti Suzuki investor Financials page
- BSE stock information, scrip 532500
- Zee Business, Maruti Suzuki Q2 preview (26 October 2026)
- Axis Securities and Anand Rathi Q1 FY27 result updates (August 2026)
- Motilal Oswal Q1 FY27 summary, via DSIJ; Samco, IANS and Motilal Oswal reports on Q2 FY26 results
- PSU Connect (board meeting date); Citi note via ad-hoc-news; Investing.com earnings-call summary
- DriveSpark and Autocar Professional (monthly and quarterly volumes); Onmanorama and Evo India (GST 2.0 rates)
Editorial disclosure: PositionalCalls.com is an independent Indian stock market research and education site founded by Shubham Chaudhary. PositionalCalls.com is not a SEBI-registered research analyst or investment adviser. Investments in securities markets are subject to market risks. Read all related documents carefully before investing. Returns are never guaranteed. This page carries no price target and no advice to buy, hold or sell. How I researched this: I compared Maruti Suzuki’s monthly sales releases with reported year-ago and Q1 FY27 figures, recalculated every derived number, and labelled estimates as reported.

Shubham Chaudhary is the founder of PositionalCalls, an independent Indian stock market research website. He writes company fundamentals, quarterly results analysis, IPO analysis and sector research for NSE and BSE listed companies, with a focus on banking stocks, insurance and long-term value investing. Every article is built from primary sources such as RBI, SEBI, NSE and BSE filings and company annual reports, and states its risks plainly in simple language for retail investors.
Coverage areas Our research standards- Numbers checked against NSE, BSE and SEBI filings
- Risks and limits stated in every article
- No paid promotions or broker tie-ups
- Articles updated when new filings arrive