
Earnings · Dabur India
Dabur reported its September quarter after market hours on 4 November 2026: profit up 11.7%, revenue up 11.6%, a Rs 3.50 interim dividend and a change at the top. Here is how the numbers compare with the guidance, the estimate and the base, what the dividend dates really mean, and what the stock did first.
Quick answer
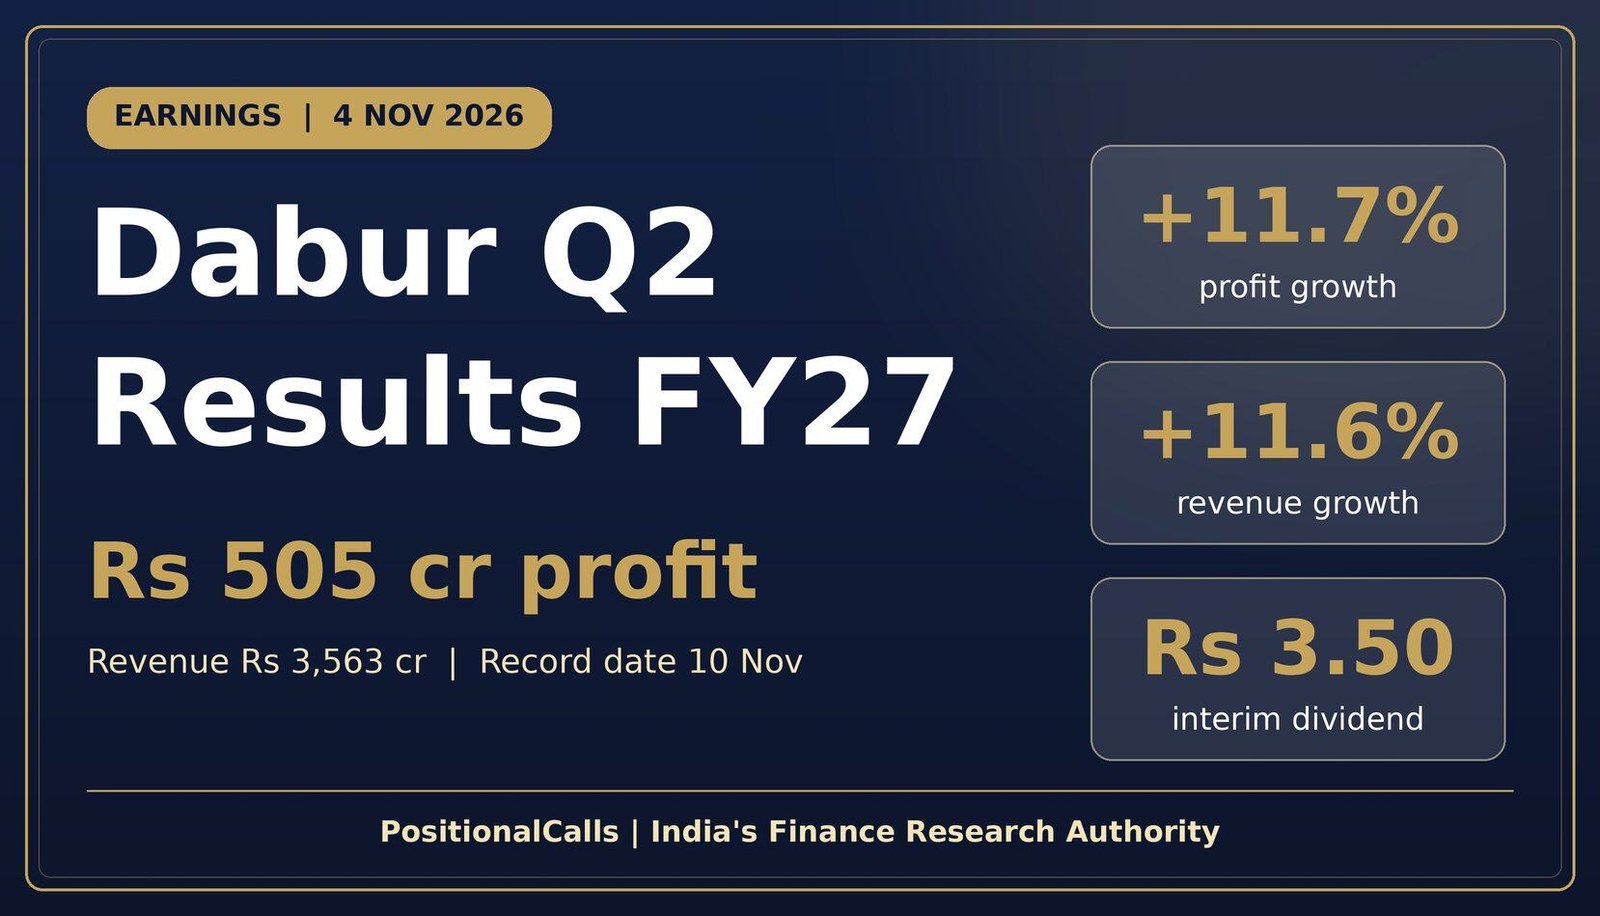
Dabur Q2 results FY27, filed on Wednesday, 4 November 2026, show consolidated profit of Rs 505.50 crore (+11.7%) on revenue of Rs 3,563.07 crore (+11.6%), above its double-digit guidance. The board declared a Rs 3.50 interim dividend with a record date of 10 November 2026.
Latest update (Thursday, 5 November 2026, 6:45 AM IST): Dabur filed its Q2 FY27 results after market hours on 4 November 2026. The stock had already closed up about 3.5% at Rs 394.10 on the BSE before the numbers, so the first trading reaction arrives at the 9:15 AM IST open on 5 November 2026 and is not yet confirmed. An in-person analyst meet follows at 4:00 PM IST; there is no earnings call.
- Saturday, 31 October 2026, 4:00 PM IST: preview published with the Rs 3,191.32 crore revenue base and the double-digit guidance.
Key takeaways
- Results: profit attributable to owners Rs 505.50 crore (+11.7%) on revenue of Rs 3,563.07 crore (+11.6%), the fourth straight double-digit profit quarter as reported.
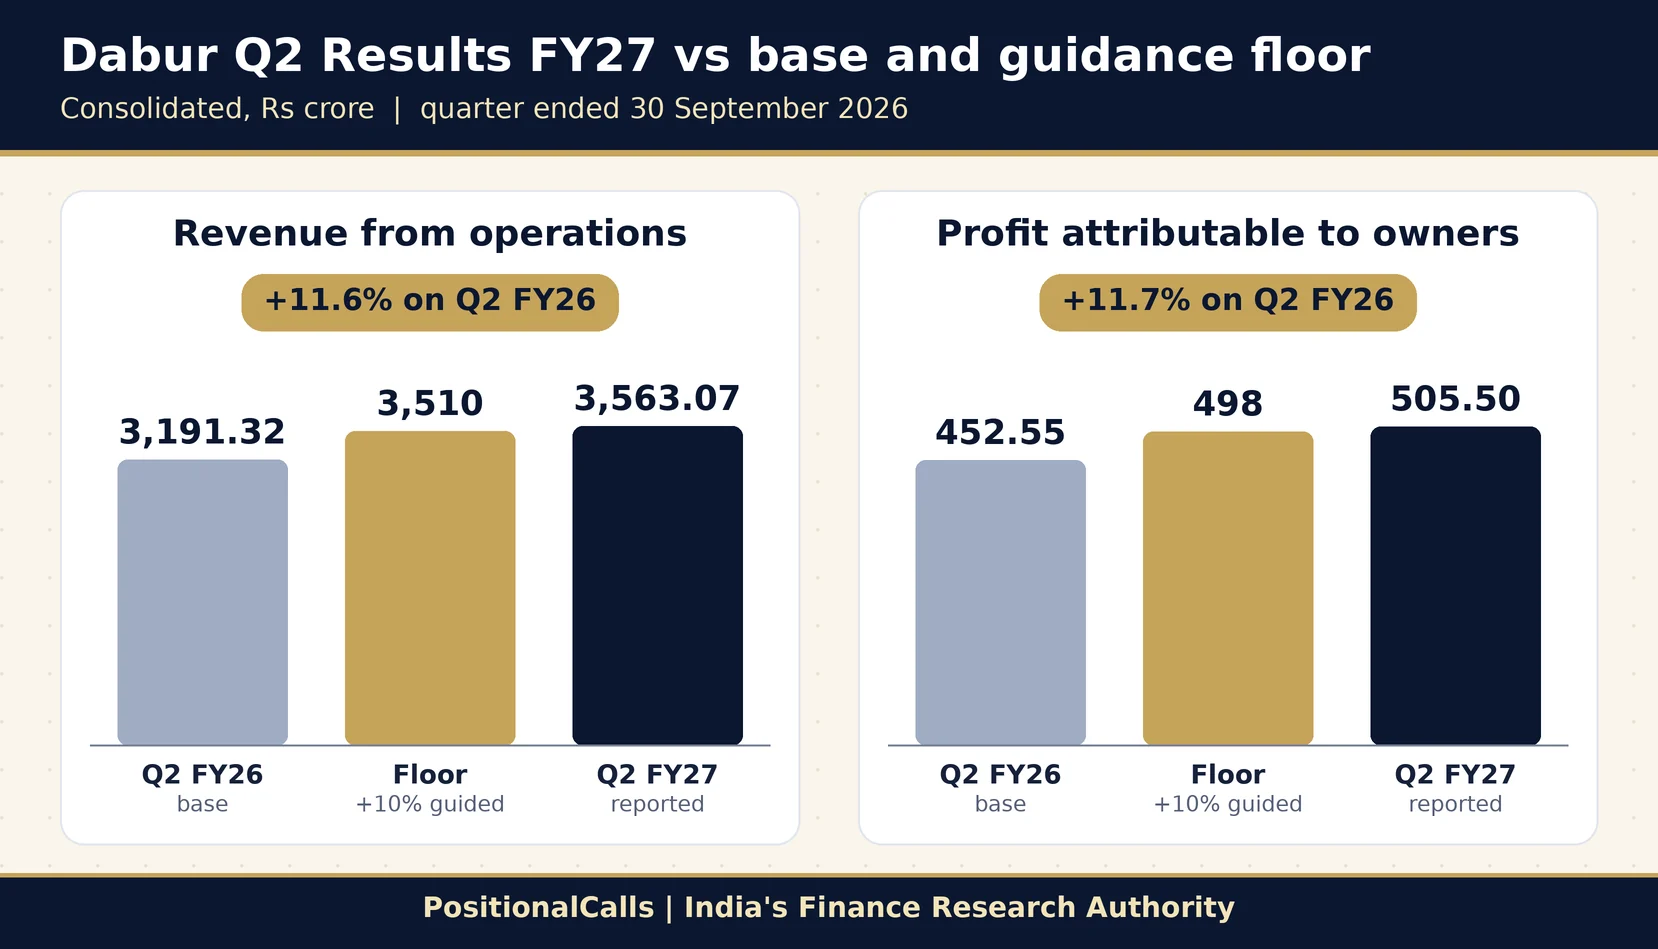
- Versus guidance: the floor was about Rs 3,510 crore and Rs 498 crore; both were cleared by roughly 1.5% (my calculation).
- Volume: India FMCG grew 10.7% with 5.5% underlying volume growth, against about 2% a year earlier.
- Margin: broadly flat near 18% on the aggregator basis, but EBITDA lines differ between reports.
- Dividend: Rs 3.50 interim, record date Tuesday, 10 November 2026 (an exchange holiday), payment from 25 November.
- Share price: closed Rs 394.10 on the BSE before the results; the post-results reaction is not yet confirmed.
- Leadership: Global CEO Mohit Malhotra leaves on 13 November; Herjit Bhalla joins the board on 14 November, as reported.
In plain words: Dabur makes Chyawanprash, Real juices, Hajmola, hair oils and home-care products in India and abroad. “Consolidated” covers the whole group; “standalone” is Dabur India Limited alone. An “interim dividend” is paid during the year, before the final dividend is voted on. A “base” is the same quarter last year.
Data note: as of Thursday, 5 November 2026, 6:45 AM IST. Figures come from Dabur’s Q2 FY27 results as carried by reports of the exchange filing (Upstox, Free Press Journal, Business Today, Business Standard) and aggregator pages; I have not opened the filing PDF itself. The EBITDA lines differ between reports and are shown side by side. Derived numbers are marked “my calculation”. The Rs 453 crore profit base in the 31 October preview was rounded; the reported base is Rs 452.55 crore.
What are the Dabur Q2 results FY27 in numbers?
Dabur’s consolidated revenue from operations rose 11.6% to Rs 3,563.07 crore and profit attributable to owners rose 11.7% to Rs 505.50 crore in the quarter ended 30 September 2026, per reports of the filing.
| Consolidated, Rs crore | Q2 FY26 (base) | Q2 FY27 | Change | Why it matters |
|---|---|---|---|---|
| Revenue from operations | 3,191.32 | 3,563.07 | +11.6% | Second straight double-digit quarter |
| Profit attributable to owners | 452.55 | 505.50 | +11.7% | Fourth straight double-digit profit quarter |
| H1 revenue (my calculation) | 6,595.90 | 7,327.46 | +11.1% | Q1 Rs 3,764.39 crore plus Q2 |
| H1 profit to owners (my calculation) | 966.46 | 1,096.38 | +13.4% | Q1 Rs 590.88 crore plus Q2 |
| India FMCG growth | volume about 2% | +10.7%, volume +5.5% | volume up 3.5 points | Growth is more volume-led than a year ago |
Cite this table: PositionalCalls, “Dabur Q2 Results FY27 Scorecard, as of 5 November 2026”.
Sequentially, revenue was 5.3% below the Rs 3,764.39 crore of Q1 FY27 and profit was 14.4% below Rs 590.88 crore (my calculation). That is the usual seasonal dip, because Q2 is Dabur’s weakest quarter for margin. Compare the Dabur Q2 results FY27 with Q2 FY26, not with Q1.
Did the Dabur Q2 results FY27 beat guidance and the estimate?
On the headline numbers, yes: revenue and profit cleared the double-digit floor by about 1.5%, and growth came in ahead of the one pre-results estimate I found.
| Item | 31 Oct preview said | Reported on 4 Nov | Reading |
|---|---|---|---|
| Results date | Board meeting 4 Nov | Filed after market hours, 4 Nov | Date confirmed |
| Revenue floor | About Rs 3,510 crore (+10%) | Rs 3,563.07 crore | Above by Rs 52.6 crore (my calculation) |
| Profit floor | About Rs 498 crore (+10%) | Rs 505.50 crore | Above by Rs 7.7 crore (my calculation) |
| International | Guided high teens in rupees | +20% in rupees | Ahead of guidance |
| Margin | Pressured by inflation | About 18% on one basis; material cost +13.0% | Held, with caveats |
| Dividend | “Possible” interim | Rs 3.50, record date 10 Nov | Declared |
Cite this table: PositionalCalls, “Dabur Q2 Results FY27 Guidance Versus Actual, as of 5 November 2026”.
The pre-results estimate comes from one report. HDFC Securities, as quoted in a news report, expected about 11% revenue growth, 8% EBITDA growth, 9% adjusted profit growth, an EBITDA margin near 18% and a gross margin near 48%. That is “one reported estimate”, not a consensus.
| Line | One reported estimate | Reported | Gap |
|---|---|---|---|
| Revenue growth | About +11% (about Rs 3,542 crore) | +11.6% (Rs 3,563.07 crore) | About 0.6% above (my calculation) |
| EBITDA growth | About +8% | +12.7% or +10.5%, depending on the report | Above on both bases |
| Profit growth | About +9% adjusted (about Rs 493 crore) | +11.7% reported (Rs 505.50 crore) | Above; adjusted profit not confirmed |
| EBITDA margin | About 18%, down 50 bps | About 18.1%, up 10 bps (one basis) | Better than feared |
| Gross margin | About 48%, down 140 bps | About 48.8%, down about 60 bps (my calculation) | Better than feared |
Cite this table: PositionalCalls, “Dabur Q2 Results FY27 Estimate Versus Actual, as of 5 November 2026”.
The estimate used adjusted profit, while reported figures are unadjusted, so treat the gaps as direction, not precision.
What is the Dabur Q2 net profit FY27, and which profit line is right?
Use Rs 505.50 crore, the profit attributable to owners, against Rs 452.55 crore in Q2 FY26; headlines that say “Rs 505 crore” are rounding the same figure.
| Line | Figure | What it is | What to do |
|---|---|---|---|
| Profit attributable to owners, Q2 FY27 | Rs 505.50 crore (+11.7%) | Group profit after minority interest | Use this for growth rates |
| Profit attributable to owners, Q2 FY26 | Rs 452.55 crore | The base; the preview rounded it to Rs 453 crore | Use as the base |
| “Net profit Rs 505 crore” | Rs 505 crore | The same figure, rounded in headlines | Match the exact line |
| Q2 FY26 “profit Rs 444.79 crore” | Rs 444.79 crore | One 2025 report; likely profit for the period (my reading, not confirmed) | Do not mix with owners’ profit |
| Standalone profit | Differs from group | Dabur India Limited alone; Q1 FY27 standalone was Rs 452.41 crore | Check the scope label first |
Cite this table: PositionalCalls, “Dabur Q2 Results FY27: Dabur Q2 Net Profit FY27 Definitions Table, as of 5 November 2026”.
The scope trap from the preview still applies. In Q1 FY27 a standalone profit of Rs 452.41 crore was quoted as the headline on some pages, while the group figure was Rs 590.88 crore. Before you compare any two Dabur profit numbers, confirm both are consolidated and both are attributable to owners.
How did Dabur’s segments and international business perform?
India FMCG grew 10.7% with 5.5% underlying volume growth, home and personal care 10.9%, food and beverages 17.4%, healthcare 6.9% and the international business 20% in rupee terms.
| Business | Q2 FY27 growth | What drove it | Earlier marker |
|---|---|---|---|
| India FMCG | +10.7% | Underlying volume +5.5%; premium brands grew 4x the pace of regular brands | India volume about 2% in Q2 FY26 |
| Home and personal care | +10.9% | Shampoo and hair oils high double-digit; home care double-digit; skin and salon high single-digit; oral care mid single-digit | Not quantified in the preview |
| Food and beverages | +17.4% | Sequential recovery in foods and beverages | Not quantified in the preview |
| Healthcare | +6.9% | Digestives, OTC and ethicals grew double-digit | Chyawanprash is the winter swing factor |
| International (INR) | +20% | Bangladesh, Egypt, Sub-Saharan Africa and Turkey | +7.7% in Q2 FY26; H1 FY27 +19.4% |
| General trade channel | Mid to high single-digit | Resurgence under Project Saksham, per the CEO | Premium is 20% of domestic sales |
Cite this table: PositionalCalls, “Dabur Q2 Results FY27 Segment Table, as of 5 November 2026”.
Of the 10.7% India growth, 5.5 points were volume, so about 5.2 points came from price and mix (my calculation). That is a healthier split than a quarter led by price increases alone.
What happened to the Dabur Q2 EBITDA margin?
On the aggregator basis the margin was about 18.1%, almost flat on 18.0%; a second report shows 22.6% on a different EBITDA line, so the margin direction is flat but the level depends on the definition.
| EBITDA line (Rs crore) | Q2 FY27 | Q2 FY26 | Change | Margin |
|---|---|---|---|---|
| Aggregator A (IncredMoney) | 645.82 | 573.12 | +12.7% | 18.1% vs 18.0% |
| Aggregator B (Upstox) | 804.3 | 728.2 | +10.5% | 22.6% vs 22.8% |
| Earlier preview basis (Q2 FY26 only) | Not published on this basis | 588.7 | n/a | 18.4% in Q2 FY26 |
| Operating margin, another line | 17.75% | 18.43% | down 0.7 point | Different definition |
Cite this table: PositionalCalls, “Dabur Q2 Results FY27: Dabur Q2 EBITDA Margin FY27 Definitions, as of 5 November 2026”.
Why the lines differ is not confirmed; other income and one-off items are likely causes (my reading). Use the company’s own EBITDA line and compare it with the same line a year earlier.
| Cost line | Q2 FY27 | Q2 FY26 | Change |
|---|---|---|---|
| Material cost (Rs crore) | 1,822.7 | 1,613.5 | +13.0% |
| Revenue (Rs crore) | 3,563.07 | 3,191.32 | +11.6% |
| Material cost as % of revenue (my calculation) | 51.2% | 50.6% | up 0.6 point |
| Implied gross margin (my calculation) | 48.8% | 49.4% | down about 60 bps |
Cite this table: PositionalCalls, “Dabur Q2 Results FY27: Dabur Material Cost and Gross Margin Q2 FY27, as of 5 November 2026”.
Material cost rose faster than revenue, which squeezed gross margin by about 60 basis points on this crude measure. Dabur held the operating margin by spending and costing less elsewhere. A point of margin is worth about Rs 35.6 crore on this revenue, so small moves matter.
| Operating margin | Operating profit on Rs 3,563 crore | Reading |
|---|---|---|
| 17.0% | Rs 606 crore | Would show the inflation Dabur warned of |
| 18.1% | Rs 645 crore | About what was reported on aggregator A |
| 19.7% | Rs 702 crore | The Q1 FY27 margin; would signal relief |
Cite this table: PositionalCalls, “Dabur Q2 Results FY27: Dabur Margin in Rupees Table, as of 5 November 2026”.
What do the H1 FY27 numbers show?
H1 FY27 revenue was about Rs 7,327 crore (+11.1%) and profit about Rs 1,096 crore (+13.4%), slightly above the Rs 7,275 crore and Rs 1,089 crore that the floor of guidance implied.
| H1, Rs crore | H1 FY26 | Floor of guidance | H1 FY27 reported | Growth |
|---|---|---|---|---|
| Revenue | 6,595.90 | 7,274.84 | 7,327.46 | +11.1% |
| Profit to owners | 966.46 | 1,088.69 | 1,096.38 | +13.4% |
Cite this table: PositionalCalls, “Dabur Q2 Results FY27: Dabur H1 FY27 Versus Guidance Floor, as of 5 November 2026”.
Q1 delivered 10.6% revenue growth and 15.0% profit growth; Q2 delivered 11.6% and 11.7%. Revenue growth accelerated while profit growth slowed as costs rose, so the margin line decides whether profit keeps pace.
PositionalCalls WhatsApp channel
Dabur’s first session, in one message
- The open, high, low and close after the results
- Notes from the 4:00 PM IST analyst meet
- The ex-date once the exchange confirms it
What is the Dabur interim dividend 2026: amount, record date and ex-date?
Dabur declared an interim dividend of Rs 3.50 per share (350% of the Re 1 face value) for FY27, with a record date of Tuesday, 10 November 2026 and payment from 25 November 2026.
| Item | Detail |
|---|---|
| Amount | Rs 3.50 per equity share (350% of the Re 1 face value), interim, FY 2026-27 |
| Record date | Tuesday, 10 November 2026 |
| Payment | From 25 November 2026 |
| Total payout | About Rs 620.88 crore, as reported |
| Last year’s interim | Rs 2.75 declared in November 2025, so the new one is 27.3% higher (my calculation) |
| Yield on the 4 Nov close | About 0.9% (Rs 3.50 on Rs 394.10, interim only; my calculation) |
| Payout against H1 profit | About 56.6% of Rs 1,096.38 crore (my calculation) |
Cite this table: PositionalCalls, “Dabur Q2 Results FY27: Dabur Interim Dividend 2026 Fact Table, as of 5 November 2026”.
When is the last day to buy Dabur shares for the dividend?
Do not assume the record date is the ex-date. Tuesday, 10 November 2026 is an NSE and BSE holiday for Diwali-Balipratipada. Under T+1 settlement, the ex-date normally moves to the last trading day before a holiday record date.
- Record date: Tuesday, 10 November 2026, markets closed.
- Likely ex-date: Monday, 9 November 2026. A purchase on this day settles after the record date and does not qualify.
- Likely last cum-dividend purchase: Friday, 6 November 2026. Sunday’s 8 November Muhurat session is a special case, so ask your broker.
- Confirm: the ex-date on the NSE or BSE corporate actions page before you trade.
This is my reading of the T+1 rules, not an exchange statement. Our Muhurat trading 2026 guide covers the Sunday session and the Tuesday holiday.
| Shares held | Dividend at Rs 3.50 | TDS at 10% (if over Rs 10,000) | Received (my calculation) |
|---|---|---|---|
| 500 | Rs 1,750 | none | Rs 1,750 |
| 2,000 | Rs 7,000 | none | Rs 7,000 |
| 3,000 | Rs 10,500 | Rs 1,050 | Rs 9,450 |
| 10,000 | Rs 35,000 | Rs 3,500 | Rs 31,500 |
Cite this table: PositionalCalls, “Dabur Q2 Results FY27: Dabur Rs 3.50 Dividend Worked Examples, as of 5 November 2026”.
TDS for residents is generally 10% when dividends from one company exceed Rs 10,000 in a financial year; confirm the current rule. Any earlier Dabur dividend paid to you since 1 April 2026 counts toward the same limit. Dividends are also taxed at your slab rate; see our guide to tax on shares.
What is the Dabur share price after Q2 results, and how did it react?
The post-results reaction is not yet confirmed as of 6:45 AM IST on 5 November 2026: Dabur reported after the close, and the stock had already risen 3.45% to Rs 394.10 on the BSE during the session on 4 November.
| Date | Level (Rs) | Source type | Note |
|---|---|---|---|
| Fri, 30 Oct 2026 | 366 (BSE close) | Broker preview report | Down about 27% in 2026 and about 14% in three months |
| Mon, 2 Nov 2026 | 373.90 (NSE close) | Aggregator | Previous close quoted on 3 Nov |
| Tue, 3 Nov 2026 | 380.95 (BSE close) | Business Today | NSE traded near 381.65 at 3:55 PM |
| Wed, 4 Nov 2026 | 394.10 (BSE close); about 395 (NSE) | Business Today; Upstox | Up 3.45% on the BSE; high 394.95, low 382.95; before results |
| Thu, 5 Nov 2026 | Not confirmed | Pending | First reaction at the 9:15 AM IST open |
Cite this table: PositionalCalls, “Dabur Q2 Results FY27: Dabur Share Price Before Q2 Results FY27, as of 5 November 2026”.
From the 30 October close to the 4 November close, the stock rose about 7.7% in three sessions (my calculation). Some of the good news may therefore be in the price before the filing. Market capitalisation was about Rs 70,071 crore on the NSE on 4 November, as reported.
How big are Dabur’s usual post-result moves?
| Event | Reported move | Reading |
|---|---|---|
| Q4 FY25 results (May 2025) | Fell as much as 4.36% to Rs 461.1 | A weak quarter drew a sharp fall |
| Q1 FY26 results (July 2025) | Rose as much as 3.53% to Rs 547.7 | A modest beat drew a gain |
| Q3 FY26 business update (January 2026) | Down 2.88% to Rs 506.25 at 9:18 AM | Mixed update, early fall |
| CEO reshuffle (February 2026) | Down 1.65% to Rs 508.25 at 9:45 AM | Leadership news moved the stock |
Cite this table: PositionalCalls, “Dabur Q2 Results FY27: Dabur Post-Result Price Moves, as of 5 November 2026”.
Moves of 3% to 4% either way are normal for Dabur. Once the session ends, I will add the open, high, low and close of the first session after the Dabur Q2 results FY27 to the Latest update box. No broker rating changes after the results were available in the sources I could open, and PositionalCalls does not publish its own ratings or targets.
| What to check in the first session | Compare with | Why it matters |
|---|---|---|
| Opening price | Rs 394.10 (BSE) and about Rs 395 (NSE) | A gap shows how far the numbers surprised |
| Volume | About 13 to 15 lakh shares a day on the BSE in late October, per a quote page | High volume makes a move more meaningful |
| Close against the day’s range | The day’s high and low | A close near the high shows buyers holding |
| Filing detail | EBITDA line, volume, cash flow | The filing can change the first read |
Cite this table: PositionalCalls, “Dabur Q2 Results FY27: Dabur First-Session Reaction Decoder, as of 5 November 2026”.
What changed at the top, and what else is Dabur dealing with?
Global CEO Mohit Malhotra’s resignation takes effect on 13 November 2026, and India CEO Herjit Bhalla joins the board as whole-time director from 14 November for five years, subject to approvals.
The reason is reported two ways. Business Standard says Malhotra is leaving to pursue personal interests. His letter, as quoted by Upstox, says he has accepted a leadership role overseas from 16 November. I have not seen the filing text, so both are attributed. Bhalla has led the India business since April 2026.
| Development | What was reported | Status |
|---|---|---|
| Global CEO exit | Malhotra leaves on 13 Nov 2026 after more than three decades at Dabur | Board accepted the resignation |
| Board seat | Bhalla joins as whole-time director from 14 Nov 2026 for five years | Subject to regulatory approvals |
| Sesa Care merger | Headline from Free Press Journal says the NCLT approved the merger with Dabur | Terms not checked |
| FSSAI “100%” claims | Headline says Dabur petitioned against a ban, with Rs 150 crore of inventory at risk | Details not checked |
Cite this table: PositionalCalls, “Dabur Q2 Results FY27 Corporate Developments, as of 5 November 2026”.
The management change adds uncertainty at a time when volume growth is only just recovering. Watch the 5 November analyst meet for the handover plan.
How do the Dabur Q2 results FY27 compare with other FMCG results?
Dabur’s 11.7% profit growth is ahead of HUL’s 3.9% and ITC’s standalone fall of 20.1%, while HUL grew revenue faster at 14.8% according to one comparison page.
| Company | Date | Headline | Our page |
|---|---|---|---|
| Dabur | Wed, 4 Nov 2026 | Profit Rs 505.50 crore (+11.7%); revenue +11.6% | This page |
| HUL | Reported before 3 Nov | Profit Rs 2,790 crore (+3.9%); record date 12 Nov, Rs 19 | Calendar hub |
| ITC | Mon, 2 Nov 2026 | Standalone profit Rs 4,137.12 crore, down 20.1% | ITC Q2 results FY27 |
| Marico | Mon, 2 Nov 2026 | Results analysis published | Marico Q2 results FY27 |
| Britannia | Thu, 5 Nov 2026 | Board meeting as reported | Britannia Q2 results FY27 |
| Titan | Thu, 5 Nov 2026 | Board meeting as reported | Titan Q2 results FY27 |
Cite this table: PositionalCalls, “Dabur Q2 Results FY27: FMCG Q2 FY27 Results Comparison, as of 5 November 2026”.
The figures use each company’s own definitions, so the table shows direction, not a ranking. For the full list of reported and scheduled results, use the Q2 results calendar hub.
What should you watch after the Dabur Q2 results FY27?
Watch volume, margin, the international business, the ex-date and the leadership handover, with the Q3 FY26 base of about Rs 3,559 crore revenue and Rs 734 crore operating profit as the next bar.
| Watch | Mark | Why |
|---|---|---|
| India volume | 5.5% in Q2 FY27 | Can it hold above 5% against a tougher base? |
| Operating margin | About 18% in Q2; Q3 FY26 was about 21% | Winter quarters carry higher margin; input costs are still rising |
| International growth | +20% in Q2; guided high teens earlier | Currency and Middle East risks remain |
| Q3 FY26 base | Revenue about Rs 3,559 crore; operating profit about Rs 734 crore (aggregator) | Sets the bar for the December quarter |
| Chyawanprash and winter demand | Q3 is the winter quarter | Healthcare grew only 6.9% in Q2 |
| Leadership | Exit 13 Nov; board seat 14 Nov | Handover quality shows in later commentary |
Cite this table: PositionalCalls, “Dabur Q2 Results FY27: Dabur Q3 FY27 Watchlist, as of 5 November 2026”.
The Q3 FY27 results date has not been announced. The earlier quarter is covered on our Dabur Q3 results FY26 page, which will carry a link to this one.
What do most people miss about the Dabur Q2 results FY27?
Most miss that the stock ran up before the filing, that the record date falls on a holiday, and that EBITDA is defined differently from report to report.
- Compare Q2 FY27 with Q2 FY26 first, then with Q1 FY27.
- Use consolidated figures and name the profit line.
- Check volume growth before revenue growth.
- Read the company’s own EBITDA line.
- Confirm the ex-date on the exchange before buying for the dividend.
What do you need to know about costs, tax and safety?
Trading costs and your holding period matter more than one quarter’s headline; never pay anyone for results alerts or tips.
- What you need: a demat and trading account; settlement is T+1.
- Costs: check your broker’s current charge schedule for brokerage, securities transaction tax, GST and stamp duty on each trade.
- Tax angle: dividends are taxed at your slab rate and gains by holding period; see tax on shares and ask a tax adviser if unsure.
- NRI note: see NRI investment in the Indian stock market.
- Scam warning: fake results alerts, paid “sure-shot” tips and KYC links on messaging apps are common. Never share an OTP.
Analyst’s note
- What stands out: in the Dabur Q2 results FY27, volume growth of 5.5% matters more than the profit figure, because it shows demand rather than price.
- Easy to miss: a profit rise of Rs 53 crore on a Rs 452.55 crore base is only a few crore above the guided floor, so the beat is small.
- What would change the view: volume below 4% or a margin drop in the winter quarter would suggest the recovery is narrower than Q2 shows.
- Caution: this is reasoning from reported numbers, not a forecast or a recommendation. No outcome is assured.
- Reader action: read the filing’s consolidated lines and confirm the ex-date before you act on the dividend.
Bottom line
Dabur Q2 results FY27 show profit of Rs 505.50 crore (+11.7%) and revenue of Rs 3,563.07 crore (+11.6%), a small beat on the guided floor, with 5.5% volume growth and a Rs 3.50 dividend. The record date, 10 November 2026, is a holiday, so check the ex-date. The post-results price reaction is not yet confirmed.
Next read: Q2 results calendar hub: who reported and who is next
Part of the Earnings series. The earlier quarter is covered on the Dabur Q3 results page.
PositionalCalls WhatsApp channel
Consumer results, without the noise
- Dabur, ITC, Marico and Titan numbers side by side
- Plain-language summaries of each filing
- Corrections flagged when a number changes
Frequently asked questions
When did Dabur announce its Q2 results FY27?
Dabur’s board approved the Q2 and H1 FY27 results on Wednesday, 4 November 2026, and the company reported after market hours. It held no earnings call, but an in-person analyst meet is set for 4:00 PM IST on Thursday, 5 November 2026.
What is the Dabur Q2 net profit FY27?
Consolidated profit attributable to owners was Rs 505.50 crore, up 11.7% from Rs 452.55 crore in Q2 FY26. H1 FY27 profit was about Rs 1,096 crore, up 13.4%. Check the profit line before comparing with other pages.
What is Dabur’s revenue in Q2 FY27?
Consolidated revenue from operations rose 11.6% to Rs 3,563.07 crore from Rs 3,191.32 crore a year earlier. H1 FY27 revenue was about Rs 7,327 crore, up 11.1%, and India FMCG grew 10.7% with 5.5% underlying volume growth.
What is the Dabur interim dividend 2026 and its record date?
The board declared an interim dividend of Rs 3.50 per share (350% of the Re 1 face value) for FY27. The record date is Tuesday, 10 November 2026 and payment starts from 25 November 2026. The total payout is about Rs 620.88 crore.
When should I buy Dabur shares to get the Rs 3.50 dividend?
The record date, 10 November 2026, is an exchange holiday, so the ex-date normally moves to the last trading day before it, Monday, 9 November. Buying on the ex-date does not qualify, so the last cum-dividend purchase is likely Friday, 6 November. Confirm the ex-date on NSE or BSE.
What is the Dabur share price after Q2 results?
Not yet confirmed as of 6:45 AM IST on 5 November 2026. The stock closed at Rs 394.10 on the BSE (+3.45%) and about Rs 395 on the NSE on 4 November, before the results. The first reaction comes at the 9:15 AM open.
Did the Dabur Q2 results FY27 beat guidance?
Yes on the headline numbers. Dabur had guided to double-digit growth, a floor of about Rs 3,510 crore revenue and Rs 498 crore profit. It reported Rs 3,563.07 crore and Rs 505.50 crore, about 1.5% above each floor (my calculation).
What was the Dabur Q2 EBITDA margin?
About 18.1% on one aggregator basis (EBITDA Rs 645.82 crore, +12.7%), against 18.0% a year earlier. Another report shows 22.6% on a different EBITDA line. The definitions differ, so read the company’s own line in the filing.
How did Dabur’s volume and international business do?
India FMCG grew 10.7% with 5.5% underlying volume growth, against about 2% volume in Q2 FY26. The international business grew 20% in rupee terms, helped by Bangladesh, Egypt, Sub-Saharan Africa and Turkey.
Why is Dabur’s Global CEO leaving?
Mohit Malhotra’s resignation takes effect on 13 November 2026. Business Standard reports personal interests; his letter, as quoted by Upstox, cites an overseas role from 16 November. Herjit Bhalla joins the board as whole-time director from 14 November, subject to approvals.
Sources
- Dabur financial results, quarter ended 30 June 2026 (company PDF)
- Dabur India investor page
- Axis Direct result update, Dabur Q2 FY26, 31 October 2025
- Upstox, Free Press Journal, Business Today, Business Standard, Kotak Neo, Sahi, IncredMoney and TradingView reports of 4 and 5 November 2026, plus NSE and BSE holiday lists (secondary; not linked)
Editorial disclosure. PositionalCalls.com is not a SEBI-registered research analyst or investment adviser. Investments in securities markets are subject to market risks. Read all related documents carefully before investing. Returns are never guaranteed. This page is educational, is independent and was written by Shubham Chaudhary, founder of PositionalCalls. How I researched this: I compared reports of Dabur’s Q2 FY27 filing with its earlier guidance and one pre-results estimate, recomputed every derived number and labelled conflicting figures. Corrections are published in the Data note.

Shubham Chaudhary is the founder of PositionalCalls, an independent Indian stock market research website. He writes company fundamentals, quarterly results analysis, IPO analysis and sector research for NSE and BSE listed companies, with a focus on banking stocks, insurance and long-term value investing. Every article is built from primary sources such as RBI, SEBI, NSE and BSE filings and company annual reports, and states its risks plainly in simple language for retail investors.
Coverage areas Our research standards- Numbers checked against NSE, BSE and SEBI filings
- Risks and limits stated in every article
- No paid promotions or broker tie-ups
- Articles updated when new filings arrive