
Earnings · Cement, Chemicals and Finance · Q2 FY27 results declared
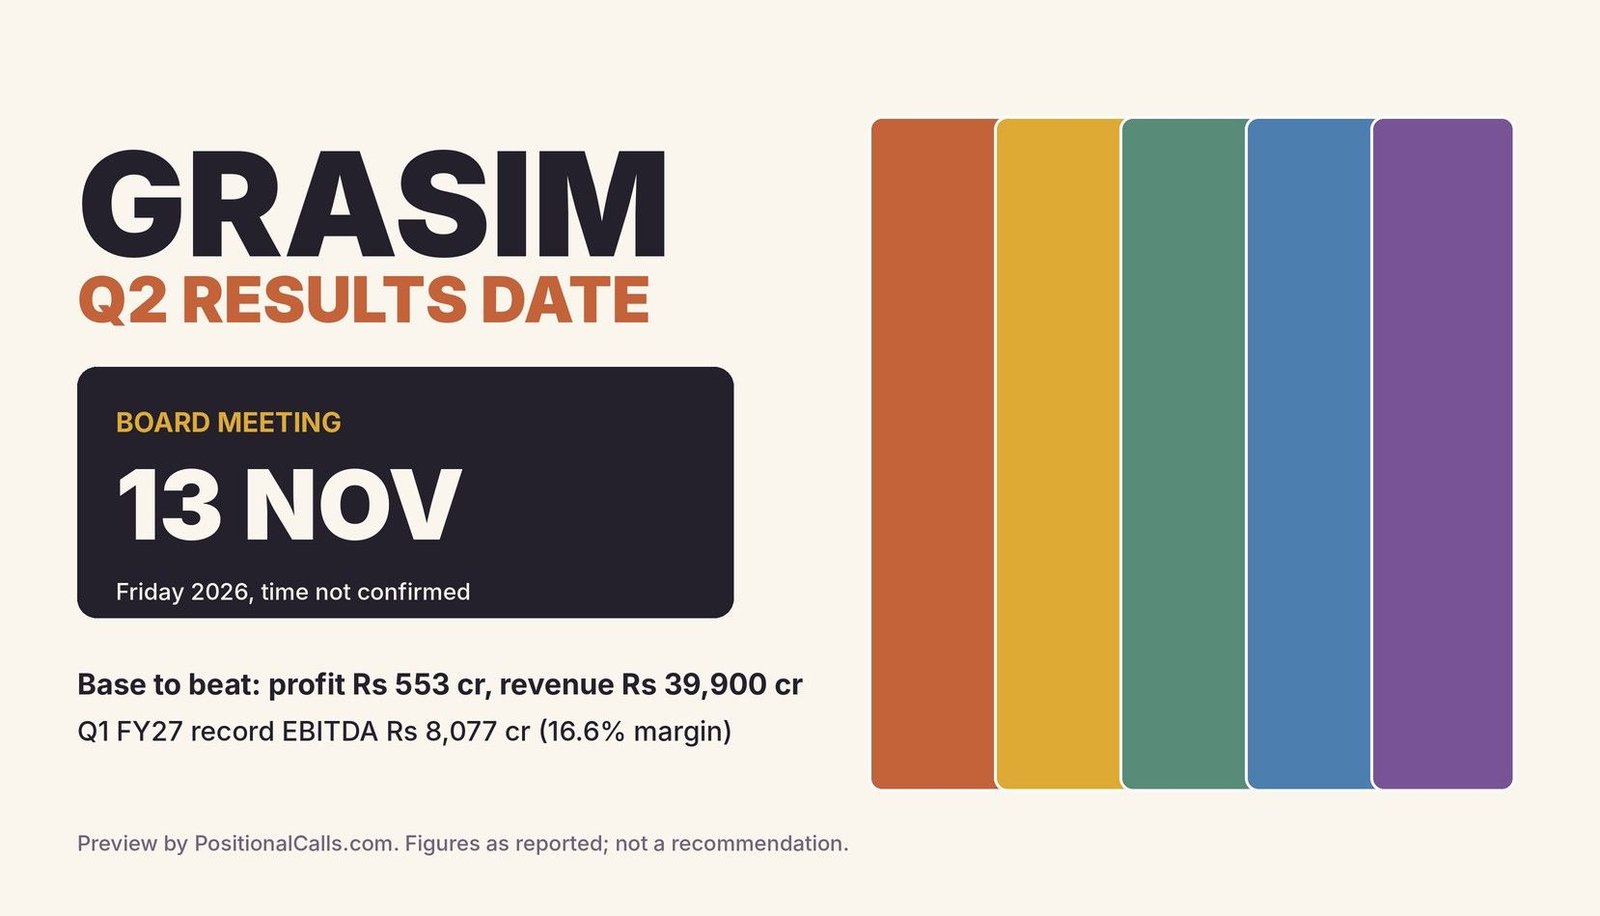
The Grasim Q2 results date was Friday, 13 November 2026, and the numbers are out: consolidated revenue of Rs 50,105 crore, up 25.6%, and a loss of Rs 234.08 crore to owners after a Rs 767 crore pulp venture charge. This page keeps the date, the base and the checklist, and marks what the result answered.
Quick answer
The Grasim Q2 results date was Friday, 13 November 2026. Consolidated revenue was Rs 50,105 crore, up 25.6% on the Rs 39,900 crore base, but owners posted a loss of Rs 234.08 crore after a Rs 767 crore charge on a pulp venture. No dividend to Grasim holders was found, and the filing time is unconfirmed.
Latest update (Friday, 13 November 2026, 3:45 PM IST): Grasim reported Q2 FY27 results on Friday, 13 November 2026; Upstox listed the consolidated figures at 2:30 PM IST, and TaxGuru, Investywise and Multibagg carried the numbers. I found no analyst estimate or dividend to Grasim holders, and I have not opened the exchange filing.
Key takeaways
- Date: the board met on Friday, 13 November 2026, as the preview said; Upstox lists the figures at 2:30 PM IST, and the exchange timestamp was not found.
- Revenue: Rs 50,105.18 crore against the Rs 39,900 crore base, up 25.6%, and 2.9% above Q1 FY27’s Rs 48,716 crore (my calculation).
- Profit: owners’ loss of Rs 234.08 crore against the preview’s Rs 553 crore base; profit before minorities was Rs 1,029.42 crore, down 34.7%.
- Why: an exceptional charge of Rs 773.02 crore, mainly Rs 766.73 crore on the AV Group NB pulp venture, and a tax charge of 61.8% of pre-tax profit (my calculation).
- Conflicts: EBITDA appears as Rs 6,513 crore and as Rs 9,722 crore, and year-ago owners’ profit as Rs 553 crore and Rs 594.52 crore.
- Price: Upstox quotes Rs 3,028.40, down 2.78%, with no time stamp; the 9 November close was Rs 3,169.70.
In plain words: Grasim is the holding company of the Aditya Birla group’s industrial and finance businesses. It owns a large stake in UltraTech Cement and Aditya Birla Capital, and runs its own fibre, chemicals, paints and online building-materials businesses. Its consolidated profit is therefore a blend of many businesses with very different margins.
Data note: Figures are as of 13 November 2026, 3:45 PM IST. Q2 FY27 figures come from Upstox, TaxGuru, Investywise and Multibagg (an automated summary); earlier figures from the Grasim and Aditya Birla press releases, Kotak Neo, Business Standard and 5paisa. I could not open the exchange filings, so figures are headline-level, and derived numbers are my calculation. I found no analyst consensus for Grasim Q2.
In this post
What did Grasim report on the Grasim Q2 results date?
On the Grasim Q2 results date, 13 November 2026, consolidated revenue from operations was Rs 50,105.18 crore, up 25.6%, while profit to owners was a loss of Rs 234.08 crore, against the Rs 553 crore profit base in the preview, per Upstox, TaxGuru and Investywise.
| Line | Q2 FY27 reported | Preview mark (Q2 FY26) | Q1 FY27 | Outcome |
|---|---|---|---|---|
| Revenue from operations | Rs 50,105.18 crore | Rs 39,900 crore | Rs 48,716 crore | +25.6% on the base; +2.9% on Q1 |
| Profit to owners | Loss of Rs 234.08 crore | Rs 553 crore (Upstox shows Rs 594.52 crore) | Rs 2,153 crore adjusted | A loss against a profit; swing of about Rs 787 crore on the preview base |
| Adjusted profit to owners | Rs 536 crore | Rs 553 crore | Rs 2,153 crore adjusted | -10% as reported on Rs 594.52 crore; -3.1% on Rs 553 crore |
| Profit before minorities | Rs 1,029.42 crore | Rs 1,576.32 crore | Not found | -34.7% |
| Profit before tax | Rs 2,695.92 crore | Rs 2,588.34 crore | Not found | +4.2% |
| EBITDA | Rs 6,513 crore or Rs 9,722 crore | Rs 5,217 crore | Rs 8,077 crore | +25% or +27% as reported; the basis conflicts |
Cite this table: Grasim Q2 FY27 against the preview marks, as of 13 November 2026, 3:45 PM IST, PositionalCalls; Q2 FY27 per Upstox, TaxGuru and Investywise; percentages not marked as reported are my calculation.
The preview’s revenue base ties: Rs 39,899.58 crore reported for the year-ago quarter against Rs 39,900 crore in the preview. The profit base does not: the preview used Rs 553 crore from the company release, while Upstox’s year-ago owners’ profit is Rs 594.52 crore. Both are shown so you can see the gap. The full analysis, with the profit bridge, standalone result and segments, is in Grasim Q2 results FY27; here I keep the date, the base and the decoder.
Grasim Q2 results date: where the sources differ
| Item | Figure A | Figure B | How to read it |
|---|---|---|---|
| Owners’ profit line | Loss of Rs 234.08 crore (to owners) | Profit of Rs 1,029.42 crore (before minorities) | Two different lines; the minority share is about Rs 1,263.50 crore (my calculation) |
| EBITDA | Rs 6,513 crore, +25% (company-release basis, TaxGuru) | Rs 9,722 crore, +27%, 19.4% margin (Upstox) | Basis not stated by either; the filing will settle it |
| Year-ago owners’ profit | Rs 553 crore (company release, in the preview) | Rs 594.52 crore (Upstox) | A gap of about Rs 41.5 crore (my calculation) |
| Birla Opus revenue | Rs 1,337 crore, +35% (Q2) | Rs 1,661 crore (Q1, in this page) | Q2 reads lower than Q1; I could not reconcile the bases |
Cite this table: Grasim Q2 FY27 source differences, PositionalCalls, as of 13 November 2026, 3:45 PM IST; none was checked against the filing.
When was the Grasim Q2 results date, and at what time was it announced?
The Grasim Q2 results date was Friday, 13 November 2026, as Upstox’s weekly list had said. The board considered results for the quarter and half-year ended 30 September 2026, and Upstox’s live blog lists the figures at 2:30 PM IST. I did not find the exchange timestamp. The preview had one source for the date and no time; the result confirms the day. Last year Grasim published its Q2 FY26 results on 5 November 2025, so this year’s date was eight days later in the calendar. I found no earnings call detail.
Grasim Q2 results date: what was confirmed
| Item | Preview said | Result | Status |
|---|---|---|---|
| Board meeting day | 13 November 2026 (one source) | Results reported on 13 November | Confirmed |
| Quarter | Ended 30 September 2026 | Q2 and H1 FY27 results | Confirmed |
| Release time | Not stated | Upstox: 2:30 PM IST; filing time not found | Not confirmed |
| Earnings call | Not found | Not found | Not confirmed |
| Analyst consensus | Not found | Not found | Not available |
Cite this table: Grasim Q2 results date status, as of 13 November 2026, 3:45 PM IST, PositionalCalls.
Because 14 November was a Saturday, Friday was the last working day before the legal limit (my calculation). For the other companies on the same day, see the Q2 results hub.
What was the profit and revenue base Grasim had to beat in Q2 FY27?
The preview’s year-ago base was Q2 FY26 consolidated revenue of Rs 39,900 crore, EBITDA of Rs 5,217 crore and owners’ profit of Rs 553 crore, up 76%. Q2 FY27 revenue of Rs 50,105 crore cleared it by 25.6%, but owners’ profit turned to a loss of Rs 234.08 crore.
| Consolidated, Rs crore | Q2 FY26 | Q1 FY27 | What to compare |
|---|---|---|---|
| Revenue | 39,900 (+17%) | 48,716 (+21%) | Q1 was 22.1% above the Q2 FY26 base (my calculation) |
| EBITDA | 5,217 (+29%) | 8,077 (+26%) | Q1 was 54.8% above the Q2 FY26 base (my calculation) |
| EBITDA margin | 13.1% (my calculation) | 16.6% (my calculation) | A 3.5 point gap sets the Q2 test |
| Profit | 553 (+76%) | 2,153 adjusted (+49%) | Labels differ; see the next section |
| Standalone revenue | 9,610 (+26%) | 11,795 (+28%) | Grasim’s own businesses |
Cite this table: Grasim consolidated base, Grasim press release (5 Nov 2025), Aditya Birla press release and Kotak Neo (Q1 FY27), as of 13 November 2026, 3:45 PM IST.
The Q2 FY26 base is low on margin: 13.1% against 16.6% in Q1 FY27. If Q2 FY27 held the Q1 margin on similar revenue, EBITDA would be far above the base; that is arithmetic, not a forecast. The profit comparison is more delicate, because Q2 FY26 profit of Rs 553 crore was far below Q1 FY26 profit of about Rs 1,400 crore, which makes the year-on-year growth rate look large for any reasonable Q2 FY27 figure (my calculation).
Result check on the Grasim Q2 results date: revenue is 25.6% above the Rs 39,900 crore base and 2.9% above Q1’s Rs 48,716 crore (my calculation). The EBITDA of Rs 6,513 crore on the company-release basis is 24.8% above Rs 5,217 crore, a margin of 13.0% against 13.1% a year earlier (my calculation). The Q1 margin of 16.6% was not repeated on that basis, though Upstox’s Rs 9,722 crore would be 19.4%, so the margin answer depends on which EBITDA is right.
Which Grasim figures were right to compare on results day?
The comparison needed the same basis: revenue from operations, EBITDA and profit attributable to owners. The result showed why. Owners’ loss of Rs 234.08 crore and profit before minorities of Rs 1,029.42 crore are different lines, and year-ago owners’ profit appears as Rs 553 crore and Rs 594.52 crore.
Several differences existed before the result. They are shown here, not resolved.
| Item | Figure A | Figure B | How to read it |
|---|---|---|---|
| Q1 FY26 profit | Rs 1,442 crore (restated, adjusted) | Rs 1,419 crore (derived from H1) | A Rs 23 crore gap; use the label the filing uses |
| Q1 FY27 profit | Rs 2,153 crore (adjusted) | Reported profit not found | Adjusted may exclude exceptional items; the filing will show both |
| Cement revenue base | Rs 19,607 crore (Grasim segment, Q2 FY26) | Rs 19,371 crore (UltraTech release, Q2 FY26) | Different perimeters; compare like with like |
| Aditya Birla Capital revenue | Rs 12,155 crore (Grasim, Q1 FY27) | Rs 16,545 crore (ABCL, Q2 FY27) | Different definitions; do not compare across them |
| Restated base | Q2 FY25 restated for the Kesoram merger | Q2 FY26 as published | Year-ago bases can be restated again |
Cite this table: Grasim conflicting or differing figures, as of 13 November 2026, 3:45 PM IST, PositionalCalls.
The cleanest anchors are the company’s own press releases: Q2 FY26 revenue Rs 39,900 crore and profit Rs 553 crore, and Q1 FY27 revenue Rs 48,716 crore and EBITDA Rs 8,077 crore. The adjusted profit label is the one to watch, because Grasim has several large non-operating items in the group.
I found no published Q2 FY27 consensus or current broker target for Grasim, so I cannot say whether the result beat or missed estimates. Upstox quotes Rs 3,028.40, down 2.78%, after the result with no time stamp; the last close in the preview was Rs 3,169.70 on 9 November 2026.
Broker views are shown only as reported, with date and source. They are not PositionalCalls targets and are not a view of mine.
| Broker (as reported) | Rating | Target, Rs | Date reported | Source |
|---|---|---|---|---|
| Motilal Oswal | Buy | 3,410 | 6 Nov 2025 | Business Standard; a year old |
| Nuvama Institutional Equities | Hold | 3,198 (from 2,971) | 6 Nov 2025 | Business Standard; a year old |
Cite this table: Grasim broker views as reported, Business Standard (6 November 2025), as of 13 November 2026, 3:45 PM IST. Year-old views shown for context only; no current consensus found.
A NewsBytes headline mentions a Motilal Oswal target of Rs 3,800, but I did not open it and found no date, so I do not use it. On the Q2 FY26 day the shares fell as much as 5.27% intraday to Rs 2,730, with the CEO exit at Birla Opus cited as a worry (Business Standard).
Grasim Q2 results date: price and market value snapshot
| Item | Figure | Source or note |
|---|---|---|
| Result-day quote (Upstox) | Rs 3,028.40 (-2.78%) | Upstox; no time stamp; may have changed |
| Move from the 9 Nov close | -4.5% | My calculation: 3,028.40 / 3,169.70 |
| Close, 9 Nov 2026 | Rs 3,169.70 (-1.17%) | 5paisa; the last close in the preview |
| Market value | Rs 2,15,705 crore | 5paisa |
| 52-week range | Rs 2,503 to Rs 3,411 | 5paisa |
| Close, 3 Nov and 2 Nov | Rs 3,090 and Rs 3,057.10 | 5paisa |
Cite this table: Grasim price snapshot, 5paisa and Kotak Neo; calculations by PositionalCalls. Not live.
The close of Rs 3,169.70 is 2.6% above the 3 November close and 3.7% above the 2 November close (my calculation), so the shares were rising into the results. 5paisa shows a one-month return of about 11% and a three-month return of about minus 4.6%. I could not verify a close after 9 November; 10 November was a market holiday and I did not find 11 November. The Upstox quote shows a fall after the result, but a quote with no time is not a close, and I do not read a verdict into one day’s move. A snapshot is a record, not a view.
PositionalCalls WhatsApp channel
Grasim results, then the next filing
- The filing and the margin check as soon as they appear
- Base-versus-actual checks in plain words
- Links to every updated Q2 FY27 page
What drove Grasim’s Q2 numbers: cement, finance, fibre, chemicals and paints?
Segment revenue rose in every line I found: building materials Rs 27,377.81 crore (+23%), financial services Rs 13,990.35 crore (+32%), cellulosic fibres Rs 5,343.50 crore (+28.8%) and chemicals Rs 2,758.95 crore (+15%). The profit swing came below the segment lines, from the exceptional charge, the tax charge and the minority share.
The Q2 clues already out: UltraTech and Aditya Birla Capital
| Subsidiary, Q2 FY27 | Reported | Year earlier | Change |
|---|---|---|---|
| UltraTech net sales | Rs 23,024 crore | Rs 19,371 crore | +18.9% |
| UltraTech PBIDT | Rs 3,832 crore | Rs 3,268 crore | +17.3% |
| UltraTech profit | Rs 1,501 crore | Rs 1,238 crore | +21.3% (21.2% on my calculation) |
| UltraTech domestic volume | 35.94 million tonnes | 31.58 million tonnes | +13.8% |
| UltraTech utilisation | 71% | 66% | +5 points |
| Aditya Birla Capital profit | Rs 1,288 crore | Not found | +38% |
| ABC lending portfolio | Rs 2,33,930 crore | Not found | +32% (+7% QoQ) |
Cite this table: UltraTech and Aditya Birla Capital Q2 FY27, Aditya Birla press release and Investywise, as of 13 November 2026, 3:45 PM IST. Not checked against the filings.
UltraTech’s PBIDT margin was 16.6% against 16.9% a year earlier (my calculation: 3,832 / 23,024 and 3,268 / 19,371), so cement profit grew with volume but the margin did not expand. Aditya Birla Capital’s lending book rose about 6.7% from the Q1 figure of Rs 2,19,289 crore shown in Grasim’s release, which ties to the 7% sequential growth reported (my calculation).
Grasim Q2 results date: what the segments reported
| Segment, Rs crore | Q2 FY27 revenue | Change reported | Q1 FY27 revenue (Aditya Birla release) |
|---|---|---|---|
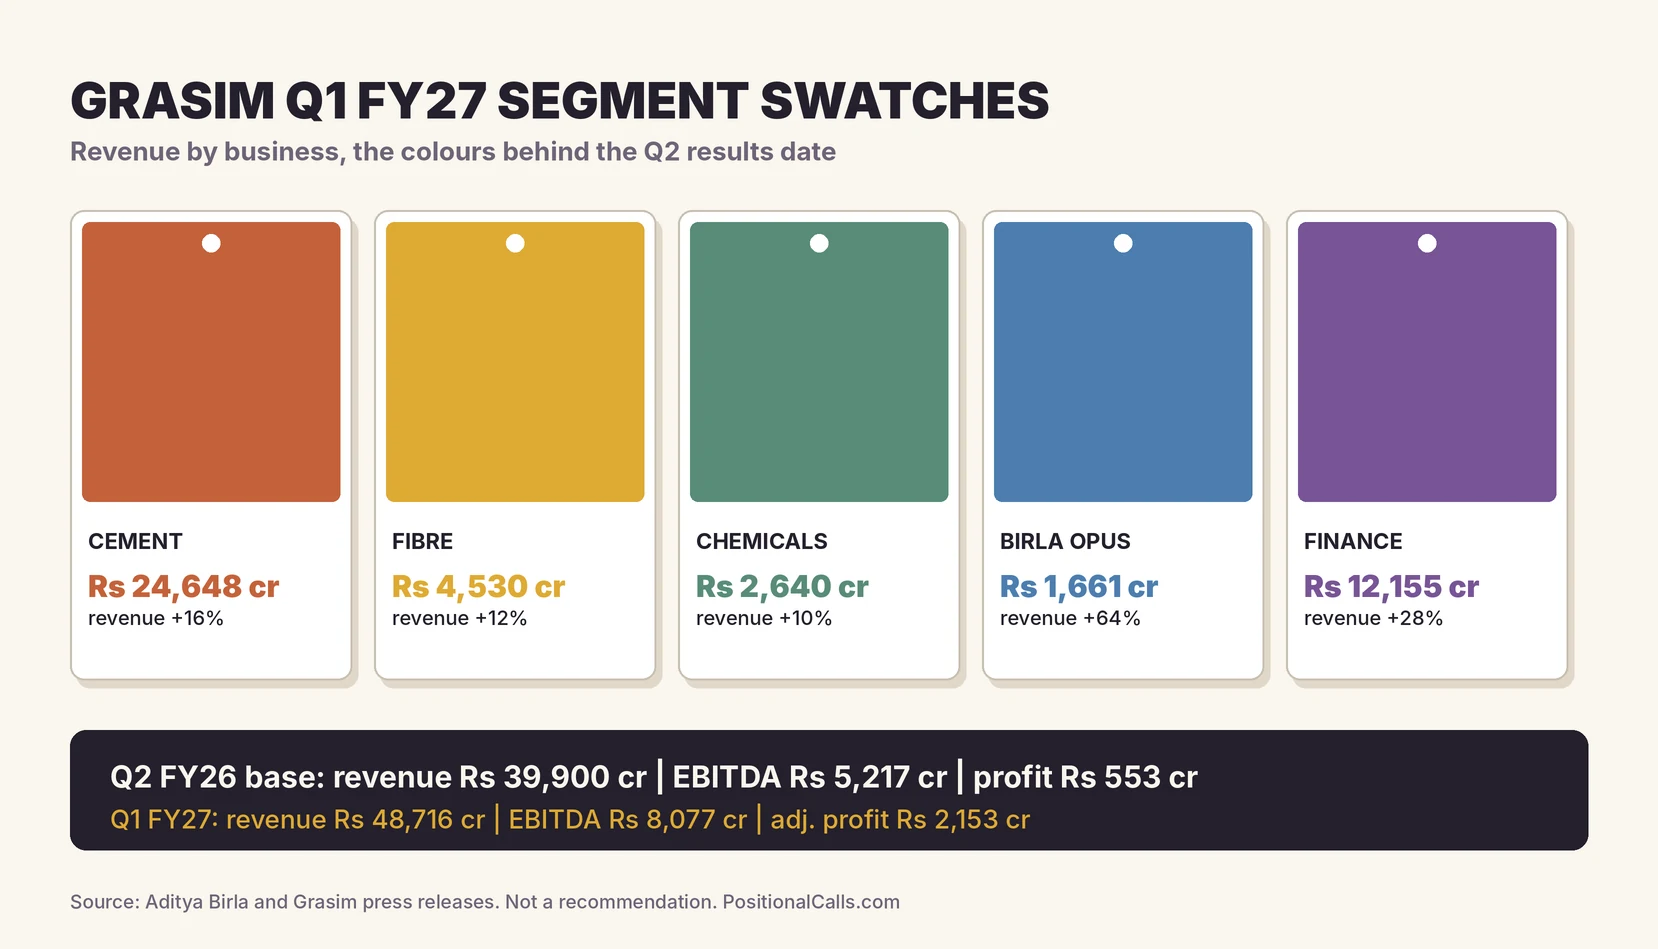
| Building materials | 27,377.81 | +23% | 28,835 |
| Financial services | 13,990.35 | +32% | 12,155 |
| Cellulosic fibres | 5,343.50 | +28.8% | 4,530 |
| Chemicals | 2,758.95 | +15%; segment result -10.8% | 2,640 |
| Birla Opus paints | 1,337 | +35% | 1,661 |
| Birla Pivot (B2B online) | 2,785 | +66% | 2,548 |
Cite this table: Grasim Q2 FY27 segment revenue, Upstox, TaxGuru and Multibagg, as of 13 November 2026, 3:45 PM IST; Q1 column from Aditya Birla press release; not checked against the filing.
The holding-company effect on the Grasim Q2 results date
Grasim reports consolidated profit attributable to its owners, after deducting the share of UltraTech and Aditya Birla Capital profit that belongs to other shareholders and after its own standalone costs. A rough illustration: UltraTech’s Q2 FY26 profit of Rs 1,238 crore and Aditya Birla Capital’s Rs 855 crore (the headline of its Q2 FY26 release) add to Rs 2,093 crore, against Grasim’s consolidated owners’ profit of Rs 553 crore (my calculation). In Q2 FY27 the same two subsidiaries reported Rs 1,501 crore and Rs 1,288 crore, a combined Rs 2,789 crore, 33.3% above the year-ago sum (my calculation).
| Profit, Rs crore | Q2 FY26 | Q2 FY27 | Change (my calculation) |
|---|---|---|---|
| UltraTech | 1,238 | 1,501 | +21.2% |
| Aditya Birla Capital | 855 | 1,288 | +50.6% |
| Sum of the two | 2,093 | 2,789 | +33.3% |
| Grasim consolidated, owners | 553 | Loss of 234 | A swing of about Rs 787 crore (my calculation) |
Cite this table: Subsidiary profit sum versus Grasim owners’ profit, Aditya Birla press releases and Investywise; ownership shares not verified; illustration only.
The Aditya Birla Capital growth in this table is 50.6%, against the 38% reported, because the Rs 855 crore figure in the headline of its Q2 FY26 release and the Rs 1,288 crore figure in the Q2 FY27 reports may be on different bases (for example before and after minority interests). I show the discrepancy openly and do not use the sum as a forecast for Grasim. What the Grasim Q2 results date showed for this quarter is that little of it reached the owners: profit before minorities was Rs 1,029.42 crore, and the implied minority share was about Rs 1,263.50 crore against Rs 981.80 crore a year earlier (my calculation: profit before minorities less profit to owners).
Brokers have long applied a discount to a holding company; Business Standard reported in November 2025 that Motilal Oswal raised its holding-company discount to 40% from 35%. That is a valuation convention that sits outside the results themselves.
Paints and the competitive set
Birla Opus is the loss-making or low-margin part of the story that investors watch. Its Q1 revenue was Rs 1,661 crore and market share rose by about 30 basis points quarter on quarter, with the combined share of paints and putty described as nearing the early teens. Q2 revenue was reported at Rs 1,337 crore, up 35%, which is lower than the Q1 figure of Rs 1,661 crore on this page; I could not reconcile the two. For comparison with listed peers, see Asian Paints Q2 results FY27 and Berger Paints Q2 results FY27.
How did the Grasim Q2 result compare with the scenario levels?
On the Grasim Q2 results date, revenue of Rs 50,105 crore sat just above the Rs 50,000 crore row. Owners’ profit fell below every profit row, as a loss. The levels were illustrations, not forecasts, and none of them included an exceptional charge of Rs 767 crore.
| Illustrative revenue, Rs crore | Versus Q2 FY26 (39,900) | Versus Q1 FY27 (48,716) |
|---|---|---|
| 45,000 | +12.8% | -7.6% |
| 48,279 | +21.0% | -0.9% |
| 48,716 | +22.1% | Flat |
| 50,000 | +25.3% | +2.6% |
| 50,105 (actual) | +25.6% | +2.9% |
| 52,000 | +30.3% | +6.7% |
| 55,000 | +37.8% | +12.9% |
Cite this table: Grasim revenue sensitivity, my calculation. 48,279 is Q2 FY26 grown at Q1’s reported 21%. Not an estimate.
| Illustrative profit, Rs crore | Versus Q2 FY26 (553) | Versus Q1 FY27 (2,153) |
|---|---|---|
| 1,000 | +80.8% | -53.6% |
| 1,500 | +171.3% | -30.3% |
| 2,000 | +261.7% | -7.1% |
| 2,153 | +289.3% | Flat |
| 2,500 | +352.1% | +16.1% |
| Loss of 234 (actual, owners) | A swing of about Rs 787 crore | Not comparable; Q1 is adjusted |
Cite this table: Grasim profit sensitivity, my calculation; Q1 FY27 is the adjusted figure. Not an estimate.
What did the Grasim results answer from the results-day reading order?
The reading order was the profit label and basis, revenue, EBITDA margin, segments, profit, then capex and net debt. The result answered revenue (above both marks), the label (loss to owners, profit before minorities, adjusted Rs 536 crore) and segments (all higher); EBITDA depends on the source, and net debt was not found.
| Order | Line to read | Mark to beat | Why it comes first |
|---|---|---|---|
| 1 | Profit label and basis | Attributable to owners; adjusted or reported | Avoids comparing two different profits |
| 2 | Revenue from operations | Rs 39,900 crore (year ago); Rs 48,716 crore (Q1) | Shows scale |
| 3 | EBITDA and margin | Rs 5,217 crore and 13.1%; Rs 8,077 crore and 16.6% | The line that moved most |
| 4 | Building materials | EBITDA Rs 2,950 crore (year ago); Rs 5,002 crore (Q1) | Over half of EBITDA |
| 5 | Fibre and chemicals | EBITDA Rs 350 and 365 crore (year ago); Rs 632 and 491 crore (Q1) | Recovery or relapse |
| 6 | Paints and online sales | Revenue Rs 1,661 crore and Rs 2,548 crore in Q1 | Growth and any loss |
| 7 | Profit | Rs 553 crore (year ago); Rs 2,153 crore (Q1) | The headline most people quote |
| 8 | Net debt, capex and dividend | Q1 capex Rs 375 crore; FY27 budget Rs 3,157 crore | Funding and returns |
Cite this table: Grasim results-day reading order, PositionalCalls.
| Preview question | Preview mark | Result | Answer |
|---|---|---|---|
| Which profit label? | Owners; adjusted or reported | Loss Rs 234.08 crore reported; Rs 536 crore adjusted | Both shown by sources |
| Did revenue beat the base? | Rs 39,900 crore | Rs 50,105 crore | Yes, +25.6% |
| Did EBITDA margin hold? | 13.1% and 16.6% | 13.0% or 19.4%, by source | Unclear until the filing |
| Did building materials grow? | Rs 19,607 crore cement base | Rs 27,377.81 crore (+23%) | Yes, as reported |
| Did fibre and chemicals recover? | EBITDA Rs 632 and 491 crore in Q1 | Revenue +28.8% and +15% | Revenue yes; EBITDA not found |
| Did profit beat the base? | Rs 553 crore | Loss of Rs 234.08 crore | No |
| Capex | FY27 budget Rs 3,157 crore | H1 spend Rs 1,022 crore | About Rs 647 crore in Q2 (my calculation) |
Cite this table: Grasim preview questions answered, PositionalCalls, as of 13 November 2026, 3:45 PM IST; filing not opened.
Then read one management sentence on paints, because the pace of Birla Opus spending is the line most likely to move the group margin. Set the share price reaction aside until the numbers are read.
How do I read the Grasim Q2 filing and avoid fake alerts?
To check the Grasim Q2 results date figures, open them on the BSE or NSE announcement page for Grasim Industries Limited, not through a link in a message, and read the consolidated statement first. Treat any tip that asks for an OTP, a payment or a login as fake.
- Open the BSE or NSE corporate announcements page and search for Grasim Industries Limited.
- Choose the financial result for the quarter ended 30 September 2026 and open the consolidated statement.
- Note the line labels: revenue from operations, other income, EBITDA, profit before tax and profit attributable to owners.
- Compare revenue and profit with Rs 50,105 crore and the owners’ loss of Rs 234.08 crore, then with the marks of Rs 39,900 crore and Rs 553 crore and of Rs 48,716 crore and Rs 2,153 crore.
- Read the press release for segment figures, and the notes for exceptional items and restated comparatives.
- Check whether the profit headline is adjusted before using a growth rate, and read the note on the Rs 773.02 crore of exceptional items.
Fake results alerts and paid tip groups multiply on results days. No genuine filing asks for a login, an OTP or money. PositionalCalls is not SEBI-registered, gives no buy or sell calls and never asks for payment.
What do most people miss about the Grasim Q2 results date?
Around the Grasim Q2 results date, most readers miss that revenue rose 25.6% while owners posted a loss, that the loss comes from a Rs 767 crore pulp venture charge and a high tax rate, and that EBITDA appears on two bases.
Bottom line
The Grasim Q2 results date was 13 November 2026. Revenue was Rs 50,105 crore, up 25.6%, and owners posted a loss of Rs 234.08 crore after a Rs 767 crore pulp venture charge. Read the full analysis at Grasim Q2 results FY27, and for the Birla group’s metals company see Hindalco Q2 FY27 profit. This page gives no call.
PositionalCalls WhatsApp channel
Never miss a Q2 results update
- Dates and times when companies confirm them
- Results explained without tips or targets
- Updated posts as they go live
Grasim Q2 results date: frequently asked questions
When was the Grasim Q2 results date?
The Grasim Q2 results date was Friday, 13 November 2026, when the board considered results for the quarter and half-year ended 30 September 2026. Upstox’s live blog lists the figures at 2:30 PM IST; I did not find the exchange timestamp. Last year the company reported on 5 November 2025.
What time was the Grasim Q2 results date announcement?
Upstox lists the Grasim Q2 results at 2:30 PM IST on 13 November 2026, but I did not find the exchange timestamp or an earnings call. The legal limit was 14 November, 45 days after the quarter end (my calculation). Check the BSE or NSE announcement for the filed time.
What did Grasim report for Q2 FY27?
Consolidated revenue was Rs 50,105.18 crore, up 25.6%, and profit to owners was a loss of Rs 234.08 crore against a profit a year earlier. Profit before minorities was Rs 1,029.42 crore, down 34.7%. Adjusted profit was Rs 536 crore, per Upstox, TaxGuru and Investywise.
Why did Grasim report a loss when revenue rose?
Exceptional items of Rs 773.02 crore, mainly Rs 766.73 crore on the AV Group NB pulp venture, and a tax charge of 61.8% of pre-tax profit (my calculation) cut profit. The minority share was about Rs 1,263.50 crore. The filing will show the full note.
Did Grasim beat the base the preview set?
On revenue, yes: Rs 50,105 crore is 25.6% above the Rs 39,900 crore base (my calculation). On owners’ profit, no: the result was a loss against Rs 553 crore. Adjusted profit of Rs 536 crore is 3.1% below that base. I found no analyst estimate for beat or miss.
Why do Grasim EBITDA figures differ across sources?
TaxGuru’s company-release basis gives EBITDA of Rs 6,513 crore, up 25%, while Upstox gives Rs 9,722 crore, up 27%, a 19.4% margin. Neither states its basis in what I read. Compare both with the Rs 5,217 crore base only after checking the filing for the Grasim Q2 results date.
What do Grasim’s standalone numbers show?
Standalone profit rose 187% to Rs 2,306 crore after a Rs 3,968 crore dividend from UltraTech, which is eliminated on consolidation. Standalone revenue was Rs 12,747 crore, up 33%. An Rs 825 crore charge was booked standalone against Rs 767 crore for owners.
Did Grasim declare a dividend with the Q2 results?
I found no dividend to Grasim shareholders in the reports I read, and the preview had found none on the agenda. The Rs 3,968 crore dividend in the standalone numbers was received from UltraTech, not paid by Grasim. Check the board outcome on NSE or BSE.
Upstox quotes Rs 3,028.40, down 2.78%, with no time stamp, so it may not be a close. The last close in the preview was Rs 3,169.70 on 9 November 2026. Check NSE or BSE for a current quote. I do not read a verdict into one day’s move.
No. This Grasim Q2 results date page is not a recommendation, and PositionalCalls is not SEBI-registered. It gives no buy, sell or hold view or price target. Figures are reported with sources and my calculations are labelled. Read the filing and consult a registered adviser before investing.
Sources
- Upstox: Grasim Q2 FY27 results, 13 November 2026.
- Upstox: Q2 results live blog, 13 November 2026.
- TaxGuru: Grasim Q2 FY27, company release basis.
- Investywise: Grasim Q2 FY27, 13 November 2026.
- Multibagg: Grasim profit falls, AVNB charge; an automated summary.
- PositionalCalls: Grasim Q2 results FY27 analysis
- BSE corporate announcements: where the Grasim filing appears.
- NSE corporate filings: financial results: the same filing on NSE.
- Upstox: upcoming Q2 FY27 results, 8 November 2026.
- Grasim: Q2 FY26 earnings press release, 5 November 2025 (base quarter).
- Aditya Birla: Grasim Q1 FY27 results, August 2026.
- Kotak Neo: Grasim Q1 FY27 results, 12 August 2026.
- Aditya Birla: UltraTech Q2 FY27 performance, October 2026.
- Investywise: Aditya Birla Capital Q2 FY27, 30 October 2026.
- Business Standard: Grasim shares slide after Q2 FY26, 6 November 2025.
- 5paisa: Grasim share price on 9 November, 2026.
Disclosure: PositionalCalls.com is not a SEBI-registered research analyst or investment adviser. Investments in securities markets are subject to market risks. Read all related documents carefully before investing. Returns are never guaranteed. PositionalCalls is an independent research and education site founded by Shubham Chaudhary. Nothing here is a recommendation, target or investment advice. How I researched this: for the Grasim Q2 results date I read the Grasim and Aditya Birla press releases, Upstox, TaxGuru, Multibagg, Kotak Neo, Business Standard, Investywise and 5paisa, noted where sources differ, and marked every derived number as my calculation. I did not open any company filing or exchange document. Figures are as of 13 November 2026, 3:45 PM IST.

Shubham Chaudhary is the founder of PositionalCalls, an independent Indian stock market research website. He writes company fundamentals, quarterly results analysis, IPO analysis and sector research for NSE and BSE listed companies, with a focus on banking stocks, insurance and long-term value investing. Every article is built from primary sources such as RBI, SEBI, NSE and BSE filings and company annual reports, and states its risks plainly in simple language for retail investors.
Coverage areas Our research standards- Numbers checked against NSE, BSE and SEBI filings
- Risks and limits stated in every article
- No paid promotions or broker tie-ups
- Articles updated when new filings arrive