
Earnings · Asian Paints
The date, the year-ago base, the one reported estimate and a profit-definition trap, so you can read Asian Paints’ September-quarter results the minute they are filed, then see the dividend dates and the arithmetic behind them.
Quick answer
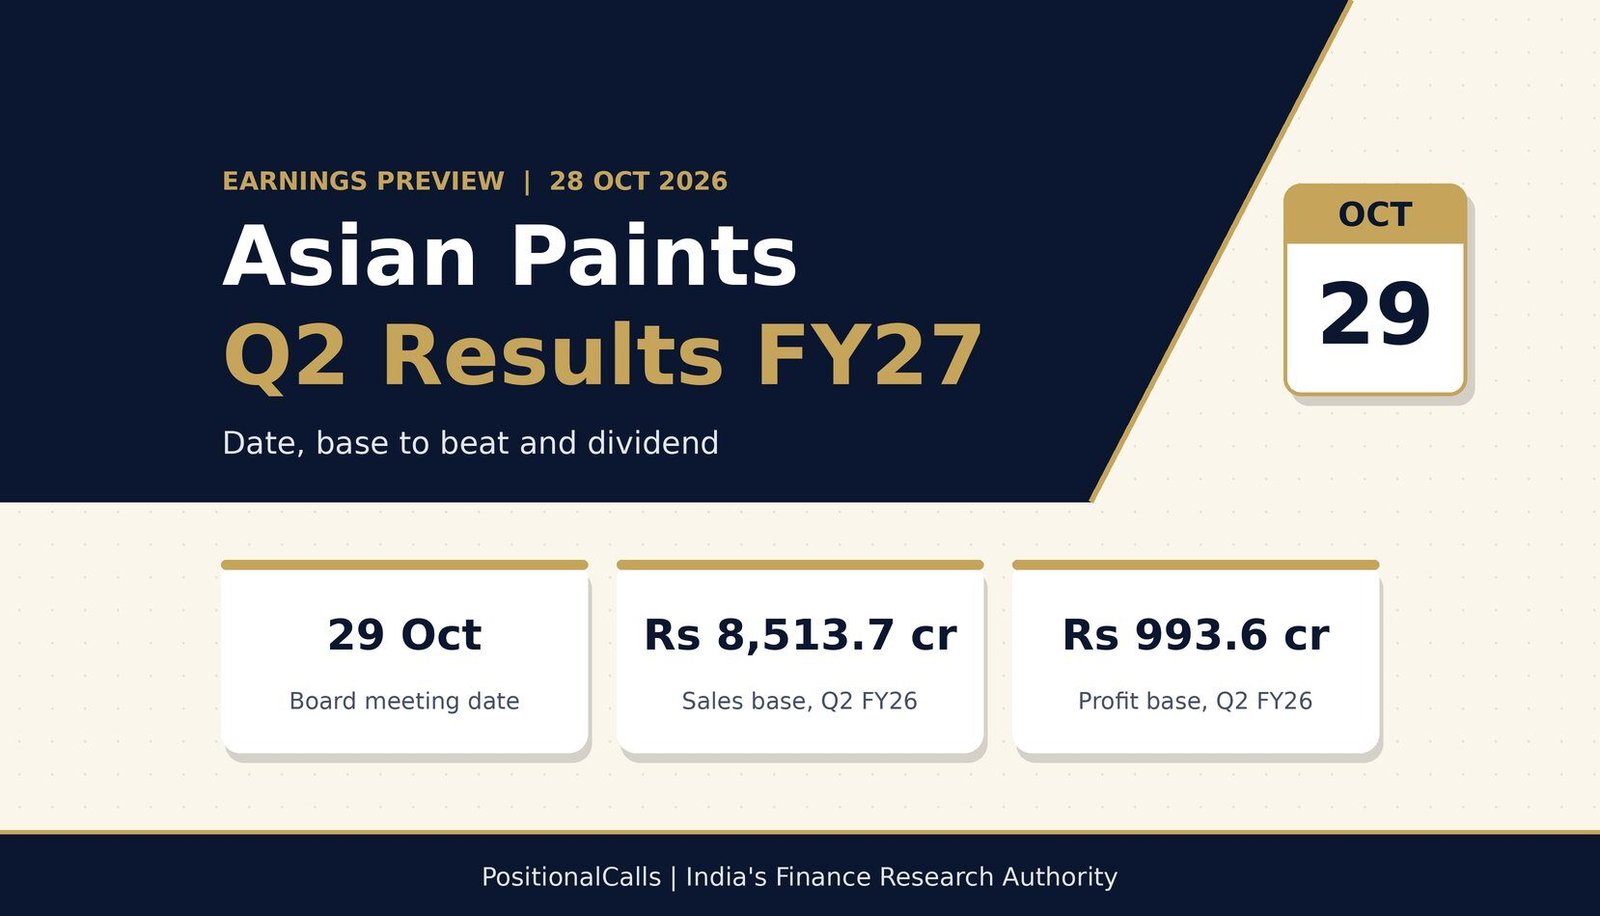
Asian Paints Q2 results FY27 are scheduled for Thursday, 29 October 2026, when the board meets on September-quarter numbers and an interim dividend, as reported. The year-ago base is Rs 8,513.7 crore net sales and Rs 993.6 crore net profit. The dividend record date is 4 November 2026, if declared.
Latest update (28 October 2026, 11:00 AM IST): No Q2 FY27 numbers were out as of this time. The board meeting is reported for Thursday, 29 October 2026. This page will be rewritten into the results analysis on the same URL after the filing.
Key takeaways
- Date: board meeting on Thursday, 29 October 2026, 14 days earlier than last year’s 12 November 2025.
- Base (Q2 FY26): net sales Rs 8,513.7 crore, PBDIT Rs 1,503.4 crore (17.7% margin), net profit after minority interest Rs 993.6 crore.
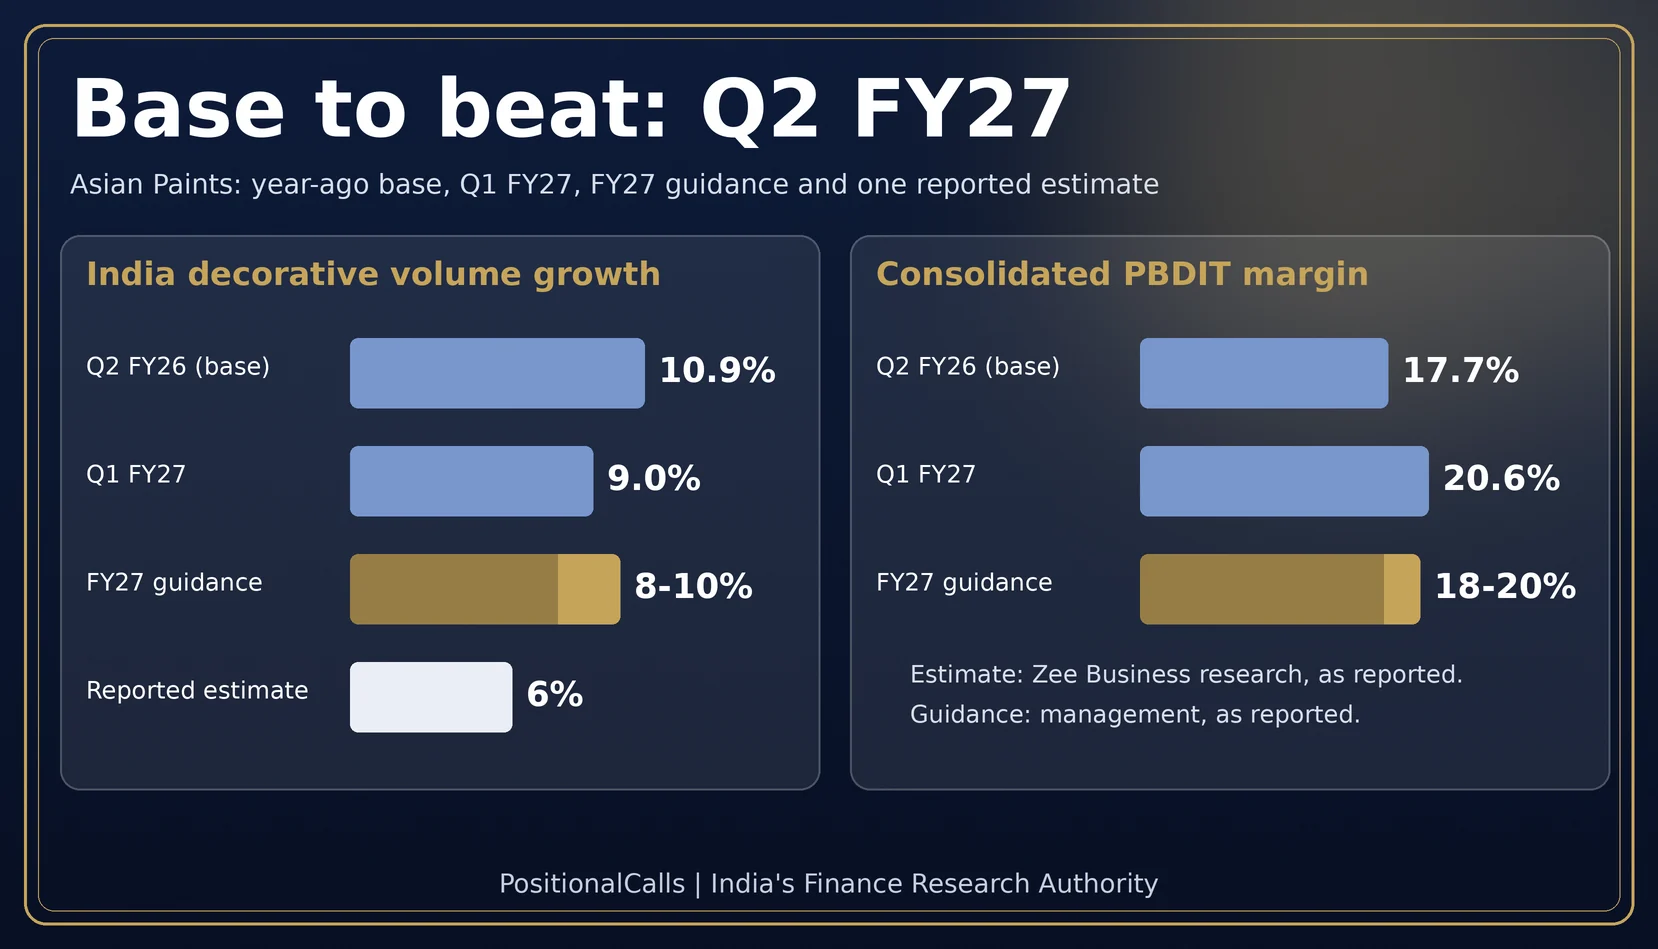
- Reported estimate: net profit Rs 1,115 crore (+9.5%), revenue Rs 9,662 crore (+13.3%), decorative volume +6%.
- Trap: the +9.5% is measured against Rs 1,018.2 crore, which includes minority interest, not Rs 993.6 crore.
- Bar set by Q1 FY27: net profit Rs 1,539.3 crore (+40.0%); FY27 guidance is 8% to 10% volume growth and an 18% to 20% margin.
- Dividend: record date Wednesday, 4 November 2026 if declared. FY26 interim was Rs 4.50.
In plain words: The “base” is last year’s same quarter, the number every growth rate is measured against. PBDIT is operating profit before depreciation, interest, tax, other income and exceptional items. A “record date” decides who gets a dividend. Minority interest is the share of subsidiary profit owned by outside shareholders.
Data note: as of 28 October 2026, 11:00 AM IST. Base-quarter figures follow the company’s 12 November 2025 release as carried by multiple reports; Q1 FY27 figures are from the company’s 29 July 2026 press release. The estimate is one reported preview, not a verified consensus. Derived numbers are labelled “my calculation”. Nothing here is a forecast of the result.
Asian Paints Q2 Results Date: When Will the Q2 FY27 Results Come Out?
The Asian Paints Q2 results date is Thursday, 29 October 2026, as reported. The board is due to consider audited standalone and unaudited consolidated results for the quarter and half-year ended 30 September 2026, and an interim dividend. The company filed the intimation on Tuesday, 6 October 2026, per CNBC-TV18. The exact clock time is not confirmed; check the exchange filing.
The meeting is earlier than last year by 14 days (my calculation: 12 November minus 29 October). That brings the festive-quarter read forward and puts Asian Paints ahead of most paint peers, which normally report in November.
What Is the Base Asian Paints Must Beat in Q2 FY27 Results?
The base is Q2 FY26: consolidated net sales of Rs 8,513.7 crore, PBDIT of Rs 1,503.4 crore at a 17.7% margin, and net profit after minority interest of Rs 993.6 crore. Q2 FY26 was a strong quarter, with domestic decorative volume growth of 10.9%. That makes it a demanding comparison. The table lists each line, in Rs crore.
| Consolidated, Rs crore | Q2 FY26 (base) | Q2 FY25 | YoY | Why it matters |
|---|---|---|---|---|
| Net sales | 8,513.7 | 8,003.0 | +6.4% | Headline sales line |
| PBDIT | 1,503.4 | 1,239.5 | +21.3% | Operating profit |
| PBDIT margin | 17.7% | 15.5% | +220 bps | Margin the new quarter is compared with |
| Profit before tax | 1,391.5 | 959.0 | +45.1% | Reported PBT |
| Net profit after minority interest | 993.6 | 694.6 | +43.0% | Company headline profit |
| Net profit including minority interest | 1,018.2 | 693.7 | +46.8% | Statutory profit for the period |
| Standalone net sales | 7,335.9 | 6,934 | +5.8% | Asian Paints Limited alone |
| International net sales | 846.0 | 770 | +9.9% | About 9.9% of consolidated sales (my calculation) |
| Decorative volume / value | +10.9% / +6.0% | n.a. | n.a. | Volume strong, value lagged |
Two profit numbers matter. The company headline is Rs 993.6 crore, after minority interest. The statutory figure is Rs 1,018.2 crore, which includes minority interest. The gap is Rs 24.6 crore (my calculation). Management said industry growth was about 3.5% to 4% in that quarter, well below its own 10.9% volume growth.
Cite this table: PositionalCalls, “Asian Paints Q2 FY26 base to beat, as of 28 October 2026”.
What Do Analysts Expect From Asian Paints Q2 FY27 Results?
One reported preview (Zee Business research) expects net profit of Rs 1,115 crore, revenue of Rs 9,662 crore, decorative volume growth of 6% and a margin near 17.0%. It also expects price increases of about 7% to help the numbers and a 120 basis point hit to gross margin from input costs. This is one reported estimate, not a verified consensus.
| Item | Q2 FY26 base | Reported estimate, Q2 FY27 | Change |
|---|---|---|---|
| Revenue | Rs 8,531.3 crore (revenue from operations) | Rs 9,662 crore | +13.3% |
| EBITDA (PBDIT) | Rs 1,503.4 crore | Rs 1,643 crore | +9.3% |
| EBITDA margin | 17.6% on revenue from operations | About 17.0% | -60 bps |
| Net profit | Rs 1,018.2 crore (incl. minority) | Rs 1,115 crore | +9.5% |
| Decorative volume growth | +10.9% | +6% | Lower base effect |
| Price increase in the quarter | n.a. | About 7% | Aids value growth |
| Gross margin | 43.1% (consolidated) | About 41.9% (my calculation) | -120 bps |
Why does the profit estimate need a definition check?
The +9.5% growth in the estimate implies a base of Rs 1,018.2 crore (my calculation: 1,115 divided by 1.095). That is the profit including minority interest. The company’s headline profit uses Rs 993.6 crore after minority interest. Against that figure, the same Rs 1,115 crore is +12.2% (my calculation). Compare like with like on results day.
Do the volume and price estimates add up?
Yes. Volume growth of 6% and a price increase of 7% compound to 13.4% (my calculation: 1.06 times 1.07), close to the +13.3% revenue estimate. The margin figures also fit: 1,643 divided by 9,662 is 17.0%, and 1,503.4 divided by 8,531.3 is 17.6% (my calculation). The company’s own 17.7% divides by net sales of Rs 8,513.7 crore, so the two margin bases differ slightly.
A second report, from Kotak Neo, put the expected year-on-year margin fall at 117 basis points, against 60 basis points in the Zee Business estimate. The spread between the two matters more than either number.
What is a margin worth in rupees? An arithmetic illustration, not a forecast
| PBDIT margin | PBDIT on Rs 9,662 crore revenue (Rs crore) | Reading |
|---|---|---|
| 17.0% | 1,642.5 | Reported estimate |
| 17.7% | 1,710.2 | Same as the Q2 FY26 base margin |
| 18.0% | 1,739.2 | Bottom of FY27 guidance |
| 20.0% | 1,932.4 | Top of FY27 guidance |
My calculation: Rs 9,662 crore multiplied by each margin. The span from 17.0% to 18.0% is Rs 96.6 crore of operating profit on the same sales, which is why the margin line decides how the quarter reads. The revenue figure is the reported estimate, not a result.
Cite this table: PositionalCalls, “Asian Paints Q2 FY27 reported estimates and definitions, as of 28 October 2026”.
What Do Q1 FY27 and Management Guidance Set as the Bar?
Q1 FY27 set a high bar: net sales rose 17.9% to Rs 10,521.4 crore and net profit after minority interest rose 40.0% to Rs 1,539.3 crore. Management has kept FY27 guidance at 8% to 10% volume growth and an 18% to 20% PBDIT margin, as reported. Q1 FY27 delivered 9.0% volume growth and a 20.6% margin.
| Consolidated, Rs crore | Q1 FY27 | Q1 FY26 | YoY |
|---|---|---|---|
| Net sales | 10,521.4 | 8,924.5 | +17.9% |
| PBDIT | 2,168.8 | 1,625.0 | +33.5% |
| PBDIT margin | 20.6% | 18.2% | +240 bps |
| Profit before tax | 2,095.7 | 1,508.7 | +38.9% |
| Net profit after minority interest | 1,539.3 | 1,099.8 | +40.0% |
| International net sales | 936.5 | 736.1 | +27.2% |
| Decorative volume / value | +9.0% / +16.6% | n.a. | Price increases helped value |
Source: Asian Paints Q1 FY27 press release, 29 July 2026. In Q1 the weighted decorative price increase was reported at 6.8%, so value growth of 16.6% leans on price. Management has also said Q2 usually carries some margin pressure from mix and seasonality, as reported. For last quarter’s profit definitions and exceptional items, read our Asian Paints Q3 results FY26 analysis.
How Is the Paint Sector Heading Into Q2 FY27?
Paint makers took price increases to offset higher input costs, and volume growth is guided in the high single digits. Peers’ commentary frames the Asian Paints read. The table is as reported.
| Company | What was reported | Read-across |
|---|---|---|
| Asian Paints | FY27 guidance: volume +8% to 10%, margin 18% to 20% | Q1 FY27 volume +9.0% |
| Berger Paints | Guided Q2 volume +7.5% to 8% and price +7.5% to 8.5%; revenue estimate +12.8% | Price-led growth across the sector |
| Kansai Nerolac | About 5% hike in Q1, decorative about 3% more in Q2, industrial 3% to 5%; revenue estimate +12% | Price rises still being taken |
| Birla Opus (Grasim) | Reportedly cut dealer schemes by 5% to 6% over two months | Competition and dealer schemes matter |
The common thread is price. Volume growth guided at 7.5% to 8% for a peer and 6% in the Asian Paints estimate sits below Q2 FY26’s 10.9%, so value growth should lean on price. Crude-linked input costs remain the variable that decides how much of the price rise reaches margin. For other sectors in the same results season see Infosys Q2 results FY27 and Bajaj Finance Q2 FY27 results; for the wider sector view read the consumption sector outlook 2026.
What Does the H1 FY27 Arithmetic Show?
Q1 FY27 has already locked in most of H1 FY27 growth: even flat Q2 sales would give H1 net sales growth of about 9.2%. H1 FY26 consolidated net sales were Rs 17,438.2 crore and net profit after minority interest was Rs 2,093.4 crore. The table is an arithmetic illustration, not a forecast.
| Assumed Q2 net sales growth | Q2 FY27 net sales (Rs crore) | H1 FY27 net sales (Rs crore) | H1 growth vs Rs 17,438.2 crore | 1 point of margin (Rs crore) |
|---|---|---|---|---|
| 0% | 8,513.7 | 19,035.1 | +9.2% | 85.1 |
| +8% | 9,194.8 | 19,716.2 | +13.1% | 91.9 |
| +12% | 9,535.3 | 20,056.7 | +15.0% | 95.4 |
| +16% | 9,875.9 | 20,397.3 | +17.0% | 98.8 |
My calculation: Rs 10,521.4 crore (Q1 FY27) plus Rs 8,513.7 crore multiplied by one plus the assumed growth, divided by Rs 17,438.2 crore. The last column is 1% of Q2 sales: one point of PBDIT margin is worth Rs 85 to 99 crore on this range. Read the Q2 print on its own, not on the H1 total.
Cite this table: PositionalCalls, “Asian Paints H1 FY27 arithmetic, as of 28 October 2026”.
PositionalCalls WhatsApp channel
Follow Asian Paints on results day with the channel
- The filing summarised in plain words within minutes
- Base-to-beat numbers kept dated and sourced
- A link to the full analysis once it is updated
Asian Paints Interim Dividend 2026: Record Date, Eligibility and History
If the board declares an interim dividend on 29 October 2026, the record date is Wednesday, 4 November 2026, and you must hold the shares by the close of Tuesday, 3 November 2026. Under T+1 settlement the ex-date is normally the record date. The dividend is not certain until the board approves it. Confirm every date in the exchange filing.
| Financial year | Dividend per share | Note |
|---|---|---|
| FY24 | Interim Rs 5.15 | Highest interim payout, Nov 2023, as reported |
| FY25 | Interim Rs 4.25 | As reported |
| FY26 | Interim Rs 4.50 + final Rs 23 = Rs 27.50 | Interim record date 18 Nov 2025; final record date 23 Jun 2026 |
| FY27 | Not declared as of 28 Oct 2026, 11:00 AM IST | Board considers it on 29 Oct 2026 |
Some pages show Rs 5.15 as the FY26 interim dividend. That was FY24’s; FY26’s was Rs 4.50. The final FY26 record date of 23 June 2026 is in the company’s 29 May 2026 board outcome.
How much would a dividend pay?
At last year’s Rs 4.50, 100 shares would pay Rs 450, 500 shares Rs 2,250 and 1,000 shares Rs 4,500 before tax (my calculation). The FY27 amount may differ.
How do you become eligible?
- Hold the shares in your demat account. An unexecuted order does not count.
- Buy by Tuesday, 3 November 2026. Under T+1 the record date is also the ex-date.
- Wait for the declaration. The amount and payment date come with the board outcome.
- Check the credit. Last year payment came on or after 27 November 2025, nine days after the record date.
Tax angle: dividend income is taxable, and TDS can apply above an annual threshold. Check the current rules or ask a tax adviser; our guide to tax on shares and dividend TDS sets out the worked cases. NRI investors face different withholding; see the NRI investment guide. Brokerage and demat charges apply only if you trade; check your broker’s current schedule.
Asian Paints Q2 Results-Day Decoder: What to Read First
| What to read | Year-ago or guided mark | Question to ask |
|---|---|---|
| Consolidated net sales | Rs 8,513.7 crore (reported estimate: revenue about Rs 9,662 crore) | How much is volume, how much price? |
| Decorative volume growth | +10.9% base; guidance 8% to 10%; estimate +6% | Did volume hold against a high base? |
| Value minus volume | Q2 FY26: 6.0% minus 10.9% | Is price now adding to growth? |
| PBDIT margin | 17.7% base; Q1 FY27 20.6%; guidance 18% to 20% | Did margin stay inside guidance? |
| Gross margin | 43.1% base; estimate down 120 bps | How much input cost reached margin? |
| Net profit definition | Rs 993.6 crore after minority; Rs 1,018.2 crore including | Which line is the headline quoting? |
| Exceptional items | Q3 FY26 had Rs 157.6 crore | Any one-off in the notes? |
| International net sales | Rs 846.0 crore base; Q1 FY27 +27.2% | Is the Middle East still growing? |
| Interim dividend | Rs 4.50 last year; record date 4 Nov 2026 | Amount, record date, payment date? |
Cite this table: PositionalCalls, “Asian Paints Q2 FY27 results-day decoder, as of 28 October 2026”.
- Open the press release and the exchange filing side by side.
- Note whether each profit figure is standalone or consolidated.
- Compare Q2 with Q2, never with Q1.
- Read the notes to the accounts for exceptional items.
- Check the dividend amount against Rs 4.50 and the record date against 4 November 2026.
Where Can You Read the Asian Paints Results Yourself?
Use the company’s investor relations page and the NSE or BSE announcements, both free. Reading the filing yourself takes about five minutes.
- Open the investor relations page. Pick the Q2 FY27 press release when it appears.
- Search ASIANPAINT on NSE or BSE. Open “Financial Results”. Standalone and consolidated are separate files, as in the Q3 FY26 standalone filing.
- Read the first table. Check minority interest and exceptional items.
- Compare the same quarter. Use the year-ago column.
Scam warning: fake “results alert” and dividend groups ask for OTPs or fees. A real dividend credits your bank account without any payment from you. Never share an OTP or password.
What Most People Miss When Reading Asian Paints’ Results
Analyst’s Note: How to Think About This Print
- What stands out: the estimates agree with each other on arithmetic (6% volume and 7% price give about 13.4% value), so the open questions are volume and margin, not sales.
- Easy to miss: Q1 FY27 already locks in about 9.2% H1 sales growth even if Q2 is flat (my calculation).
- What would change the read: volume below the 8% to 10% guidance while margin holds would mean price is carrying the numbers.
- Caution: these are reasoned observations from reported numbers, not forecasts or advice.
Bottom Line
Bottom line
Asian Paints reports on Thursday, 29 October 2026 against a base of Rs 8,513.7 crore sales and Rs 993.6 crore profit, a high Q2 FY26 volume mark of 10.9%, and a Q1 FY27 profit of Rs 1,539.3 crore. One reported estimate points to about 13% sales growth and slower margin. Check the profit definition first, then volume, then margin. The dividend record date is 4 November 2026 if declared.
Next read: Reliance Q2 FY27 results: date, base and what to read
Part of the Results and earnings series.
PositionalCalls WhatsApp channel
Get Asian Paints and results updates in one place
- Dated explainers when a major filing lands
- Profit, PBDIT and dividend dates in plain language
- Links to the original company documents
Frequently Asked Questions on Asian Paints Q2 Results FY27
When are the Asian Paints Q2 results FY27?
Asian Paints’ board is reported to meet on Thursday, 29 October 2026 to consider results for the quarter and half-year ended 30 September 2026. That is 14 days earlier than last year’s meeting on 12 November 2025. Confirm the date and time in the NSE or BSE filing.
What is the Asian Paints dividend record date for 2026?
The record date is Wednesday, 4 November 2026, if the board declares an interim dividend for FY27. The dividend is not certain until the board approves it. Under T+1 settlement the ex-date normally falls on the record date, so the last day to buy is Tuesday, 3 November 2026.
What did Asian Paints report in Q2 FY26, the base for Q2 FY27?
In Q2 FY26 consolidated net sales were Rs 8,513.7 crore (+6.4%), PBDIT was Rs 1,503.4 crore at a 17.7% margin, and net profit after minority interest was Rs 993.6 crore (+43%). Net profit including minority interest was Rs 1,018.2 crore.
What do analysts expect from Asian Paints Q2 FY27 results?
One reported preview (Zee Business research) expects net profit of Rs 1,115 crore, revenue of Rs 9,662 crore (+13.3%), decorative volume growth of 6% and an EBITDA margin near 17.0%. Treat it as one reported estimate, not a verified consensus.
Which profit figure should I compare with the Asian Paints estimate?
Check the definition first. The +9.5% growth in the reported Rs 1,115 crore estimate implies a base of Rs 1,018.2 crore, which includes minority interest (my calculation). Against Rs 993.6 crore, the profit after minority interest, the same estimate would be about +12.2%.
How much interim dividend did Asian Paints pay in FY26?
Asian Paints paid an interim dividend of Rs 4.50 per share for FY26, with a record date of 18 November 2025. Total FY26 dividend was Rs 27.50 per share including a final dividend of Rs 23. Some pages wrongly show Rs 5.15, which was the FY24 interim dividend.
What is Asian Paints’ guidance for FY27?
Management has maintained FY27 guidance of 8% to 10% decorative volume growth and a consolidated PBDIT margin of 18% to 20%, as reported from the Q1 FY27 call. Q1 FY27 delivered 9.0% volume growth and a 20.6% margin.
How did Asian Paints do in Q1 FY27?
In Q1 FY27 (quarter ended 30 June 2026) consolidated net sales rose 17.9% to Rs 10,521.4 crore, PBDIT margin was 20.6% and net profit after minority interest rose 40.0% to Rs 1,539.3 crore, per the company’s 29 July 2026 press release.
How can I check the Asian Paints Q2 results on the day?
Open the company’s investor relations page for the press release, or search ASIANPAINT in NSE or BSE announcements for the results file. Read whether the profit line is after minority interest, including minority interest or standalone before you compare it with any figure.
Will Asian Paints declare an interim dividend on 29 October 2026?
Not confirmed as of 28 October 2026, 11:00 AM IST. The board will only consider an interim dividend on 29 October 2026. Asian Paints has paid an interim dividend every year since 2007, per exchange data cited by CNBC-TV18, but that history is not a guarantee.
Sources
- Asian Paints Investor Relations
- Asian Paints press release, Q1 FY27, 29 July 2026
- Asian Paints board outcome, 29 May 2026
- NSE: Asian Paints standalone audited results, Q3 FY26
- Business Standard, HDFC Sky, Outlook Business, Bajaj Broking and FilingReader (Q2 FY26 base), CNBC-TV18 (board meeting date and record date), Zee Business research (Q2 FY27 estimates), Kotak Neo (peer estimates), Upstox and Tradebrains (guidance and peer commentary), Quartr and Alpha Spread (call summaries), as reported.
Editorial disclosure: PositionalCalls.com is an independent research site founded by Shubham Chaudhary. PositionalCalls.com is not a SEBI-registered research analyst or investment adviser. Investments in securities markets are subject to market risks. Read all related documents carefully before investing. Returns are never guaranteed. This page explains reported results and dates and does not recommend buying or selling any security. How I researched this: figures were read from the company’s press releases and filings, cross-checked against published reports and recalculated; derived numbers are labelled “my calculation”.

Shubham Chaudhary is the founder of PositionalCalls, an independent Indian stock market research website. He writes company fundamentals, quarterly results analysis, IPO analysis and sector research for NSE and BSE listed companies, with a focus on banking stocks, insurance and long-term value investing. Every article is built from primary sources such as RBI, SEBI, NSE and BSE filings and company annual reports, and states its risks plainly in simple language for retail investors.
Coverage areas Our research standards- Numbers checked against NSE, BSE and SEBI filings
- Risks and limits stated in every article
- No paid promotions or broker tie-ups
- Articles updated when new filings arrive