
Results analysis · Diversified
Looking for the Grasim Q2 results FY27? Grasim reported on 13 November 2026: record revenue of Rs 50,105 crore but a consolidated loss of Rs 234 crore after a pulp joint-venture charge. This page splits the loss into its layers, shows why the standalone profit is different, ties the figures to the preview and flags where sources conflict.
Quick answer
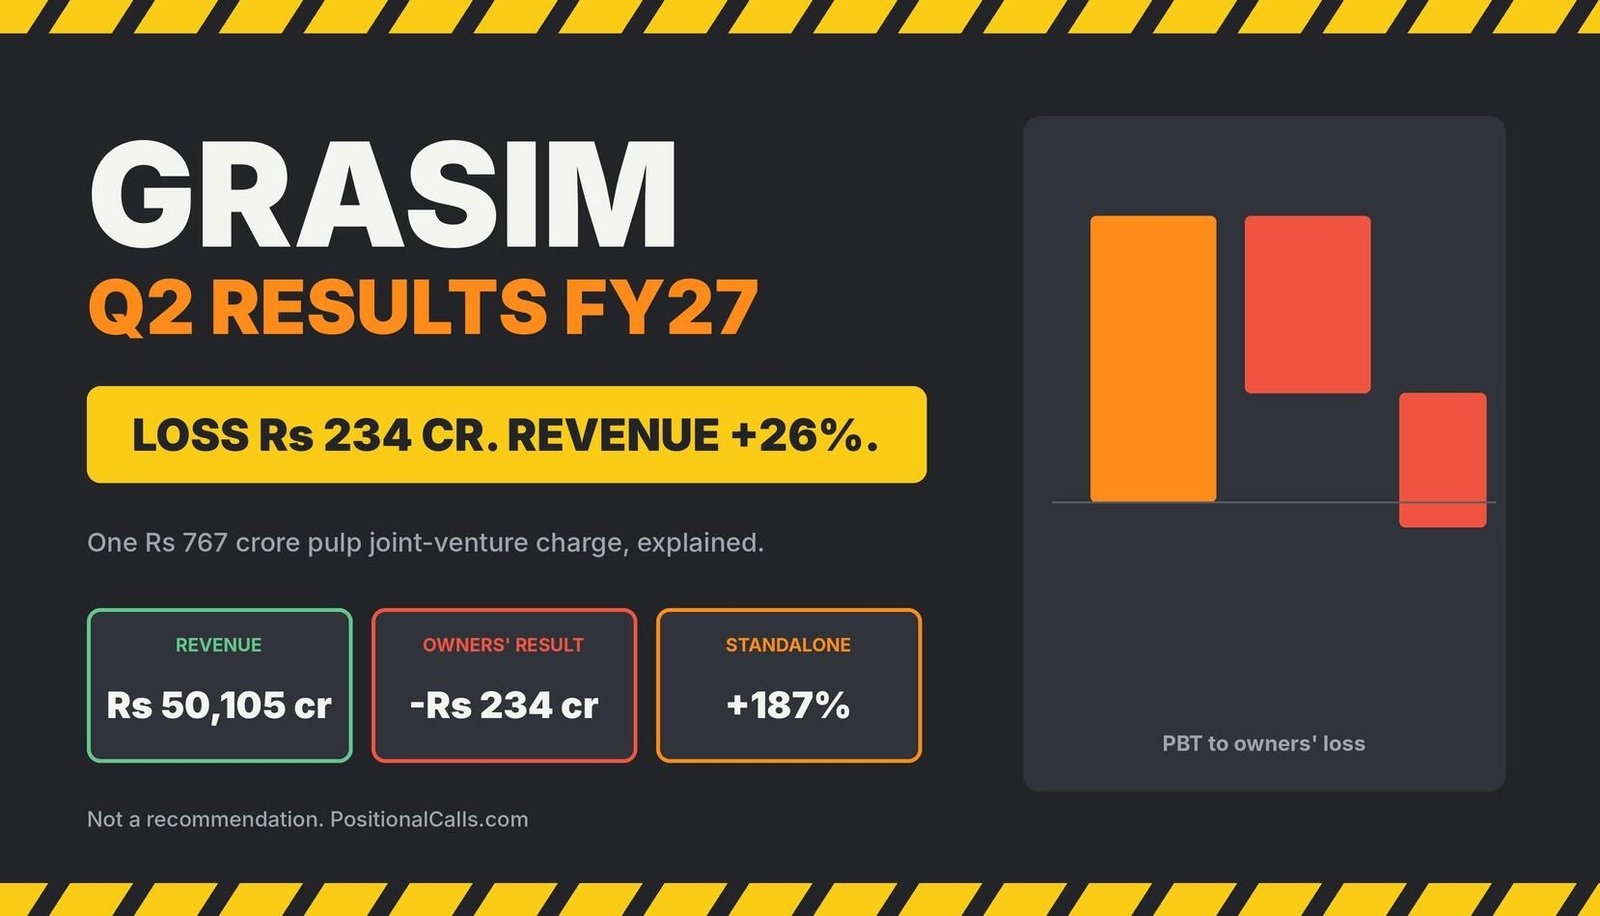
Grasim Q2 results FY27: Grasim reported a consolidated net loss of Rs 234.08 crore against a profit of Rs 594.52 crore, on revenue of Rs 50,105 crore, up 26%. A Rs 767 crore charge on its Canadian pulp joint venture caused the loss. Standalone profit rose 187% to Rs 2,306 crore. No call here.
Latest update (Friday, 13 November 2026, 3:45 PM IST): Grasim reported Q2 FY27 results on Friday, 13 November 2026; Upstox listed the consolidated figures at 2:30 PM IST. Upstox, TaxGuru, Investywise and Multibagg carried the numbers. I did not find a dividend to Grasim shareholders, an analyst estimate or an official closing price, and I have not opened the exchange filing.
Key takeaways
- Headline: consolidated loss attributable to owners of Rs 234.08 crore against a profit of Rs 594.52 crore a year earlier (Upstox). Revenue was Rs 50,105 crore, up 26%.
- Cause: a Rs 767 crore exceptional charge on AV Group NB Inc., a Canadian pulp joint venture. Adjusted profit was Rs 536 crore, down 10%.
- Standalone: profit of Rs 2,306 crore, up 187%, after a Rs 3,968 crore dividend from UltraTech that is eliminated on consolidation.
- Layers: consolidated net profit before minority share was Rs 1,029.42 crore (-34.7%); about Rs 1,263.50 crore went to minorities (my calculation).
- Segments: building materials revenue +23%, financial services +32%, cellulosic fibres +29%; chemicals EBITDA fell 11%.
- Conflicts: EBITDA is Rs 6,513 crore in the company release and Rs 9,722 crore at Upstox; the year-ago profit is Rs 594.52 crore or Rs 553 crore. Filing not opened.
In plain words: Grasim owns fibre, chemicals and paints businesses and large stakes in UltraTech Cement and Aditya Birla Capital. Its consolidated results add those stakes together, so one large write-off can turn a record-revenue quarter into a reported loss.
Data note: Figures are as of 13 November 2026, 3:45 PM IST and are consolidated unless stated, for the quarter to 30 September 2026. Headline figures come from Upstox; segment, tax and exceptional lines from Multibagg (an automated summary); standalone and EBITDA lines from TaxGuru and Investywise, which follow the company release. Derived numbers are my calculation. Where sources differ I show both.
In this post
- What did Grasim report?
- Why do the sources differ?
- From profit before tax to the loss
- The pulp joint-venture charge
- Standalone and the UltraTech dividend
- What do the segments show?
- What did the preview say?
- What the reports do not show
- What does the arithmetic show?
- How to read the next results
- How to read the filing
- What most people miss
- FAQs
- Sources
What did Grasim report in the Grasim Q2 results FY27, and why is it a loss?
Grasim reported a consolidated loss attributable to owners of Rs 234.08 crore for the quarter to 30 September 2026, against a profit of Rs 594.52 crore, on revenue of Rs 50,105 crore, up 26%. The loss follows a Rs 767 crore exceptional charge on a Canadian pulp joint venture; adjusted profit was Rs 536 crore.
The results came on Friday, 13 November 2026. Revenue was the highest ever for Grasim in a quarter on both the consolidated and standalone basis. The Grasim Q2 results FY27 therefore show two stories at once: growth in nearly every business and a write-off large enough to push the bottom line below zero.
| Grasim Q2 FY27 (quarter to 30 Sep 2026) | Q2 FY27 | Q2 FY26 | Change |
|---|---|---|---|
| Revenue from operations (consolidated) | Rs 50,105.18 crore | Rs 39,899.58 crore | +25.6% |
| EBITDA (company release basis) | Rs 6,513 crore | About Rs 5,210 crore (my calculation) | +25% |
| Profit before tax | Rs 2,695.92 crore | Rs 2,588.34 crore | +4.2% (my calculation) |
| Net loss or profit attributable to owners | -Rs 234.08 crore | Rs 594.52 crore | Swung to loss |
| Adjusted profit before exceptional items | Rs 536 crore | Rs 594.52 crore | -10% (my calculation: -9.8%) |
| Standalone revenue | Rs 12,747 crore | Rs 9,610 crore | +33% |
| Standalone profit | Rs 2,306 crore | Rs 805 crore | +187% |
Cite this table: Grasim Q2 FY27 per Upstox, TaxGuru, Investywise and Multibagg; changes marked my calculation were calculated by PositionalCalls.
These tie where I can test them. Rs 50,105.18 crore over Rs 39,899.58 crore is 25.6%. Rs 2,306 crore over Rs 805 crore is 186.5%. Adjusted profit of Rs 536 crore less the reported loss of Rs 234.08 crore is Rs 770 crore, close to the Rs 767 crore exceptional charge (my calculation, with a Rs 3 crore difference I cannot explain). Grasim did not report a loss on the business; it reported a loss after a one-time charge, which the sections below take apart.
Why do the sources show different numbers for the Grasim Q2 results FY27?
Sources differ because they report different layers of one result: the loss to owners, the profit before minorities, the standalone profit, and two definitions of EBITDA. Rs 234 crore loss, Rs 1,029.42 crore profit and Rs 2,306 crore profit are all correct for their own basis.
| Item | Figure A | Figure B | My reading |
|---|---|---|---|
| Which profit | Loss of Rs 234.08 crore to owners (Upstox, TaxGuru, Multibagg) | Profit of Rs 1,029.42 crore, -34.7% (Multibagg headline) | B is before the minorities’ share; A is the owners’ result |
| Standalone versus consolidated | Standalone profit Rs 2,306 crore, +187% | Consolidated loss Rs 234.08 crore | Standalone includes the UltraTech dividend |
| EBITDA | Rs 6,513 crore, +25% (company release basis) | Rs 9,722 crore, +27%, margin 19.4% (Upstox) | Different definitions; Upstox’s year-ago Rs 7,672 crore is not the Rs 5,217 crore in my preview |
| Exceptional charge | Rs 767 crore (owners) | Rs 773.02 crore total; standalone Rs 825 crore (Multibagg, Upstox) | Total adds Rs 6.29 crore UltraTech asset-sale loss |
| Year-ago owners’ profit | Rs 594.52 crore (Upstox; ties to the -10% adjusted fall) | Rs 553 crore (my preview base) | I use Rs 594.52 crore; the Rs 553 crore basis is not explained |
| Headline claim | TaxGuru: “record revenue and profit growth” | Consolidated reported profit moved to a loss | Record applies to revenue; profit growth applies to standalone only |
Cite this table: Grasim Q2 FY27 conflicts across sources, PositionalCalls, as of 13 November 2026, 3:45 PM IST.
The margin difference is large. At Rs 6,513 crore, the EBITDA margin is 13.0% (my calculation); at Rs 9,722 crore, Upstox gets 19.4%. I cannot tell what the Rs 3,209 crore gap between them covers, and no source says, so I have used the company figure. Investywise also reports that the standalone cash profit of Rs 3,968 crore equals the UltraTech dividend of Rs 3,968 crore; that may be coincidence or an error, and the filing will settle it.
How does profit before tax of Rs 2,695.92 crore become a loss in the Grasim Q2 results FY27?
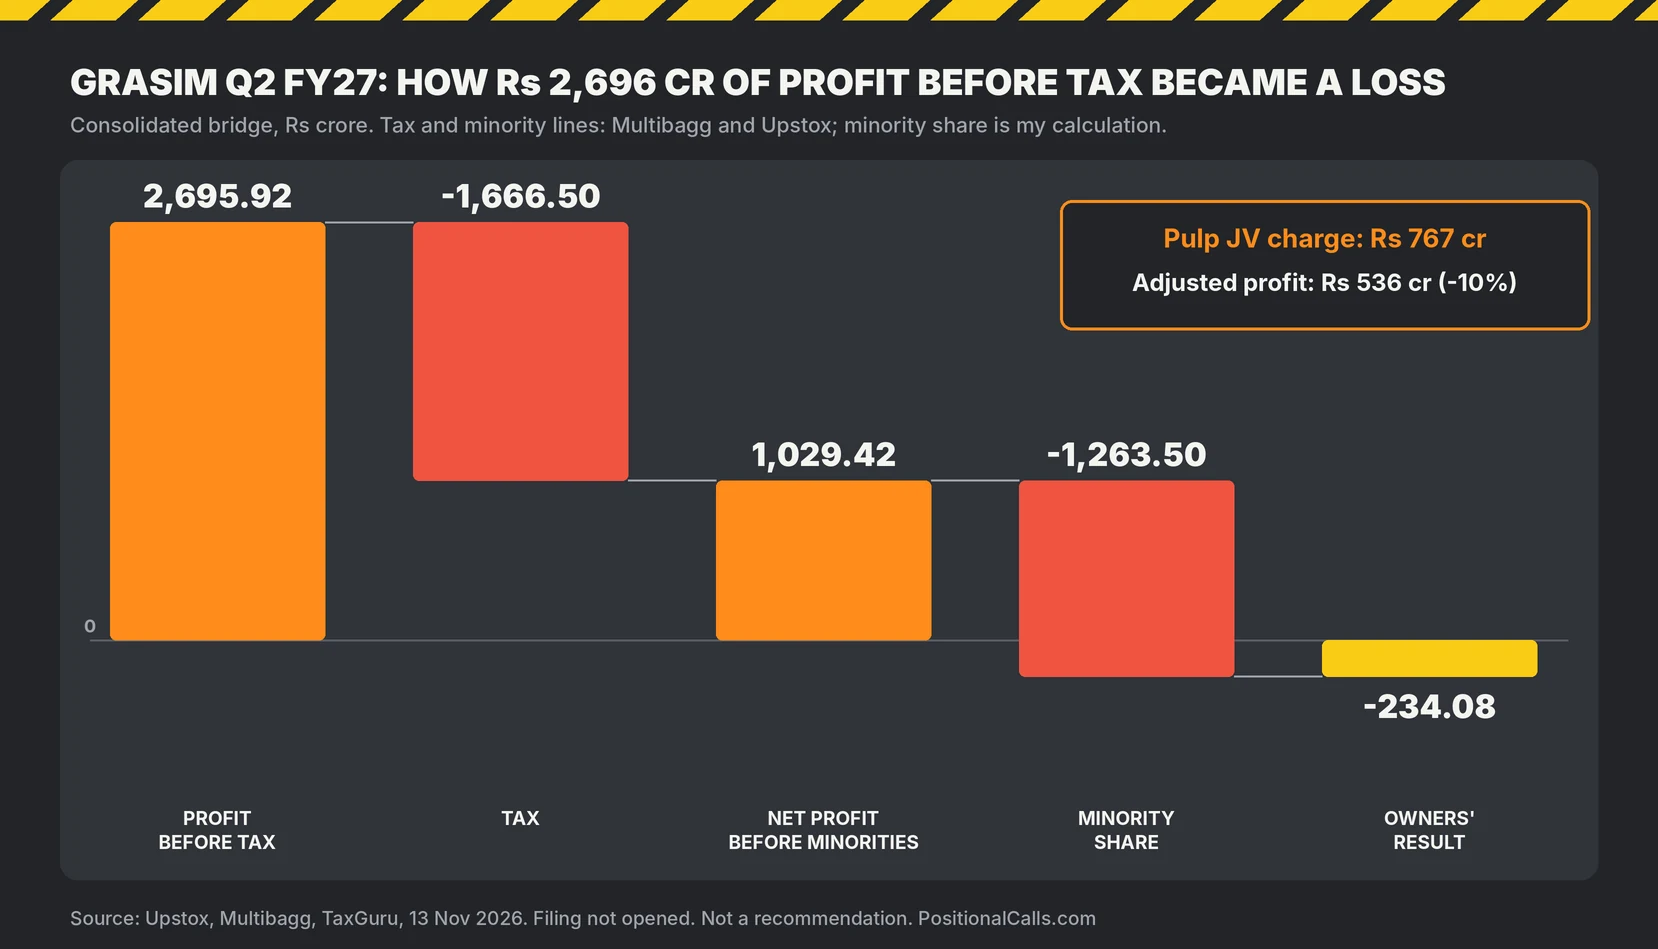
Profit before tax of Rs 2,695.92 crore, less tax of Rs 1,666.50 crore, gives consolidated net profit of Rs 1,029.42 crore. Minority shareholders then take about Rs 1,263.50 crore, leaving a loss of Rs 234.08 crore to Grasim’s owners (my calculation).
| Step (consolidated) | Q2 FY27 (Rs crore) | Q2 FY26 (Rs crore) | Note |
|---|---|---|---|
| Profit before tax (after exceptional items) | 2,695.92 | 2,588.34 | Multibagg |
| Tax expense | 1,666.50 | 1,012.02 | Tax rate 61.8% against 39.1% (my calculation) |
| Net profit before minorities | 1,029.42 | 1,576.32 | Ties: 2,695.92 – 1,666.50 |
| Owners’ profit or loss | -234.08 | 594.52 | Upstox |
| Implied minority share | 1,263.50 | 981.80 | My calculation: line before minorities less owners’ figure |
| Exceptional items | -773.02 | 0 | Includes Rs 766.73 crore pulp JV charge |
Cite this table: Grasim consolidated bridge from profit before tax to owners’ result, per Multibagg and Upstox; implied lines are my calculation.
Three things stand out. First, profit before tax grew 4.2% even after Rs 773.02 crore of exceptional charges, so before those charges it was about Rs 3,468.94 crore, up 34% (my calculation). Second, the tax rate jumped from 39.1% to 61.8%; I found no source that explains it. Third, minorities hold large stakes in UltraTech and Aditya Birla Capital, so a large share of consolidated profit never reaches Grasim’s own shareholders, and that share rose 28.7% on the year (my calculation).
What is the pulp joint-venture charge in the Grasim Q2 results FY27?
The charge relates to AV Group NB Inc., a Canadian pulp joint venture that temporarily idled its dissolving-grade pulp mill in Nackawic, New Brunswick. Consolidated, it is Rs 766.73 crore: Rs 128.72 crore of impairment and Rs 638.01 crore of provision for estimated exposure. Standalone, the figure is Rs 825 crore.
| Component | Rs crore | Source | Check |
|---|---|---|---|
| Impairment on equity and preference investment | 128.72 | Multibagg | Part of consolidated charge |
| Provision for estimated exposure | 638.01 | Multibagg | Part of consolidated charge |
| Consolidated AV Group NB charge | 766.73 | Multibagg | 128.72 + 638.01 = 766.73 (my calculation) |
| Loss on asset sale by UltraTech | 6.29 | Multibagg | Separate item |
| Total consolidated exceptional items | 773.02 | Multibagg | 766.73 + 6.29 = 773.02 |
| Charge attributable to owners | 767 | Upstox, TaxGuru | Rounds the AV Group charge |
| Standalone charge | 825 | Upstox, TaxGuru | Gap to consolidated not explained |
Cite this table: Grasim exceptional items, Q2 FY27, per Multibagg, Upstox and TaxGuru; sums by PositionalCalls.
The two figures differ and the sources do not say why, so I treat the Rs 58 crore gap (825 less 767) as unexplained. In the June 2026 quarter, exceptional items were only Rs 13.25 crore (Multibagg), so the Q2 charge is a step change, not a pattern.
Whether the charge repeats depends on the joint venture’s mill, which the company says is temporarily idled. A reader should look in the filing for the notes on the mill’s restart plan and on any further exposure, which the press reports do not describe.
Why is standalone profit up 187% in the Grasim Q2 results FY27?
Standalone profit rose 187% to Rs 2,306 crore from Rs 805 crore because Grasim booked a Rs 3,968 crore dividend from UltraTech Cement. The company says it is eliminated on consolidation. Standalone adjusted profit, before an Rs 825 crore charge, was Rs 3,132 crore, up 289%.
| Standalone (Rs crore) | Q2 FY27 | Q2 FY26 | Change |
|---|---|---|---|
| Revenue | 12,747 | 9,610 | +33% |
| EBITDA | 4,615 | 1,786 | +158% |
| Adjusted profit before exceptional items | 3,132 | Not stated | +289% |
| Exceptional charge | 825 | 0 | Pulp JV |
| Reported profit | 2,306 | 805 | +187% |
| UltraTech dividend received | 3,968 | Not found | Cash |
| EBITDA excluding the dividend | 647 | Not comparable | My calculation: 4,615 – 3,968 |
Cite this table: Grasim standalone Q2 FY27 per Multibagg, TaxGuru and Investywise; the ex-dividend line is my calculation.
Standalone EBITDA less the dividend leaves about Rs 647 crore (my calculation). I could not find last year’s UltraTech dividend, so I cannot say how much of the 158% EBITDA rise is dividend and how much is operations. Standalone adjusted profit of Rs 3,132 crore less the Rs 825 crore charge gives Rs 2,307 crore, matching the reported Rs 2,306 crore to within Rs 1 crore of rounding.
This is why a headline of “profit up 187%” and a headline of “net loss” can both be true for the Grasim Q2 results FY27. Standalone shows what Grasim itself earned, including an internal dividend; consolidated shows the group after eliminating it, after minorities and after the larger write-off.
PositionalCalls WhatsApp channel
The loss, then the layers
- The Grasim numbers as soon as they appear
- Exceptional items explained
- Links to updated posts
What do the segments show in the Grasim Q2 results FY27?
Segment revenue rose in every business: building materials 23% to Rs 27,377.81 crore, financial services 32% to Rs 13,990.35 crore, cellulosic fibres 29% to Rs 5,343.50 crore and chemicals 15% to Rs 2,758.95 crore. Chemicals result fell 10.8% on higher power costs.
| Segment (Rs crore) | Revenue Q2 FY27 | Q2 FY26 | Growth | Result Q2 FY27 | Result Q2 FY26 | Change |
|---|---|---|---|---|---|---|
| Building materials (cement, paints, B2B) | 27,377.81 | 22,253.32 | +23.0% | 3,510.47 | 2,949.60 | +19.0% |
| Financial services (ABCL) | 13,990.35 | 10,569.31 | +32.4% | 1,842.45 | 1,237.11 | +48.9% |
| Cellulosic fibres | 5,343.50 | 4,149.39 | +28.8% | 521.51 | 349.90 | +49.0% |
| Chemicals | 2,758.95 | 2,398.62 | +15.0% | 325.54 | 365.01 | -10.8% |
| Others | 1,157.83 | 996.44 | +16.2% | 283.92 | Not stated | n/a |
Cite this table: Grasim segment results, Q2 FY27, per Multibagg; growth rates calculated by PositionalCalls.
The segment revenues add to Rs 50,628.44 crore, Rs 523.26 crore above consolidated revenue of Rs 50,105.18 crore, which fits inter-segment eliminations (my calculation). The four segment results add to about Rs 6,484 crore, close to the Rs 6,513 crore EBITDA, but the segment results mix bases, so I do not treat that as a tie.
Birla Opus, Birla Pivot and the lending book
- Birla Opus (paints): revenue Rs 1,337 crore, up 35%, with volumes up 20%; the company targets a double-digit share of organised decorative paints by H2 FY27 (TaxGuru, company claim).
- Birla Pivot (B2B e-commerce): revenue Rs 2,785 crore, up 66%; the company targets EBITDA profitability in H2 FY27 (company claim).
- Aditya Birla Capital: total lending portfolio Rs 2,33,930 crore, up 32%; consolidated revenue Rs 13,990 crore, up 32%.
- Capex: FY27 standalone budget Rs 3,157 crore with Rs 1,022 crore spent in the first half (Upstox).
For paints peers see Asian Paints Q2 results FY27 and Berger Paints Q2 results FY27; for another group result, Hindalco net profit Q2 FY27.
What did the preview say, and how did the Grasim Q2 results FY27 compare?
The preview set a Q2 FY26 base of revenue Rs 39,900 crore, EBITDA Rs 5,217 crore and profit Rs 553 crore, and Q1 FY27 revenue of Rs 48,716 crore. Revenue came in 25.6% above the base and 2.9% above Q1, EBITDA 24.8% above the base, and the owners’ result was a loss.
| Preview mark | Preview value | Result | Comparison |
|---|---|---|---|
| Q2 FY26 revenue | Rs 39,900 crore | Rs 50,105 crore | +25.6% |
| Q2 FY26 EBITDA | Rs 5,217 crore | Rs 6,513 crore | +24.8% (my calculation) |
| Q2 FY26 owners’ profit | Rs 553 crore | -Rs 234.08 crore | Loss; Upstox year-ago Rs 594.52 crore |
| Q1 FY27 revenue | Rs 48,716 crore | Rs 50,105 crore | +2.9% (my calculation) |
| UltraTech Q2 profit | Rs 1,501 crore | Dividend of Rs 3,968 crore to Grasim | Different measure |
| ABCL Q2 profit | Rs 1,288 crore | ABCL segment result Rs 1,842.45 crore | Different measure |
Cite this table: Grasim preview marks against the result, PositionalCalls, as of 13 November 2026, 3:45 PM IST.
The preview did not carry an estimate, so there is nothing to beat or miss. I compare revenue with Q1 only, because the Q1 EBITDA and profit I recorded in the preview use bases I cannot tie to the Q2 company release. Read the preview at Grasim Q2 results date FY27.
What do the reports not show about the Grasim Q2 results FY27?
The reports I read do not show a dividend to Grasim shareholders, an analyst estimate, an official close, the minority share line, a reason for the 61.8% tax rate, the mill restart plan or the filing text. Only Upstox gives a post-result price: Rs 3,028.40, down 2.78%.
| Item | Found? | Why it matters |
|---|---|---|
| Dividend to Grasim shareholders | None found | Record date decides who is paid |
| Analyst estimate or consensus | No | Needed to say beat or miss |
| Official closing price | No (Upstox: Rs 3,028.40, -2.78%, time not stated) | Reaction after the full session |
| Minority share line | No, derived only | Explains owners’ loss against positive group profit |
| Reason for 61.8% tax rate | No | Moves net profit by hundreds of crore |
| Mill restart or further exposure | No | Decides if the charge repeats |
| Filing text | Not opened | All figures are headline-level |
Cite this table: Grasim items not found in the pages read, PositionalCalls, as of 13 November 2026, 3:45 PM IST.
Upstox’s price implies nothing about the result by itself; one afternoon reading will have changed. TaxGuru also reports trailing-twelve-month revenue of Rs 1,94,234 crore (+11%) and EBITDA of Rs 28,816 crore (+11%), which I could not test.
What does the arithmetic show for the Grasim Q2 results FY27?
Four checks hold: the profit bridge ties, the exceptional items add up, the standalone adjusted profit ties, and the loss equals adjusted profit less the charge within Rs 3 crore. Without the charge, owners’ profit would have been Rs 536 crore, down 9.8% on Rs 594.52 crore. This is my arithmetic.
| Check (my calculation) | Working | Result |
|---|---|---|
| Profit bridge | 2,695.92 – 1,666.50 | 1,029.42 (matches Multibagg) |
| Exceptional items | 766.73 + 6.29 | 773.02 (matches) |
| AV Group charge | 128.72 + 638.01 | 766.73 (matches) |
| Standalone adjusted profit | 2,306 + 825 | 3,131 against 3,132 reported |
| Loss without the charge | -234.08 + 767 | 532.92 against 536 adjusted; Rs 3 crore gap |
| Adjusted change | 536 / 594.52 – 1 | -9.8% |
| Revenue growth | 50,105.18 / 39,899.58 – 1 | +25.6% |
| EBITDA margin (company basis) | 6,513 / 50,105 | 13.0% against about 13.1% a year ago |
Cite this table: Grasim Q2 FY27 tie-outs by PositionalCalls from the sources listed.
The year-ago margin uses the Rs 5,217 crore base in my preview and Rs 39,900 crore of revenue, which gives about 13.1% (my calculation). So on the company’s basis the margin was flat, and the revenue growth did not widen it. That is the sober reading of the Grasim Q2 results FY27 under the headline of record revenue.
Two worked examples for a Grasim Q2 results FY27 reader
Example 1, remove the charge. Adding Rs 767 crore back to the Rs 234.08 crore loss gives about Rs 533 crore, close to the Rs 536 crore adjusted figure and 10% below last year’s Rs 594.52 crore. Example 2, the tax rate. At last year’s 39.1% rate on the same Rs 2,695.92 crore, tax would be about Rs 1,054 crore, or about Rs 612 crore less than reported (my calculation, ignoring minorities).
How do I read the next Grasim results after this one?
On the next results read, in this order: the exceptional items note, the profit split between owners and minorities, standalone dividend income, the segment results, the tax rate and cash flow. Compare each with the marks in this page.
| Order | Line to read | Mark to compare | Why it comes first |
|---|---|---|---|
| 1 | Exceptional items | Rs 773.02 crore; Q1 Rs 13.25 crore | Drove the loss |
| 2 | Owners’ versus minority profit | -Rs 234.08 crore; about Rs 1,263.50 crore | Shows what reaches shareholders |
| 3 | Standalone dividend income | Rs 3,968 crore from UltraTech | Lifts standalone only |
| 4 | Tax rate | 61.8% against 39.1% | Large swing |
| 5 | Segment results | Building 3,510.47; financial 1,842.45 | Where the profit comes from |
| 6 | Pulp JV note | Rs 766.73 crore charge | Whether more is expected |
Cite this table: Grasim reading order, PositionalCalls.
Any Grasim Q2 results FY27 article should say whether it is consolidated or standalone, owners’ or total profit, and which EBITDA it uses. If it does not, its numbers cannot be compared with this page.
How do I read the Grasim filing and avoid fake tips?
Open the NSE or BSE announcement for Grasim Industries Limited, not a link in a message, and read the results table, the exceptional items note and the segment note. Treat any tip that asks for an OTP, payment or login, or promises a target, as fake.
- Open the exchange announcement page for Grasim Industries Limited.
- Read the unaudited consolidated and standalone results for the quarter ended 30 September 2026.
- Note revenue, expenses, exceptional items, profit before tax and tax.
- Compare with Rs 50,105.18 crore, Rs 2,695.92 crore and Rs 1,029.42 crore.
- Read the profit split between owners and non-controlling interests.
- Check the board outcome for any dividend.
PositionalCalls is not SEBI-registered, gives no buy or sell calls and never asks for payment. Nothing here is investment advice.
What do most people miss in the Grasim Q2 results FY27?
Most readers of the Grasim Q2 results FY27 miss that the Rs 234 crore loss is after minorities and a one-time charge, that standalone profit is lifted by an internal dividend, that two EBITDA figures circulate, and that the tax rate rose to 61.8%.
Analyst’s note. What stands out: revenue grew 26% and profit before tax grew 4.2% even after a Rs 773 crore charge (my reading). What is easy to miss: the owners’ loss sits below a positive group profit because minorities took Rs 1,263.50 crore, and the tax rate rose about 23 points. What would change the view: a filing that shows a different split or a reason for the tax rate. Caution: figures come from news and summary pages and I did not open the filing; this note is reasoning, not a forecast or target. Reader action: read the exceptional items and non-controlling interest lines first.
Bottom line
The Grasim Q2 results FY27 show record revenue of Rs 50,105 crore, up 26%, and a consolidated loss of Rs 234.08 crore after a Rs 767 crore pulp joint-venture charge, with standalone profit up 187% on an UltraTech dividend. Read the minority split, tax rate and exceptional note before comparing profit. No call is made here.
PositionalCalls WhatsApp channel
Never miss an update
- Results dates and dividend news
- Numbers explained without tips or targets
- Updated posts as they go live
Grasim Q2 results FY27: frequently asked questions
What were the Grasim Q2 results FY27?
The Grasim Q2 results FY27 show a consolidated net loss of Rs 234.08 crore against a profit of Rs 594.52 crore, on revenue of Rs 50,105 crore, up 26%. A Rs 767 crore pulp joint-venture charge caused the loss. Adjusted profit was Rs 536 crore, down 10%.
Why did Grasim report a loss in Q2 FY27?
Grasim reported a loss because of a Rs 767 crore exceptional charge on AV Group NB Inc., a Canadian pulp joint venture that idled its mill. Minority shareholders also took about Rs 1,263.50 crore of group profit (my calculation). Without the charge, owners’ profit would be about Rs 533 crore.
Is Grasim profit up or down in Q2 FY27?
It depends on the basis. Consolidated profit to owners is a loss of Rs 234.08 crore, and consolidated profit before minorities fell 34.7% to Rs 1,029.42 crore. Standalone profit rose 187% to Rs 2,306 crore. The Grasim Q2 results FY27 need the basis stated.
Why is Grasim standalone profit up 187%?
Standalone profit rose to Rs 2,306 crore from Rs 805 crore because Grasim booked a Rs 3,968 crore dividend from UltraTech Cement, which is eliminated on consolidation. Adjusted standalone profit before an Rs 825 crore charge was Rs 3,132 crore, up 289%. Check this in the Grasim Q2 results FY27 filing.
What is the AV Group NB charge?
AV Group NB Inc. is a Canadian pulp joint venture whose dissolving-grade pulp mill in Nackawic, New Brunswick, is temporarily idled. The consolidated charge is Rs 766.73 crore: Rs 128.72 crore of impairment and Rs 638.01 crore of provision. The standalone charge is Rs 825 crore.
What was Grasim consolidated revenue in Q2 FY27?
Consolidated revenue from operations was Rs 50,105.18 crore, up 25.6% from Rs 39,899.58 crore, the highest ever for a quarter. Building materials contributed Rs 27,377.81 crore and financial services Rs 13,990.35 crore. These sit at the core of the Grasim Q2 results FY27.
What was Grasim EBITDA in Q2 FY27?
EBITDA was Rs 6,513 crore, up 25%, in the company release, which gives a margin of about 13.0% (my calculation). Upstox reports Rs 9,722 crore, up 27%, a different definition. I use the company figure. Check the filing for the exact Grasim Q2 results FY27 EBITDA.
Did Grasim declare a dividend with Q2 results?
I found no dividend to Grasim shareholders in the pages I read. The only dividend figure is Rs 3,968 crore that Grasim received from UltraTech. I have not opened the exchange filing, so check the board outcome on NSE or BSE for the final answer.
Upstox reported Grasim at Rs 3,028.40 on the NSE after the results, down 2.78%, without a time. That is one intraday reading, not a close, and I did not find an official closing price. It is not a signal for the Grasim Q2 results FY27.
No. PositionalCalls is not SEBI-registered and gives no buy or sell calls, targets or price zones. This page reports the Grasim Q2 results FY27 from press reports, with every derived number marked as my calculation. Read the filing and consult a qualified adviser before you invest.
Sources
- NSE India: corporate announcements: Grasim results filing.
- BSE India: corporate announcements: Grasim results filing.
- Upstox: Grasim Q2 FY27 results, 13 November 2026.
- Upstox: Q2 results live blog, 13 November 2026.
- TaxGuru: Grasim Q2 FY27, company release basis.
- Investywise: Grasim Q2 FY27; its cash-profit note is flagged.
- Multibagg: Grasim profit falls, AVNB charge; an automated summary.
- Multibagg: Grasim standalone profit; an automated summary.
Disclosure: PositionalCalls.com is not a SEBI-registered research analyst or investment adviser. Investments in securities markets are subject to market risks. Read all related documents carefully before investing. Returns are never guaranteed. PositionalCalls is an independent research and education site founded by Shubham Chaudhary. Nothing here is a recommendation, target or investment advice. How I researched this: for this page on the Grasim Q2 results FY27 I read Upstox, TaxGuru, Investywise and Multibagg, noted where sources differ, and marked every derived number as my calculation. I did not open any company filing or exchange document. Figures are as of 13 November 2026, 3:45 PM IST.

Shubham Chaudhary is the founder of PositionalCalls, an independent Indian stock market research website. He writes company fundamentals, quarterly results analysis, IPO analysis and sector research for NSE and BSE listed companies, with a focus on banking stocks, insurance and long-term value investing. Every article is built from primary sources such as RBI, SEBI, NSE and BSE filings and company annual reports, and states its risks plainly in simple language for retail investors.
Coverage areas Our research standards- Numbers checked against NSE, BSE and SEBI filings
- Risks and limits stated in every article
- No paid promotions or broker tie-ups
- Articles updated when new filings arrive