
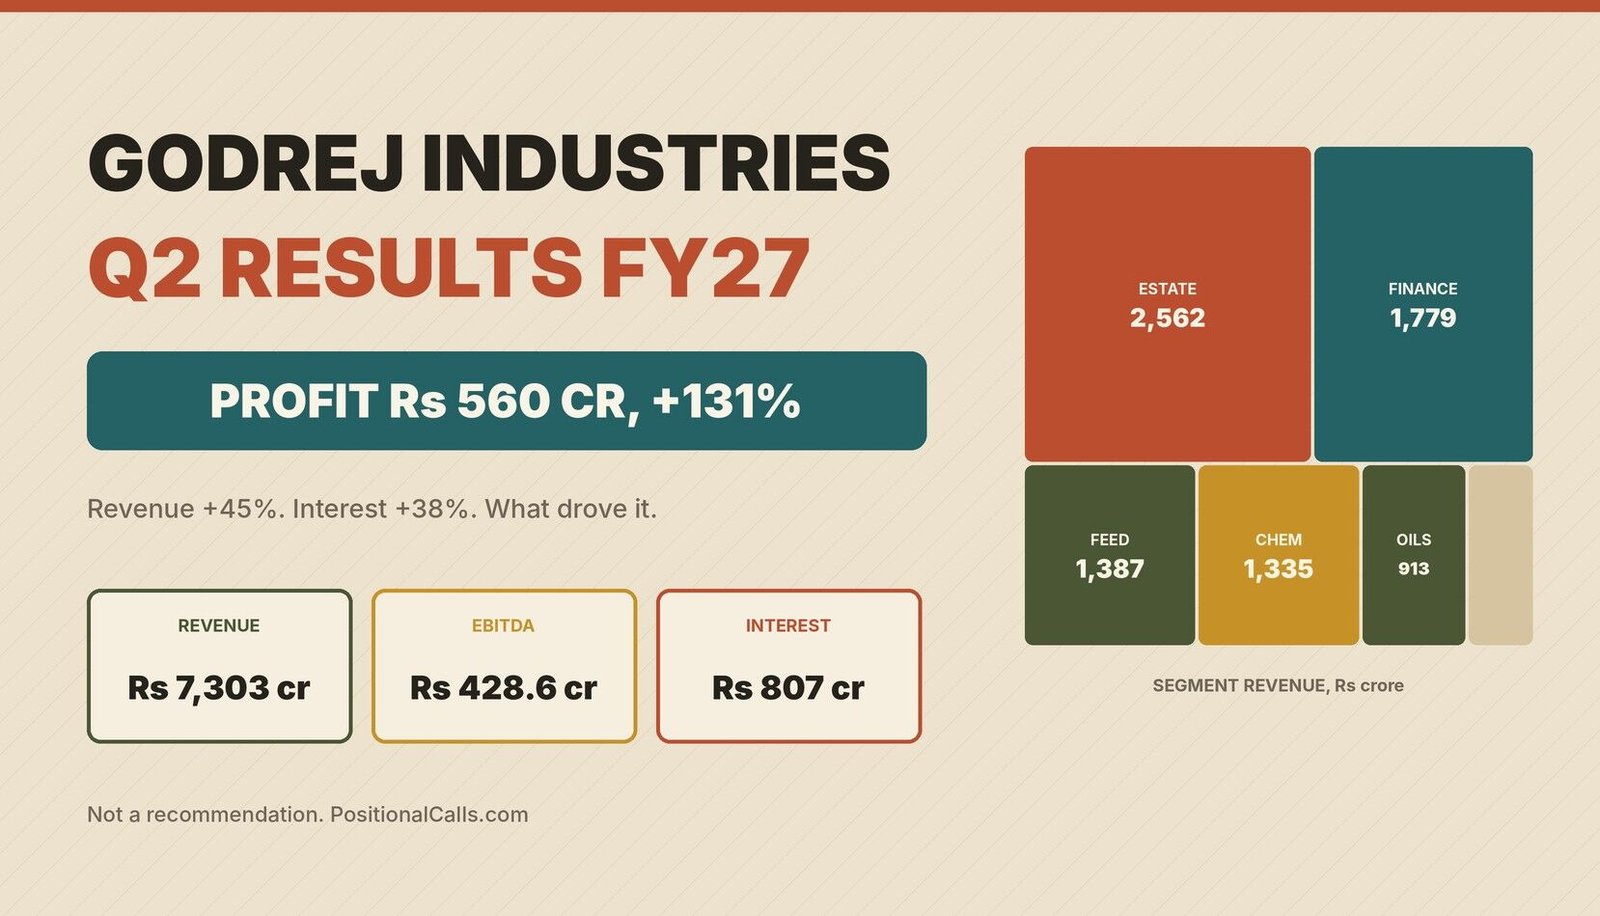
Results analysis · Diversified holding
Looking for the Godrej Industries Q2 results FY27? The group reported on 13 November 2026: net profit of Rs 560 crore, up 131%, and revenue of Rs 7,303 crore, up 45%. This page separates the headline from the interest bill, the segments and the tax and minority lines that no report itemises.
Quick answer
Godrej Industries Q2 results FY27: consolidated net profit was Rs 560 crore, up 131%, on revenue from operations of Rs 7,303 crore, up 45% (Upstox, Business Upturn). But PBIT less interest fell about 4% to Rs 696 crore as interest rose 38%, so the profit jump came from below that line (my calculation).
Latest update (Friday, 13 November 2026, 7:15 PM IST): Godrej Industries reported Q2 FY27 on Friday, 13 November 2026, after the NSE close; Business Upturn published at 4:34 PM IST and Upstox at 5:28 PM IST. Investywise and Multibagg carried the segment and cost lines. I did not find the tax line, the minority share, a dividend or a share price after the results, and I have not opened the exchange filing.
Key takeaways
- Headline: consolidated net profit of Rs 560 crore, up 130.9% from Rs 242.5 crore; revenue from operations of Rs 7,303 crore, up 45.1% from Rs 5,032 crore (Upstox, Business Upturn).
- Operating line: EBITDA was Rs 428.6 crore at a 5.9% margin, against Rs 133.8 crore and 2.7% a year ago (Business Upturn); PBDIT including associates was Rs 1,653 crore, up 16% (Investywise, Multibagg).
- The puzzle: PBIT rose 15% to Rs 1,503 crore but interest rose 38% to Rs 807 crore, so PBIT less interest fell from Rs 723 crore to Rs 696 crore, yet net profit more than doubled (my calculation).
- Segments: Finance and Investments made Rs 485 crore of PBIT, 48.8% of the profit-making total; Estate and Property Development made Rs 123 crore on the largest revenue, Rs 2,562 crore (Multibagg, before eliminations).
- Sequence: Q1 FY27 net profit was about Rs 284 crore, so Q2 was up about 97% on the quarter, while EBITDA fell from Rs 604.7 crore to Rs 428.6 crore (my calculation).
- Conflicts: revenue appears as Rs 7,303 crore and as total income of Rs 8,387 crore, and EBITDA as Rs 428.6 crore and as PBDIT of Rs 1,653 crore. Filing not opened.
In plain words: Godrej Industries is a holding group with chemicals, finance, property, animal feed, edible oils and stakes in listed Godrej companies. Profit more than doubled, but the operating profit after interest did not; the gain came from lower tax and minority lines, which the reports do not break out.
Data note: Figures are as of 13 November 2026, 7:15 PM IST and are consolidated unless stated, for the quarter to 30 September 2026. Headline lines come from Upstox and Business Upturn; PBIT, interest and segment lines from Investywise and Multibagg (an automated summary, with an AI disclaimer). Q1 FY27 and year-ago figures are from my Godrej Industries preview. Derived numbers are my calculation. Where sources differ I show both.
In this post
- What did Godrej Industries report?
- Why do the sources differ?
- Why did profit double?
- What did the segments show?
- How did Q2 compare with Q1 and H1?
- What about the share price?
- What did the preview say?
- What the reports do not show
- What does the arithmetic show?
- How to read the next results
- How to read the filing
- What most people miss
- FAQs
- Sources
What did Godrej Industries report in the Godrej Industries Q2 results FY27?
Godrej Industries reported consolidated net profit of Rs 560 crore for the quarter to 30 September 2026, up 130.9% from Rs 242.5 crore, on revenue from operations of Rs 7,303 crore, up 45% from Rs 5,032 crore. EBITDA was Rs 428.6 crore, a 5.9% margin.
The results came on Friday, 13 November 2026, after the NSE’s regular 3:30 PM close, so the first trading reaction falls on Monday, 16 November (my reading of the timing). This is the first full quarter reported under Executive Chairperson Pirojsha Godrej, who took the role on 14 August 2026 (per my preview). The headline is strong; the sections below test it.
| Godrej Industries Q2 FY27 (consolidated) | Q2 FY27 | Q2 FY26 | Change |
|---|---|---|---|
| Revenue from operations | Rs 7,303 crore | Rs 5,032 crore | +45.1% (my calculation) |
| Total income | Rs 8,387 crore | Rs 6,290 crore | +33% (Investywise, Multibagg) |
| EBITDA | Rs 428.6 crore (5.9%) | Rs 133.8 crore (2.7%) | +220.3% (Business Upturn) |
| PBDIT (includes associates) | Rs 1,653 crore | Rs 1,428 crore | +16% |
| PBIT (includes associates) | Rs 1,503 crore | Rs 1,307 crore | +15% |
| Interest | Rs 807 crore | Rs 584 crore | +38% (my calculation) |
| Net profit (after minority share) | Rs 560 crore | Rs 242.5 crore | +130.9% |
Cite this table: Godrej Industries Q2 FY27 per Upstox, Business Upturn, Investywise and Multibagg; lines marked my calculation were calculated by PositionalCalls.
These tie where I can test them. Rs 7,303 crore over Rs 5,032 crore is 45.13%, and net profit of Rs 560 crore is 7.7% of revenue against 4.8% a year ago (my calculation). The year-ago PBIT of Rs 1,307 crore and interest of Rs 584 crore match the figures in my preview. The result therefore carries two stories: a clear rise in revenue and net profit, and an operating line that grew far less than the headline.
Why do the sources show different numbers for the Godrej Industries Q2 results FY27?
Sources agree on net profit, but revenue appears as Rs 7,303 crore (revenue from operations) and Rs 8,387 crore (total income), and operating profit appears as EBITDA of Rs 428.6 crore and as PBDIT of Rs 1,653 crore. They are different lines, not errors.
| Item | Figure A | Figure B | My reading |
|---|---|---|---|
| Revenue | Rs 7,303 crore, revenue from operations (Upstox, Business Upturn) | Rs 8,387 crore, total income (Investywise, Multibagg) | Gap of Rs 1,084 crore is likely other income and associates; not itemised |
| Operating profit | EBITDA Rs 428.6 crore (Business Upturn) | PBDIT Rs 1,653 crore, includes associates and exceptional items (Multibagg) | Gap of about Rs 1,224 crore (my calculation); different definitions |
| Q1 FY27 net profit | Rs 284 crore (FPJ, my preview; H1 less Q2) | Rs 523 crore PAT before minority share (Kotak Neo, my preview) | Different lines; Rs 284 crore ties to H1 |
| H1 wording | “Declined” to Rs 844 crore (Upstox text) | Rs 844 crore against Rs 592 crore, up 43% (same page, tables) | Wording slip; the figures show a rise |
| Segment PBIT | Segment sum Rs 983 crore (Multibagg) | Consolidated PBIT Rs 1,503 crore | Gap of Rs 520 crore is not reconciled in the sources |
Cite this table: Godrej Industries Q2 FY27 conflicts across sources, PositionalCalls, as of 13 November 2026, 7:15 PM IST.
Compare each figure only with its own year-ago line. Revenue from operations of Rs 7,303 crore against Rs 5,032 crore is a like-for-like pair, as is total income of Rs 8,387 crore against Rs 6,290 crore. Mixing the two, for example dividing net profit by total income, would give a different margin without any real change.
Why did Godrej Industries net profit double when the interest bill rose?
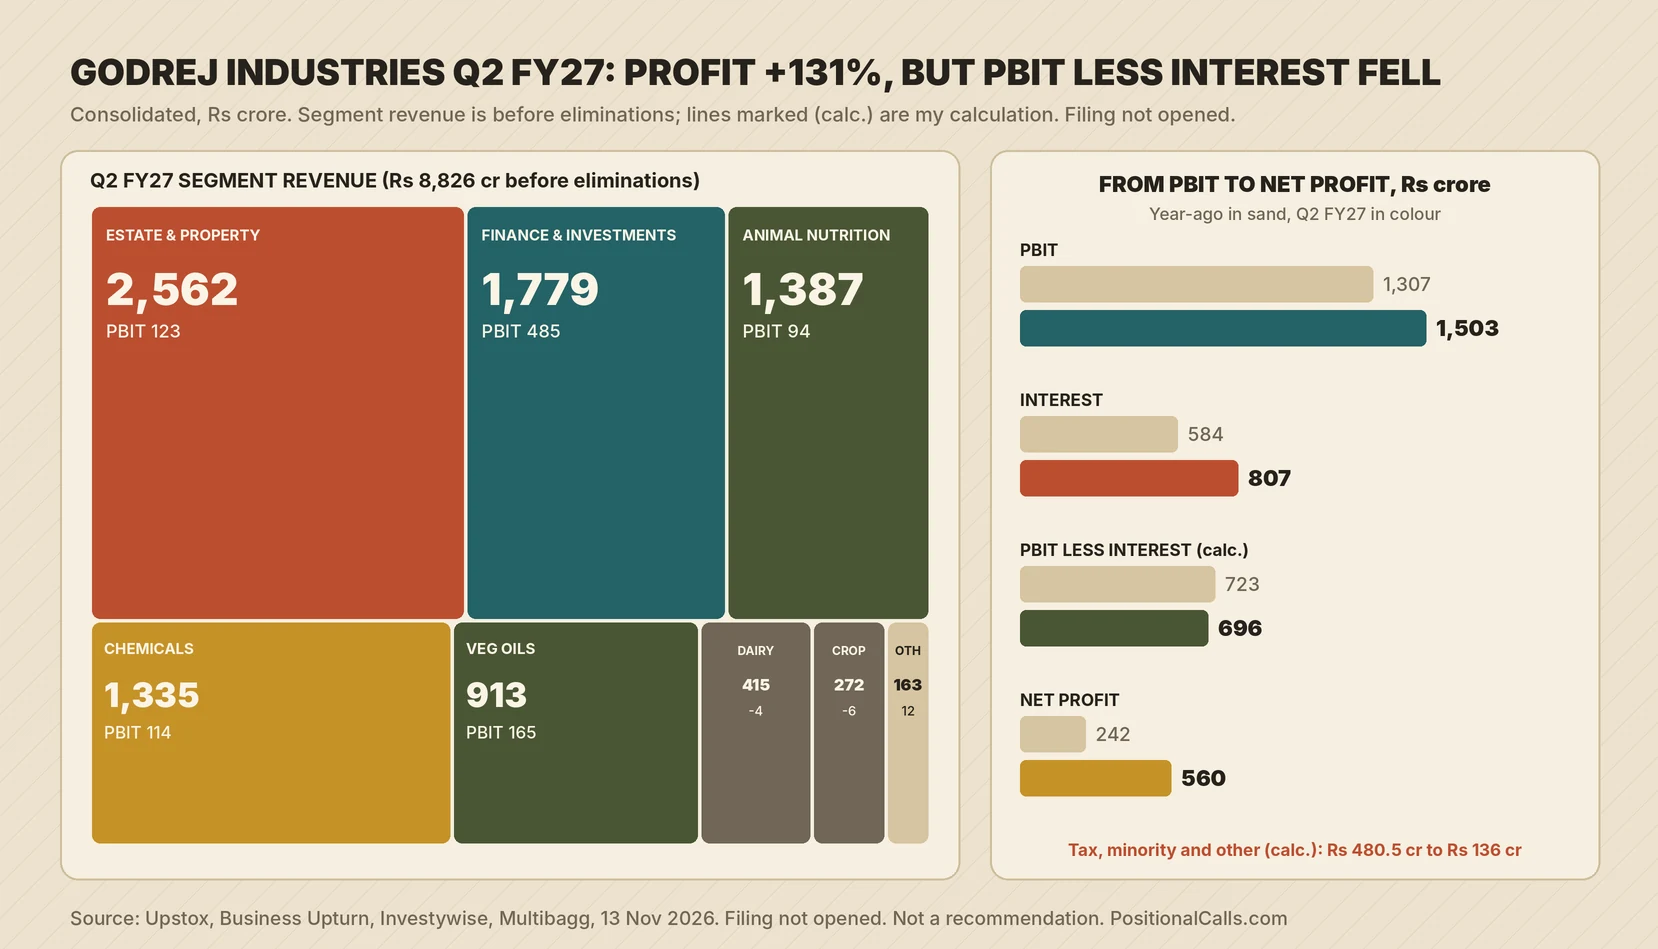
PBIT rose Rs 196 crore but interest rose Rs 223 crore, so PBIT less interest fell from Rs 723 crore to Rs 696 crore (my calculation). Net profit still rose Rs 318 crore, so tax, minority share and other lines must have shrunk sharply; no source itemises them.
| Step, Rs crore (consolidated) | Q2 FY27 | Q2 FY26 | Change |
|---|---|---|---|
| PBIT (includes associates and exceptional items) | 1,503 | 1,307 | +196 |
| Interest | 807 | 584 | +223 |
| PBIT less interest (my calculation) | 696 | 723 | -27, or -3.7% |
| Net profit after minority share | 560 | 242.5 | +317.5 |
| Tax, minority share and other (my calculation) | 136 | 480.5 | -344.5, or -72% |
| Q1 FY27 for reference: PBIT less interest, net profit, gap | 732, 284, 448 | Not shown | Q1 gap was also higher |
Cite this table: Godrej Industries Q2 FY27 bridge from PBIT to net profit, PositionalCalls, as of 13 November 2026, 7:15 PM IST; Q1 lines are H1 less Q2, my calculation.
The gap between PBIT less interest and net profit covers tax, the profit that belongs to minority shareholders of listed subsidiaries, and any other lines. It shrank from Rs 480.5 crore to Rs 136 crore. One possible driver is Godrej Properties, which reported a profit of Rs 154 crore, down 62%, in its own October results (per my preview, Kotak). If a listed subsidiary earns less, the share leaking to its minority holders falls, which lifts the owners’ profit. That is my reading, not a figure from any report, and I did not find the stake or the minority line to test it.
Which segments drove the Godrej Industries Q2 results FY27?
Finance and Investments earned the most segment profit, Rs 485 crore of PBIT, 48.8% of the profit-making total, on revenue of Rs 1,779 crore. Estate and Property Development had the largest revenue, Rs 2,562 crore, but only Rs 123 crore of PBIT. Dairy and Crop Care made small losses.
| Segment (before eliminations) | Revenue, Rs crore | PBIT, Rs crore | PBIT as % of revenue (my calculation) |
|---|---|---|---|
| Estate and Property Development | 2,562 | 123 | 4.8% |
| Finance and Investments | 1,779 | 485 | 27.3% |
| Animal Nutrition | 1,387 | 94 | 6.8% |
| Chemicals | 1,335 | 114 | 8.5% |
| Veg Oils | 913 | 165 | 18.1% |
| Dairy | 415 | -4 | Loss |
| Crop Care | 272 | -6 | Loss |
| Others and Hospitality | 163 | 12 | 7.4% |
Cite this table: Godrej Industries Q2 FY27 segments per Multibagg and Investywise; segment revenue is before inter-segment eliminations.
Segment revenue sums to Rs 8,826 crore against total income of Rs 8,387 crore, and segment PBIT sums to Rs 983 crore against consolidated PBIT of Rs 1,503 crore (my calculation). Neither gap is reconciled in the pages I read; eliminations, associates and unallocated items are the likely reasons, but that is my reading. Finance and Investments carries the interest cost of lending as well, so its PBIT is not a clean measure of what the group keeps.
The Estate segment is close to Godrej Properties’ reported total income of Rs 2,575 crore (per my preview), with the Rs 13 crore difference unexplained. Read the property business through Real estate sector outlook 2026 and the listed company’s own result.
How did the Godrej Industries Q2 results FY27 compare with Q1 and with the half-year?
Q2 was far better than Q1 on profit and revenue but weaker on EBITDA. Net profit rose from about Rs 284 crore to Rs 560 crore and revenue from Rs 5,448 crore to Rs 7,303 crore, while EBITDA fell from Rs 604.7 crore to Rs 428.6 crore. Half-year net profit was Rs 844 crore, up 43%.
| Consolidated, Rs crore | Q1 FY27 | Q2 FY27 | H1 FY27 | H1 FY26 |
|---|---|---|---|---|
| Revenue from operations | 5,448 | 7,303 | 12,751 | 9,492 |
| Total income | 6,360 | 8,387 | 14,747 | 12,009 |
| EBITDA | 604.7 | 428.6 | Not found | Not found |
| PBIT | 1,477 | 1,503 | 2,980 | 2,942 |
| Interest | 745 | 807 | 1,552 | 1,160 |
| Net profit | 284 | 560 | 844 | 592 |
Cite this table: Godrej Industries Q1, Q2 and H1 FY27; Q1 is H1 less Q2 for PBIT, interest and net profit (my calculation) and FPJ for revenue and EBITDA; H1 per Upstox, Investywise and Multibagg.
PositionalCalls WhatsApp channel
The profit, then the layers
- The Godrej Industries numbers as they appear
- Interest and tax lines explained
- Links to updated posts
The quarters tie: Rs 5,448 crore plus Rs 7,303 crore is Rs 12,751 crore, and Rs 284 crore plus Rs 560 crore is Rs 844 crore (my calculation). Over six months, PBIT rose only 1%, from Rs 2,942 crore to Rs 2,980 crore, while interest rose 34% to Rs 1,552 crore, so PBIT less interest fell from Rs 1,782 crore to Rs 1,428 crore (my calculation). The half-year profit rise of 43% therefore rests on the same below-the-line effect as the quarter.
Godrej Industries closed at Rs 1,117.1 on the NSE on 13 November, up 3.05%, before the results were published, so there is no price reaction yet. The first trading session after the results is Monday, 16 November (my reading).
| Item | Reading | Source and note |
|---|---|---|
| NSE close, 13 November 2026 | Rs 1,117.1, +3.05% | Upstox; before the results |
| Market capitalisation | Rs 37,631 crore | Upstox (NSE data) |
| 52-week high | Rs 1,443 on 10 July 2026 | Upstox; the close is about 22.6% below it (my calculation) |
| 52-week low | Rs 744.20 on 30 March 2026 | Upstox |
| Implied share count | About 33.7 crore | Market capitalisation over price, my calculation; ties to my preview |
| Net profit per share, Q2 | About Rs 16.6 | My calculation: Rs 560 crore over 33.7 crore; EPS not disclosed in the pages read |
Cite this table: Godrej Industries share data per Upstox, 13 November 2026; derived lines are my calculation.
I give no view on valuation. A per-share figure of about Rs 16.6 for one quarter is arithmetic on a share count I derived, and the filed EPS may differ with the weighted average.
How did the Godrej Industries Q2 results FY27 compare with the preview?
The preview set Q2 FY26 revenue at Rs 5,032 crore, net profit at Rs 242.5 crore and Q1 FY27 net profit at Rs 284 crore, and found no analyst estimate. Revenue and profit cleared those marks; there is no consensus, so I do not call a beat or miss.
| Preview mark | Preview value | Result | Comparison |
|---|---|---|---|
| Q2 FY26 revenue from operations | Rs 5,032 crore | Rs 7,303 crore | +45.1% |
| Q2 FY26 net profit | Rs 242.5 crore | Rs 560 crore | +130.9% |
| Q1 FY27 net profit | Rs 284 crore | Rs 560 crore | +97% on the quarter (my calculation) |
| Q2 FY26 PBIT and interest | Rs 1,307 crore; Rs 584 crore | Rs 1,503 crore; Rs 807 crore | +15%; +38% |
| Q1 FY27 EBITDA | Rs 604.7 crore (11.1%) | Rs 428.6 crore (5.9%) | Lower on the quarter |
| Dividend, consensus | None found | None found | Unchanged |
Cite this table: Godrej Industries preview marks against the result, PositionalCalls, as of 13 November 2026, 7:15 PM IST.
The preview said to read the conflicting total-income and revenue labels carefully, and the result confirmed it: both labels appear in the reports. Read the preview at Godrej Industries Q2 results date FY27.
What do the reports not show about the Godrej Industries Q2 results FY27?
The reports I read do not show the tax line, the minority share, the exceptional-item total, EPS, a dividend, an analyst estimate, the borrowing figure, subsidiary-level results beyond those in my preview, or a share price after the results. All figures are headline-level.
| Item | Found? | Why it matters |
|---|---|---|
| Tax and minority share | No; only the gap of Rs 136 crore by my calculation | Explains the profit jump |
| Exceptional items | No | PBIT includes them |
| Share of profit from associates | No | Included in PBIT and PBDIT |
| Dividend | None found | Record date decides who is paid |
| EPS | No | Per-share profit |
| Debt and cost of borrowing | Interest only | Interest rose 38% |
| Filing text | Not opened | All figures are headline-level |
Cite this table: Godrej Industries items not found in the pages read, PositionalCalls, as of 13 November 2026, 7:15 PM IST.
Two sources carry cautions. Multibagg shows an AI disclaimer, and the Upstox page contradicts itself on whether half-year profit rose or fell. I used both for figures that tie to other lines.
What does the arithmetic show for the Godrej Industries Q2 results FY27?
Seven checks hold: revenue growth, margin, quarterly sums, PBIT growth, the interest rise and the share count. One cannot be tested without the filing: the shrink in tax and minority lines from Rs 480.5 crore to Rs 136 crore.
| Check (my calculation) | Working | Result |
|---|---|---|
| Revenue growth | 7,303 / 5,032 – 1 | +45.1% |
| EBITDA margin | 428.6 / 7,303 | 5.9%, matches Business Upturn |
| Net margin | 560 / 7,303 | 7.7% against 4.8% a year ago |
| PBIT growth | 1,503 / 1,307 – 1 | +15.0%, matches |
| Interest growth | 807 / 584 – 1 | +38.2% |
| Q1 plus Q2 net profit | 284 + 560 | 844, matches H1 |
| Q1 plus Q2 revenue | 5,448 + 7,303 | 12,751, matches H1 |
| Share count | 37,631 / 1,117.1 | 33.7 crore |
Cite this table: Godrej Industries Q2 FY27 tie-outs by PositionalCalls from the sources listed.
Two worked examples for a Godrej Industries Q2 results FY27 reader
Example 1, the interest effect. If interest had stayed at Rs 584 crore, PBIT of Rs 1,503 crore would have left Rs 919 crore, Rs 223 crore more than the Rs 696 crore it did; the extra borrowing cost absorbed more than the PBIT gain of Rs 196 crore. Example 2, the margin gap. An EBITDA margin of 5.9% and a PBDIT of Rs 1,653 crore on total income of Rs 8,387 crore (19.7%) describe the same quarter with different definitions, so do not compare them with each other.
How do I read the next Godrej Industries results after this one?
On the next results, read in this order: PBIT less interest, interest cost and debt, the tax and minority lines, Finance and Investments PBIT, EBITDA against Q2’s Rs 428.6 crore, and Godrej Properties’ own profit. These show whether the profit rise repeats.
| Order | Line to read | Mark to compare | Why it comes first |
|---|---|---|---|
| 1 | PBIT less interest | Rs 696 crore; Rs 723 crore a year ago | The operating result after borrowing |
| 2 | Interest | Rs 807 crore, +38% | Growing faster than PBIT |
| 3 | Tax and minority share | Rs 136 crore by my calculation | Drove the profit jump |
| 4 | Finance and Investments PBIT | Rs 485 crore | Nearly half of segment profit |
| 5 | EBITDA | Rs 428.6 crore; Q1 Rs 604.7 crore | Fell on the quarter |
| 6 | Godrej Properties profit | Rs 154 crore, -62% (October) | Minority effect |
Cite this table: Godrej Industries reading order, PositionalCalls.
Any article on the Godrej Industries Q2 results FY27 should say whether it uses revenue from operations or total income, whether profit is after the minority share, and what the interest line did. If it does not, it is a headline, not a reading.
How do I read the Godrej Industries filing and avoid fake tips?
Open the NSE or BSE announcement for Godrej Industries Limited, not a link in a message, and read the consolidated results table, the segment note and the investor presentation. Never pay anyone for results tips.
- Open the exchange announcement page for Godrej Industries Limited.
- Read the unaudited consolidated results for the quarter ended 30 September 2026.
- Compare with Rs 7,303 crore, Rs 1,503 crore, Rs 807 crore and Rs 560 crore.
- Read the tax, non-controlling interest and exceptional items lines.
- Read the segment note and the notes on associates.
PositionalCalls is not SEBI-registered, gives no buy or sell calls and never asks for payment. Nothing here is investment advice.
What do most people miss in the Godrej Industries Q2 results FY27?
Most readers of the Godrej Industries Q2 results FY27 miss that PBIT less interest fell while net profit more than doubled, that EBITDA fell on the quarter, and that the segment totals do not reconcile to the consolidated figures.
Analyst’s note. What stands out: revenue grew 45% and net profit 131%, yet PBIT less interest slipped 3.7% (my calculation). What is easy to miss: the drop in the tax and minority gap from Rs 480.5 crore to Rs 136 crore carries the profit rise, and the cause is not itemised. Caution: figures come from news and summary pages and I did not open the filing; this note is reasoning, not a forecast or target. Reader action: read the tax and minority lines before treating Rs 560 crore as a base.
Bottom line
The Godrej Industries Q2 results FY27 show net profit of Rs 560 crore, up 131%, on revenue of Rs 7,303 crore, up 45%, with PBIT up 15%, interest up 38% and PBIT less interest down about 4%. The gaps are the tax and minority lines, EPS and the dividend, and this page gives no call. Read the preview at Godrej Industries Q2 results date FY27.
PositionalCalls WhatsApp channel
Never miss an update
- Results dates and dividend news
- Numbers explained without tips or targets
- Updated posts as they go live
Godrej Industries Q2 results FY27: frequently asked questions
What were the Godrej Industries Q2 results FY27?
The Godrej Industries Q2 results FY27 show consolidated net profit of Rs 560 crore, up 131% from Rs 242.5 crore, on revenue from operations of Rs 7,303 crore, up 45%. EBITDA was Rs 428.6 crore at 5.9%. I did not open the filing.
Why did Godrej Industries net profit rise 131% in Q2 FY27?
PBIT rose 15% to Rs 1,503 crore but interest rose 38%, so PBIT less interest fell about 4% (my calculation). The rest of the rise came from smaller tax, minority and other lines, down from Rs 480.5 crore to Rs 136 crore. No source itemises them.
What was Godrej Industries’ revenue in Q2 FY27?
Revenue from operations was Rs 7,303 crore, up 45% from Rs 5,032 crore, per Upstox and Business Upturn. Investywise and Multibagg give total income of Rs 8,387 crore, up 33%. They are different lines, so compare each only with its own year-ago figure.
What was Godrej Industries’ EBITDA in Q2 FY27?
Business Upturn gives EBITDA of Rs 428.6 crore, a 5.9% margin, up from Rs 133.8 crore and 2.7%. Multibagg gives PBDIT of Rs 1,653 crore, which includes associates and exceptional items. Q1 FY27 EBITDA was Rs 604.7 crore, so Q2 fell on the quarter.
Which Godrej Industries segment earned the most in Q2 FY27?
Finance and Investments earned PBIT of Rs 485 crore, 48.8% of the profit-making total, on revenue of Rs 1,779 crore. Estate and Property Development had the largest revenue, Rs 2,562 crore, with PBIT of Rs 123 crore. Segment figures are before eliminations.
How did Godrej Industries Q2 FY27 compare with Q1?
Net profit rose from about Rs 284 crore to Rs 560 crore and revenue from Rs 5,448 crore to Rs 7,303 crore, but EBITDA fell from Rs 604.7 crore to Rs 428.6 crore. Q1 net profit is H1 less Q2, my calculation. Half-year profit was Rs 844 crore, up 43%.
Nothing yet to report. Godrej Industries closed at Rs 1,117.1 on the NSE on 13 November, up 3.05%, before the results were published after the close. The first trading session after the Godrej Industries Q2 results FY27 is Monday, 16 November (my reading).
Did Godrej Industries declare a dividend with Q2 results?
I found no dividend in the pages I read for the Godrej Industries Q2 results FY27, and no mention of one in the summaries. Only the board outcome in the exchange filing can confirm a dividend and its record date, so check the BSE or NSE announcement.
Why do sources show different Godrej Industries figures?
They use different lines. Revenue from operations is Rs 7,303 crore and total income Rs 8,387 crore; EBITDA is Rs 428.6 crore and PBDIT Rs 1,653 crore. Upstox also says half-year profit “declined” while its figures show a rise from Rs 592 crore to Rs 844 crore.
Is this a buy or sell recommendation for Godrej Industries?
No. PositionalCalls is not SEBI-registered and gives no buy or sell calls, targets or price zones. This page reports the results from news and summary pages, I did not open the filing, and nothing here is investment advice. Consult a registered adviser before investing.
Sources
- NSE India: corporate announcements: Godrej Industries results filing.
- BSE India: corporate announcements: Godrej Industries results filing.
- Upstox: Godrej Industries Q2 FY27 results, 5:28 PM IST; revenue, EBITDA, price data; H1 wording slip noted.
- Business Upturn: Godrej Industries Q2 results, 4:34 PM IST; EBITDA and margin.
- Investywise: Godrej Industries Q2 and H1 FY27; total income, PBDIT, PBIT and segments.
- Multibagg: GIL Q2 net profit rises; interest and depreciation lines; an automated summary with an AI disclaimer.
- Multibagg: Godrej Industries Q2 profit mix; segment revenue and PBIT mix.
- Upstox: Q2 results live blog, 13 November 2026.
Disclosure: PositionalCalls.com is not a SEBI-registered research analyst or investment adviser. Investments in securities markets are subject to market risks. Read all related documents carefully before investing. Returns are never guaranteed. PositionalCalls is an independent research and education site founded by Shubham Chaudhary. Nothing here is a recommendation, target or investment advice. How I researched this: for this page I read Upstox, Business Upturn, Investywise and Multibagg, plus my own Godrej Industries preview for the year-ago and Q1 FY27 base, noted where sources differ, and marked every derived number as my calculation. I did not open any company filing or exchange document. Figures are as of 13 November 2026, 7:15 PM IST.

Shubham Chaudhary is the founder of PositionalCalls, an independent Indian stock market research website. He writes company fundamentals, quarterly results analysis, IPO analysis and sector research for NSE and BSE listed companies, with a focus on banking stocks, insurance and long-term value investing. Every article is built from primary sources such as RBI, SEBI, NSE and BSE filings and company annual reports, and states its risks plainly in simple language for retail investors.
Coverage areas Our research standards- Numbers checked against NSE, BSE and SEBI filings
- Risks and limits stated in every article
- No paid promotions or broker tie-ups
- Articles updated when new filings arrive