
Results analysis · Pharma
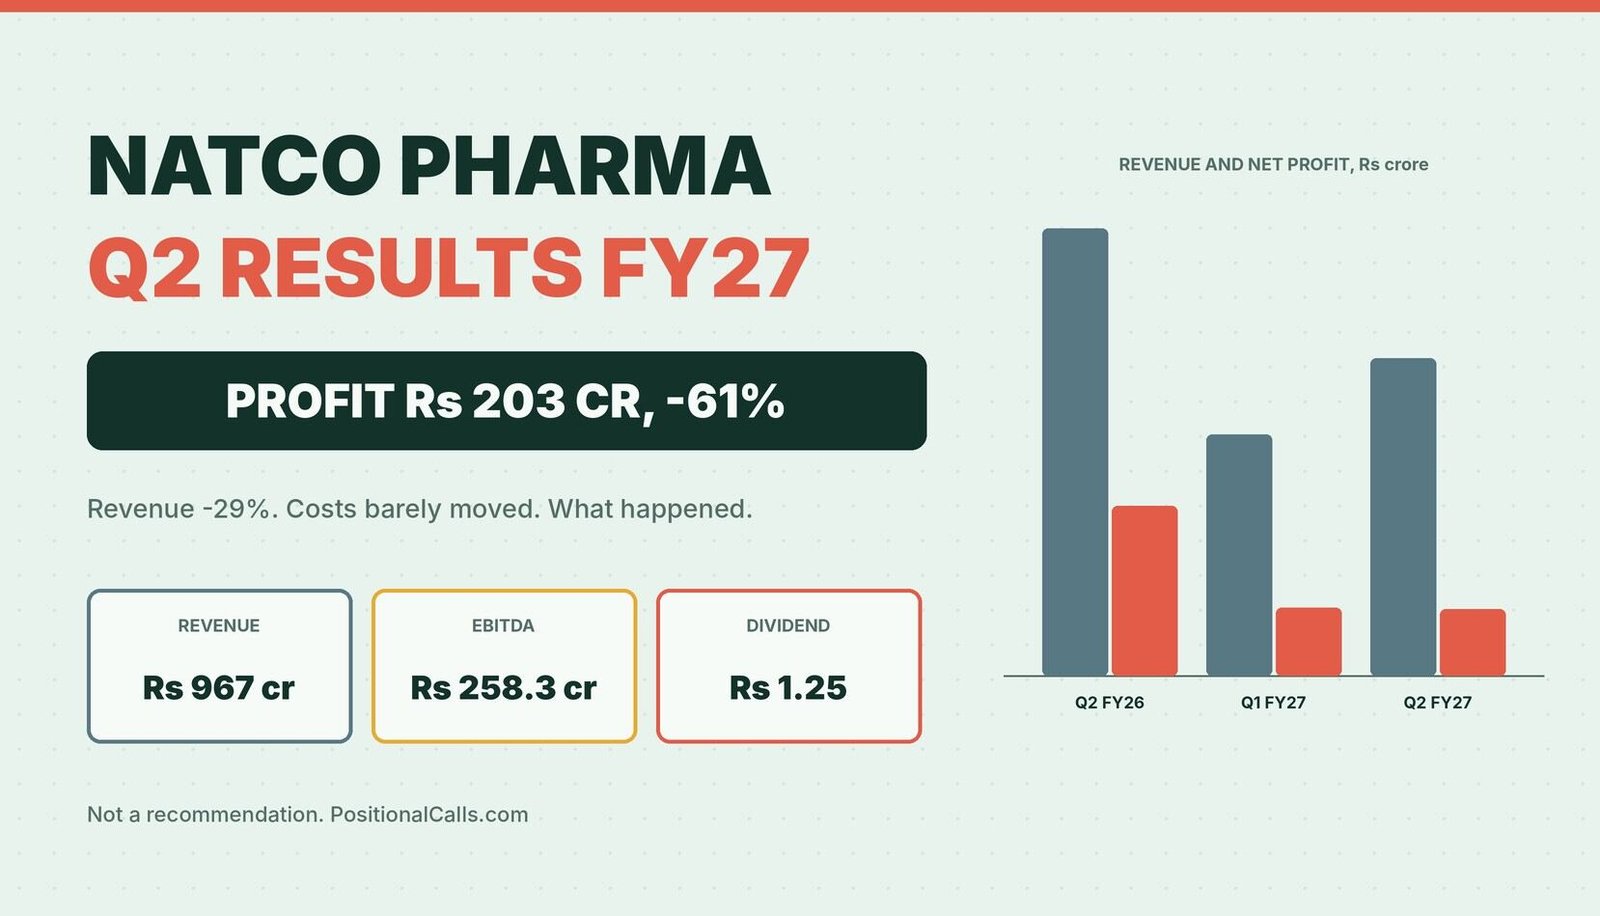
Looking for the Natco Pharma Q2 results FY27? Natco reported on 13 November 2026: net profit of Rs 203 crore, down 61%, and revenue of Rs 967 crore, down 29%. This page separates the year-on-year fall from the recovery on Q1, the two EBITDA definitions and the dividend.
Quick answer
Natco Pharma Q2 results FY27: consolidated net profit was Rs 203 crore, down 61% from Rs 518 crore, on revenue from operations of Rs 967 crore, down 29% (Business Upturn, PTI). EBITDA was Rs 258.3 crore at a 26.7% margin, and the board declared a second interim dividend of Rs 1.25 a share.
Latest update (Friday, 13 November 2026, 7:45 PM IST): Natco Pharma reported Q2 FY27 on Friday, 13 November 2026; Business Upturn published at 2:24 PM IST, Multibagg at 3:58 PM IST and PTI at 4:24 PM IST, and an earnings call was listed for 4:00 PM IST. I did not find the exchange filing time, the tax line, segment revenue, guidance or a call transcript, and I have not opened the filing.
Key takeaways
- Headline: consolidated net profit of Rs 202.6 crore, down 61% from Rs 517.9 crore; revenue from operations of Rs 967.3 crore, down 29% from Rs 1,363 crore (Business Upturn, PTI, Multibagg).
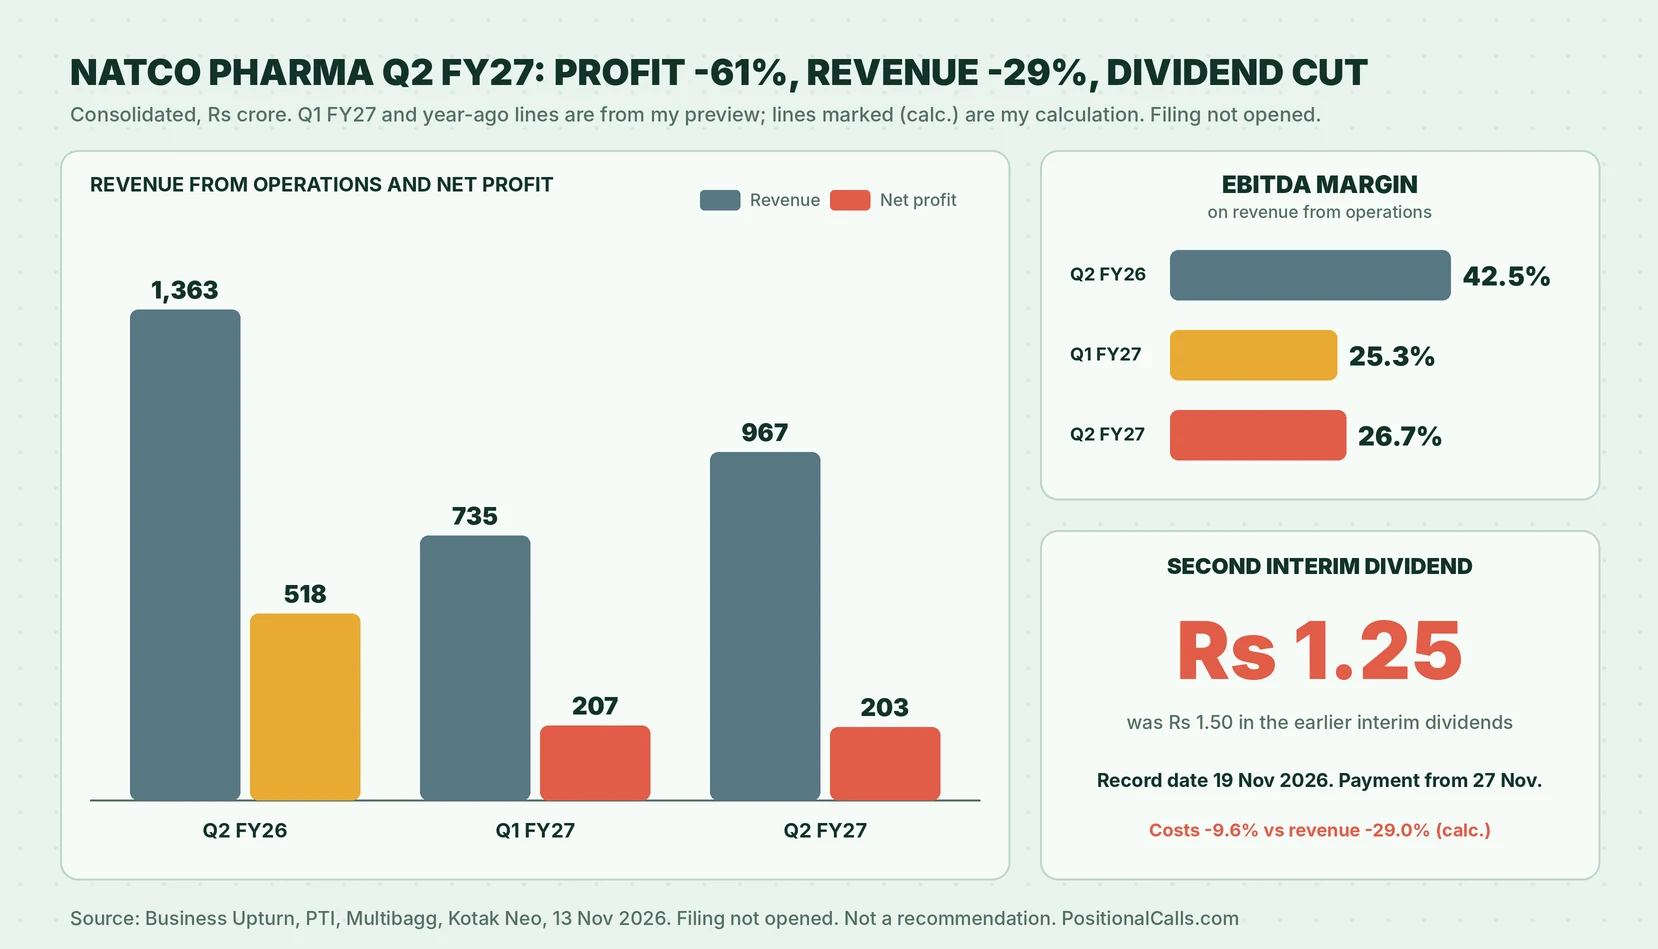
- Margin: EBITDA of Rs 258.3 crore, a 26.7% margin, against 42.5% a year ago and 25.3% in Q1 FY27 (Business Upturn; Kotak Neo for Q1).
- Costs did not fall with revenue: revenue fell 29.1% but operating costs fell only 9.6%, from Rs 784 crore to Rs 709 crore (my calculation).
- Sequence: revenue rose about 32% and EBITDA about 39% on Q1, yet net profit slipped 1.9% from Rs 206.5 crore, so lines below EBITDA absorbed the gain.
- Dividend: second interim dividend of Rs 1.25 a share, down from Rs 1.50; record date 19 November 2026, payment from 27 November (PTI, Multibagg).
- Share price: fell as much as 3.6% to Rs 779.65 on 13 November and was down 1.7% at Rs 795.05 at the last PTI reading; the cause is not stated. Filing not opened.
In plain words: Natco Pharma earned far less than a year ago because a very profitable cancer-drug generic, lenalidomide, brings in much less, while the cost base barely shrank. Profit was flat on Q1 even though sales rose, and the interim dividend was cut.
Data note: Figures are as of 13 November 2026, 7:45 PM IST and are consolidated unless stated, for the quarter to 30 September 2026. Headline lines come from Business Upturn and PTI (via tennews.in); the sequential and EPS lines from Multibagg (an automated summary, with an AI disclaimer). Q1 FY27 and year-ago figures are from my Natco Pharma preview. Derived numbers are my calculation. Where sources differ I show both.
In this post
- What did Natco Pharma report?
- Why do the sources differ?
- Why did profit fall 61%?
- How did Q2 compare with Q1 and H1?
- What about the dividend?
- What did the share price do?
- What did the preview say?
- What the reports do not show
- What does the arithmetic show?
- How to read the next results
- How to read the filing
- What most people miss
- FAQs
- Sources
What did Natco Pharma report in the Natco Pharma Q2 results FY27?
Natco Pharma reported consolidated net profit of Rs 202.6 crore for the quarter to 30 September 2026, down 61% from Rs 517.9 crore, on revenue from operations of Rs 967.3 crore, down 29% from Rs 1,363 crore. EBITDA was Rs 258.3 crore, a 26.7% margin.
The results came on Friday, 13 November 2026. Business Upturn published at 2:24 PM IST, during the market session, and PTI at 4:24 PM IST; I did not find the exchange filing time (my reading of the timing). The preview had listed the date as unconfirmed from an Upstox calendar, and the result confirmed it. Multibagg attributes the decline mainly to lower lenalidomide revenue but does not quantify it.
| Natco Pharma Q2 FY27 (consolidated) | Q2 FY27 | Q2 FY26 | Change |
|---|---|---|---|
| Revenue from operations | Rs 967.3 crore | Rs 1,363 crore | -29.0% (my calculation: -29.03%) |
| EBITDA | Rs 258.3 crore | Rs 579 crore | -55.4% |
| EBITDA margin | 26.7% | 42.5% | -1,580 bps |
| Other income | Rs 52 crore | Rs 100 crore | -48% |
| Net profit (after associate share) | Rs 202.6 crore | Rs 517.9 crore | -60.9% |
| Earnings per share | Rs 11.31 | Rs 28.94 | -60.9% (Multibagg) |
Cite this table: Natco Pharma Q2 FY27 per Business Upturn, PTI via tennews.in and Multibagg; lines marked my calculation were calculated by PositionalCalls.
These tie where I can test them. Rs 967.3 crore over Rs 1,363 crore is a fall of 29.0%, and net profit of Rs 202.6 crore over Rs 517.9 crore is a fall of 60.9% (my calculation). Rs 202.6 crore over an EPS of Rs 11.31 implies about 17.91 crore shares, the same count as in Q1 FY27 and in my preview, so no rights-issue shares appear in the weighted average (my reading).
Why do the sources show different revenue and EBITDA for the Natco Pharma Q2 results FY27?
Revenue appears as Rs 967 crore (revenue from operations) and Rs 1,019.4 crore (consolidated revenue including other income); EBITDA appears as Rs 258.3 crore and Rs 310 crore. The gaps are Rs 52 crore of other income in both cases, so they are different lines, not errors.
| Item | Figure A | Figure B | My reading |
|---|---|---|---|
| Revenue | Rs 967.3 crore, revenue from operations (Business Upturn, PTI) | Rs 1,019.4 crore, consolidated (Multibagg) | Gap of Rs 52 crore equals other income |
| EBITDA | Rs 258.3 crore, 26.7% of Rs 967.3 crore | Rs 310 crore, 30.4% of Rs 1,019.4 crore, before associate share (Multibagg) | Gap of Rs 51.7 crore, about other income (my calculation) |
| Year-ago EBITDA | Rs 579 crore, 42.5% | Rs 679.2 crore, 46.4% (Multibagg; Investywise in my preview) | Same pattern: the second includes other income |
| Net profit | Rs 203 crore (Business Upturn, PTI) | Rs 202.6 crore (Multibagg) | Rounding |
| Q1 FY27 EBITDA | Rs 186 crore, 25.3% (Kotak Neo) | Rs 245.7 crore, 30.9% of total revenue (Indian Pharma Post) | Same split; use matching lines |
Cite this table: Natco Pharma Q2 FY27 conflicts across sources, PositionalCalls, as of 13 November 2026, 7:45 PM IST.
The rule is to compare each pair only with its own year-ago line: Rs 258.3 crore with Rs 579 crore, and Rs 310 crore with Rs 679.2 crore. Mixing them would show a 54% fall in one place and a 55% fall in the other, a difference that comes only from the definition.
Why did Natco Pharma profit fall 61% in the Natco Pharma Q2 results FY27?
Revenue fell Rs 396 crore, but operating costs fell only Rs 75 crore, so EBITDA fell Rs 321 crore, almost the full Rs 315 crore fall in net profit (my calculation). Multibagg attributes the revenue fall mainly to lower lenalidomide sales; no source quantifies it.
| Step, Rs crore (consolidated) | Q2 FY27 | Q2 FY26 | Change |
|---|---|---|---|
| Revenue from operations | 967.3 | 1,363 | -395.7, or -29.0% |
| Operating costs (revenue less EBITDA, my calculation) | 709.0 | 784 | -75.0, or -9.6% |
| EBITDA | 258.3 | 579 | -320.7, or -55.4% |
| Costs as share of revenue (my calculation) | 73.3% | 57.5% | +15.8 points |
| Other income | 52 | 100 | -48 |
| Net profit | 202.6 | 517.9 | -315.3, or -60.9% |
Cite this table: Natco Pharma Q2 FY27 bridge, PositionalCalls, as of 13 November 2026, 7:45 PM IST; lines marked my calculation are derived.
Net profit fell by almost the same amount as EBITDA, which suggests the lines below EBITDA, depreciation, interest, tax and the share of the associate, changed little in total (my reading; none is itemised in the reports I read). Costs did not flex with sales: they took 73.3% of revenue against 57.5% a year ago. In my preview the year-ago quarter already carried higher R&D, bioequivalence and one-time bonus costs (Angel One), so part of the cost base is fixed or lumpy; the filing will show which lines moved.
How did the Natco Pharma Q2 results FY27 compare with Q1 and the half-year?
Q2 was better than Q1 on sales and EBITDA but flat on profit. Revenue rose from Rs 735 crore to Rs 967.3 crore, EBITDA from Rs 186 crore to Rs 258.3 crore, and the margin from 25.3% to 26.7%, yet net profit slipped 1.9% from Rs 206.5 crore to Rs 202.6 crore.
| Consolidated, Rs crore | Q2 FY26 | Q1 FY27 | Q2 FY27 | H1 FY27 | H1 FY26 |
|---|---|---|---|---|---|
| Revenue from operations | 1,363 | 735 | 967.3 | 1,702.3 | 2,692 |
| EBITDA | 579 | 186 | 258.3 | 444.3 | Not found |
| EBITDA margin | 42.5% | 25.3% | 26.7% | 26.1% | Not found |
| Net profit | 517.9 | 206.5 | 202.6 | 409.1 | 998.9 |
| EPS, Rs | 28.94 | 11.53 | 11.31 | 22.84 | Not found |
Cite this table: Natco Pharma Q2 FY26, Q1 FY27, Q2 FY27 and H1; Q1 per Kotak Neo and Indian Pharma Post in my preview, Q2 per Business Upturn and Multibagg; H1 lines are my calculation.
Half-year net profit was Rs 409.1 crore against Rs 998.9 crore, a fall of 59.0%, and half-year revenue was Rs 1,702.3 crore against Rs 2,692 crore, down 36.8% (my calculation, using Q1 FY26 figures from my preview). On Q1, revenue rose 31.6% and EBITDA 38.9%, but net profit fell 1.9% (my calculation). In Q1 the associate, Adcock Ingram, contributed Rs 84.3 crore, 40.8% of net profit (Indian Pharma Post, in my preview); the Q2 share was not found, so I cannot say whether it fell, and that is the first line to check.
The Q1 segment mix shows the cause of the year-on-year gap. International formulations fell to Rs 477.1 crore from Rs 1,120.9 crore, a fall of 57.4%, while domestic rose to Rs 136.4 crore and API to Rs 66.7 crore (Kotak Neo, in my preview). Q2 segment revenue was not in the reports I read.
What did Natco Pharma declare as a dividend with the Natco Pharma Q2 results FY27?
The board declared a second interim dividend of Rs 1.25 a share, 62.5% of the Rs 2 face value, with a record date of 19 November 2026 and payment from 27 November. The previous two interim dividends in my preview were Rs 1.50 a share.
| Item | Reading | Source and note |
|---|---|---|
| Second interim dividend FY27 | Rs 1.25 a share (62.5%) | PTI, Multibagg |
| Record date | 19 November 2026 | PTI, Multibagg |
| Payment | From 27 November 2026 | PTI, Multibagg |
| Earlier interim dividends | Rs 1.50 (Q2 FY26 and Q1 FY27) | My preview; a cut of 16.7% (my calculation) |
| Dividend against EPS | 11.1% of Rs 11.31 | My calculation: Rs 1.25 over Rs 11.31 |
| Total outgo | About Rs 22 crore | My calculation: Rs 1.25 on about 17.91 crore shares; the company figure was not found |
Cite this table: Natco Pharma dividend per PTI and Multibagg; derived lines are my calculation.
PositionalCalls WhatsApp channel
The profit, then the margin
- The Natco Pharma numbers as they appear
- Costs and dividend explained
- Links to updated posts
The rights issue approved on 9 September 2026 (2 shares for every 21, at Rs 750) is the other capital item; the result reports I read do not mention it, and my preview could not confirm that the 23 October allotment filing was the rights issue. Only the exchange filing can confirm the dividend terms and the rights-issue status. The record date of 19 November decides who is paid.
PTI reports that Natco fell as much as 3.6% to an intraday low of Rs 779.65 on 13 November and was down 1.7% at Rs 795.05 at its last reading. The page does not say whether the fall began before or after the results, so I do not attribute it to them.
| Item | Reading | Source and note |
|---|---|---|
| Intraday low, 13 November | Rs 779.65, -3.60% | PTI via tennews.in |
| Last reported trade | Rs 795.05, -1.70% | PTI; time not given |
| Implied previous close | About Rs 808.8 | My calculation: Rs 795.05 over 0.983 |
| Rights issue price | Rs 750 | My preview; last trade is about 6.0% above it (my calculation) |
| Q1 FY27 reaction | Rs 907 intraday on 14 August 2026 | My preview |
Cite this table: Natco Pharma share data per PTI via tennews.in, 13 November 2026; derived lines are my calculation.
The results were published during the session (Business Upturn 2:24 PM IST) and the call was listed for 4:00 PM IST, so intraday moves may mix several things. I give no view on valuation.
How did the Natco Pharma Q2 results FY27 compare with the preview?
The preview set the Q2 FY26 base at Rs 517.9 crore profit and Rs 1,363 crore revenue, Q1 FY27 at Rs 206.5 crore, and cited one consensus EPS of Rs 9.07. The result of Rs 11.31 is above that single mark, but I do not call a beat because the mark was one source of unknown basis.
| Preview mark | Preview value | Result | Comparison |
|---|---|---|---|
| Q2 FY26 net profit | Rs 517.9 crore | Rs 202.6 crore | -60.9% |
| Q2 FY26 revenue from operations | Rs 1,363 crore | Rs 967.3 crore | -29.0% |
| Q1 FY27 net profit | Rs 206.5 crore | Rs 202.6 crore | -1.9% on the quarter |
| Q1 FY27 EBITDA margin | 25.3% (Kotak Neo) | 26.7% | +140 bps |
| Consensus EPS (TipRanks, one source) | Rs 9.07 | Rs 11.31 | 24.7% above; implies about Rs 162 crore profit against Rs 202.6 crore (my calculation) |
| Results date | 13 November (Upstox, unconfirmed); 17 November (TipRanks) | 13 November | Upstox was right |
| Dividend | Rs 1.50 in earlier quarters | Rs 1.25 | Lower |
Cite this table: Natco Pharma preview marks against the result, PositionalCalls, as of 13 November 2026, 7:45 PM IST.
The preview flagged that the date was unconfirmed and that consensus rested on one source; both warnings were fair. Read the preview at Natco Pharma Q2 results date FY27.
What do the reports not show about the Natco Pharma Q2 results FY27?
The reports I read do not show the tax line, profit before tax, total expenses, Q2 segment revenue, the Adcock Ingram share, guidance, the lenalidomide amount, the rights-issue status, a call transcript or the exchange filing time. All figures are headline-level.
| Item | Found? | Why it matters |
|---|---|---|
| Lenalidomide revenue | No; only a stated cause | Explains most of the fall |
| Segment revenue | No for Q2; Q1 only | International drives the gap |
| Adcock Ingram share | No for Q2 | Was 40.8% of Q1 profit |
| Tax and profit before tax | No | Explains profit against EBITDA |
| Guidance and call | No; call listed 4:00 PM IST | Needed for the next quarters |
| Filing text | Not opened | All figures are headline-level |
Cite this table: Natco Pharma items not found in the pages read, PositionalCalls, as of 13 November 2026, 7:45 PM IST.
Multibagg shows an AI disclaimer, and a fourth source, ScanX, would not load for me, so I rely on three sources and mark the rest.
What does the arithmetic show for the Natco Pharma Q2 results FY27?
Seven checks hold: the fall in revenue, EBITDA margin, profit, EPS, the other-income gap, the share count and half-year totals. The change in below-EBITDA lines cannot be tested without the filing.
| Check (my calculation) | Working | Result |
|---|---|---|
| Revenue change | 967.3 / 1,363 – 1 | -29.0% |
| EBITDA margin | 258.3 / 967.3 | 26.7%, matches |
| Year-ago margin | 579 / 1,363 | 42.5%, matches |
| Profit change | 202.6 / 517.9 – 1 | -60.9% |
| Other-income gap in revenue | 1,019.4 – 967.3 | 52.1, matches Rs 52 crore |
| Share count | 202.6 / 11.31 | 17.91 crore, matches Q1 |
| H1 profit | 206.5 + 202.6 | 409.1 |
Cite this table: Natco Pharma Q2 FY27 tie-outs by PositionalCalls from the sources listed.
Two worked examples for a Natco Pharma Q2 results FY27 reader
Example 1, the cost base. If costs had fallen with revenue, at 57.5% of Rs 967.3 crore they would be about Rs 556 crore and EBITDA about Rs 411 crore; the actual EBITDA of Rs 258.3 crore is Rs 153 crore lower, so the heavier cost share cost about Rs 153 crore (my calculation). Example 2, the dividend. At Rs 1.25 a share, a holder of 100 shares receives Rs 125 before tax, against Rs 150 at the earlier rate.
How do I read the next Natco Pharma results after this one?
On the next results, read in this order: international formulations revenue, EBITDA margin against 26.7%, the Adcock Ingram share, R&D and other costs, net profit against Rs 202.6 crore, and the dividend. These show whether Q2 was a floor.
| Order | Line to read | Mark to compare | Why it comes first |
|---|---|---|---|
| 1 | International formulations revenue | Rs 477.1 crore in Q1; Q2 not found | Lenalidomide sits here |
| 2 | EBITDA margin | 26.7%; 25.3% in Q1 | Cost flex |
| 3 | Adcock Ingram share | Rs 84.3 crore in Q1 | Profit swing factor |
| 4 | R&D and other costs | Rs 709 crore operating costs | Costs did not fall |
| 5 | Net profit | Rs 202.6 crore | Flat on Q1 |
| 6 | Dividend | Rs 1.25 | Down from Rs 1.50 |
Cite this table: Natco Pharma reading order, PositionalCalls.
Any article on the Natco Pharma Q2 results FY27 should say which revenue and EBITDA line it uses and whether profit includes the associate. If it does not, it is a headline, not a reading.
How do I read the Natco Pharma filing and avoid fake tips?
Open the NSE or BSE announcement for Natco Pharma Limited, not a link in a message, and read the consolidated results table, the segment note and the dividend intimation. Never pay anyone for results tips.
- Open the exchange announcement page for Natco Pharma Limited.
- Read the unaudited consolidated results for the quarter ended 30 September 2026.
- Compare with Rs 967.3 crore, Rs 258.3 crore and Rs 202.6 crore.
- Read the segment note and the associate share.
- Confirm the dividend of Rs 1.25 and the record date of 19 November.
PositionalCalls is not SEBI-registered, gives no buy or sell calls and never asks for payment. Nothing here is investment advice.
What do most people miss in the Natco Pharma Q2 results FY27?
Most readers of the Natco Pharma Q2 results FY27 miss that costs fell far less than revenue, that profit was flat on Q1 despite higher EBITDA, that two EBITDA lines exist, and that the dividend was cut.
Analyst’s note. What stands out: revenue fell 29% but costs only 9.6%, so EBITDA more than halved (my calculation). What is easy to miss: Q2 improved on Q1 in sales and margin but not in profit, and the associate share is the missing line. Caution: figures come from news and summary pages and I did not open the filing; this note is reasoning, not a forecast or target. Reader action: read the segment note and the associate share before treating Rs 202.6 crore as a base.
Bottom line
The Natco Pharma Q2 results FY27 show net profit of Rs 202.6 crore, down 61%, revenue of Rs 967.3 crore, down 29%, an EBITDA margin of 26.7% and a lower dividend of Rs 1.25. The gaps are the lenalidomide amount, segments, the tax line and guidance, and this page gives no call. Read the preview at Natco Pharma Q2 results date FY27.
PositionalCalls WhatsApp channel
Never miss an update
- Results dates and dividend news
- Numbers explained without tips or targets
- Updated posts as they go live
Natco Pharma Q2 results FY27: frequently asked questions
What were the Natco Pharma Q2 results FY27?
The Natco Pharma Q2 results FY27 show consolidated net profit of Rs 202.6 crore, down 61% from Rs 517.9 crore, on revenue from operations of Rs 967.3 crore, down 29%. EBITDA was Rs 258.3 crore at 26.7%, and EPS was Rs 11.31. I did not open the filing.
Why did Natco Pharma profit fall 61% in Q2 FY27?
Multibagg attributes the decline mainly to lower lenalidomide revenue but gives no amount. Revenue fell 29.0% while operating costs fell only 9.6%, so EBITDA fell 55.4% (my calculation). Net profit fell by almost the same amount as EBITDA, so lines below it changed little in total.
Did Natco Pharma profit improve on Q1 FY27?
Not in profit. Revenue rose about 32% and EBITDA about 39% on Q1, but net profit slipped 1.9% from Rs 206.5 crore to Rs 202.6 crore (my calculation). The associate, Adcock Ingram, gave 40.8% of Q1 profit, and its Q2 share was not found.
What dividend did Natco Pharma declare with Q2 results?
The board declared a second interim dividend of Rs 1.25 a share, 62.5% of the Rs 2 face value, with a record date of 19 November 2026 and payment from 27 November, per PTI and Multibagg. The earlier interim dividends in my preview were Rs 1.50.
Which Natco Pharma EBITDA figure is right?
Both, on different bases. Rs 258.3 crore, a 26.7% margin, is on revenue from operations; Rs 310 crore, 30.4%, includes other income of about Rs 52 crore. Compare each only with its own year-ago figure, Rs 579 crore or Rs 679.2 crore, when reading the Natco Pharma Q2 results FY27.
PTI reports a fall of as much as 3.6% to Rs 779.65 and a last reading of Rs 795.05, down 1.7%. It does not say whether the fall began before or after the results, which were published during the session, so I do not attribute the move to the results.
Did Natco Pharma beat estimates in Q2 FY27?
I cannot call it. The preview found one consensus EPS of Rs 9.07, from TipRanks, and the result of Rs 11.31 is 24.7% above it (my calculation), but the source was single and its basis unknown. No broader analyst estimate was found for the Natco Pharma Q2 results FY27.
Was the Natco Pharma Q2 results date confirmed as 13 November?
Yes. My preview listed 13 November from an Upstox calendar as unconfirmed, and Natco reported that day; Business Upturn published at 2:24 PM IST and PTI at 4:24 PM IST. A TipRanks estimate of 17 November was wrong. I did not find the exchange filing time.
What do the reports not say about Natco Pharma Q2 FY27?
They do not give the lenalidomide amount, Q2 segment revenue, the tax line, the Adcock Ingram share, guidance or a call transcript, and the rights-issue status is not mentioned. These are the lines to read in the filing and the 4:00 PM call material.
Is this a buy or sell recommendation for Natco Pharma?
No. PositionalCalls is not SEBI-registered and gives no buy or sell calls, targets or price zones. This page reports the results from news and summary pages, I did not open the filing, and nothing here is investment advice. Consult a registered adviser before investing.
Sources
- NSE India: corporate announcements: Natco Pharma results filing.
- BSE India: corporate announcements: Natco Pharma results filing.
- Business Upturn: Natco Pharma Q2 results, 2:24 PM IST; revenue, EBITDA, margin.
- PTI via tennews.in: Natco Pharma Q2 net profit falls, 4:24 PM IST; dividend and share price.
- Multibagg: Natco Pharma Q2 profit falls, 3:58 PM IST; EPS, sequential lines; an automated summary with an AI disclaimer.
- Kotak Neo: Natco Pharma Q1 FY27 results, in my preview; segment and Q1 lines.
Disclosure: PositionalCalls.com is not a SEBI-registered research analyst or investment adviser. Investments in securities markets are subject to market risks. Read all related documents carefully before investing. Returns are never guaranteed. PositionalCalls is an independent research and education site founded by Shubham Chaudhary. Nothing here is a recommendation, target or investment advice. How I researched this: for this page I read Business Upturn, PTI (via tennews.in) and Multibagg, plus my own Natco Pharma preview for the year-ago and Q1 FY27 base, noted where sources differ, and marked every derived number as my calculation. I did not open any company filing or exchange document. Figures are as of 13 November 2026, 7:45 PM IST.

Shubham Chaudhary is the founder of PositionalCalls, an independent Indian stock market research website. He writes company fundamentals, quarterly results analysis, IPO analysis and sector research for NSE and BSE listed companies, with a focus on banking stocks, insurance and long-term value investing. Every article is built from primary sources such as RBI, SEBI, NSE and BSE filings and company annual reports, and states its risks plainly in simple language for retail investors.
Coverage areas Our research standards- Numbers checked against NSE, BSE and SEBI filings
- Risks and limits stated in every article
- No paid promotions or broker tie-ups
- Articles updated when new filings arrive