
Earnings · Asian Paints
Asian Paints reported its September quarter on 29 October 2026. Sales grew faster than profit. Here is what the numbers show, how they compare with the base and the estimate, and when to own the shares for the Rs 5.75 dividend.
Quick answer
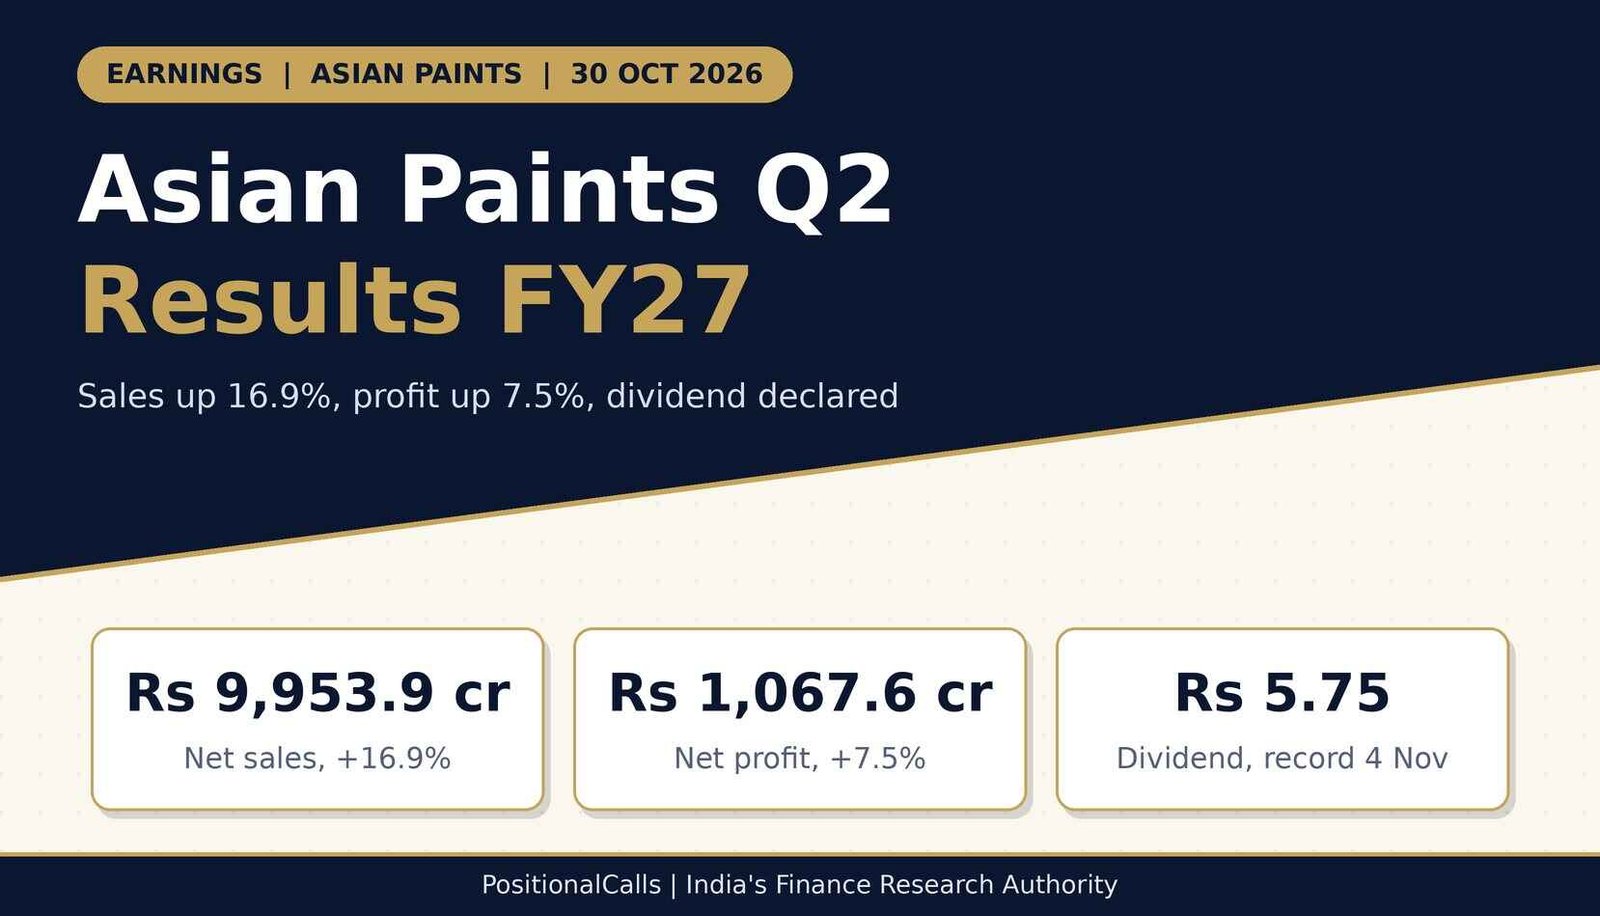
Asian Paints Q2 results FY27 show consolidated net sales of Rs 9,953.9 crore, up 16.9%, and net profit of Rs 1,067.6 crore, up 7.5%. The board declared an interim dividend of Rs 5.75 a share, record date Wednesday, 4 November 2026. Profit was about 4.3% below one reported estimate of Rs 1,115 crore.
Latest update (30 October 2026, 4:30 PM IST): Results and the Rs 5.75 dividend are out. Volume growth of 6.4% in decorative paints was below the 8% to 10% FY27 guidance, and a reported margin of 15.6% was below the Q2 FY26 base of 17.7%.
- 28 October 2026, 11:00 AM IST: preview stage. The board meeting was reported for 29 October; one estimate put profit at Rs 1,115 crore.
Key takeaways
- Sales: Rs 9,953.9 crore consolidated, up 16.9% on Rs 8,513.7 crore.
- Profit: Rs 1,067.6 crore after minority interest, up 7.5% on Rs 993.6 crore.
- Versus estimate: sales about 3.0% above and profit about 4.3% below the one reported estimate (my calculations).
- Volume: decorative volume grew 6.4% and value 14.5%, so price and mix added about 7.6% (my calculation).
- Dividend: Rs 5.75 a share against Rs 4.50 last year; record date Wednesday, 4 November 2026.
In plain words: The “base” is last year’s same quarter. PBDIT is operating profit before depreciation, interest, tax, other income and exceptional items. Minority interest is the share of subsidiary profit owned by outside shareholders. A “record date” decides who gets the dividend.
Data note: as of 30 October 2026, 4:30 PM IST. Figures are from results-day reports of Asian Paints’ exchange filing and press release; I have not opened the Q2 FY27 filing itself. Base-quarter figures follow the company’s 12 November 2025 release. One report shows standalone net profit of Rs 1,095.6 crore, identical to the international sales figure, so I have not used it. Derived numbers are labelled “my calculation”.
What did Asian Paints report in the Q2 results FY27?
Asian Paints reported Q2 FY27 consolidated net sales of Rs 9,953.9 crore, up 16.9%, and net profit after minority interest of Rs 1,067.6 crore, up 7.5%, for the quarter ended 30 September 2026.
| Consolidated, Rs crore | Q2 FY27 | Q2 FY26 (base) | Q1 FY27 | Change |
|---|---|---|---|---|
| Net sales | 9,953.9 | 8,513.7 | 10,521.4 | +16.9% YoY; −5.4% vs Q1 |
| Net profit after minority interest | 1,067.6 | 993.6 | 1,539.3 | +7.5% YoY; −30.6% vs Q1 |
| Net profit as % of sales (my calculation) | 10.7% | 11.7% | 14.6% | about 0.9 points lower YoY |
| Decorative volume / value growth | 6.4% / 14.5% | 10.9% / 6.0% | 9.0% / 16.6% | Volume below guidance |
| International net sales | 1,095.6 | 846.0 | 936.5 | +29.5% YoY |
| H1 net sales | 20,475.3 | 17,438.2 | +17.4% | |
| H1 net profit after minority interest | 2,606.9 | 2,093.4 | +24.5% |
Cite this table: PositionalCalls, “Asian Paints Q2 FY27 Results Table, as of 30 October 2026”.
Sales grew more than twice as fast as profit. Net profit as a share of sales slipped from 11.7% to 10.7% (my calculation), so each rupee of sales kept less as profit. The fall from Q1 (sales −5.4%, profit −30.6%) is mostly seasonal and margin-driven; Q1 FY27 was unusually strong. The fair comparison is Q2 against Q2.
Which Asian Paints profit figure should you use? The definitions check
Use Rs 1,067.6 crore, profit after minority interest, against Rs 993.6 crore for the +7.5% headline; compare it with the Rs 1,115 crore estimate only after checking which base that estimate used.
Asian Paints reports more than one profit line, and old pages often mix them. For Q2 FY26 the company headline was Rs 993.6 crore after minority interest and Rs 1,018.2 crore including minority interest, a gap of Rs 24.6 crore (my calculation). The Q2 FY27 results-day reports all quote the after-minority line, Rs 1,067.6 crore, with +7.5% measured against Rs 993.6 crore.
| Line | Q2 FY27 | Q2 FY26 | What to do |
|---|---|---|---|
| Net profit after minority interest (headline) | Rs 1,067.6 crore | Rs 993.6 crore | Use for the +7.5% growth rate |
| Net profit including minority interest | not seen in reports | Rs 1,018.2 crore | Check the filing before comparing with the estimate |
| Standalone net sales | Rs 8,423.6 crore (+14.8%) | Rs 7,335.9 crore | Asian Paints Limited alone |
| Standalone net profit | Rs 1,095.6 crore in one report | not confirmed | Identical to international sales; do not rely on it |
| Margin basis | 15.6% (one source) | 17.7% on net sales | 17.6% on revenue from operations; keep one basis |
Cite this table: PositionalCalls, “Asian Paints Profit Definitions Table, as of 30 October 2026”.
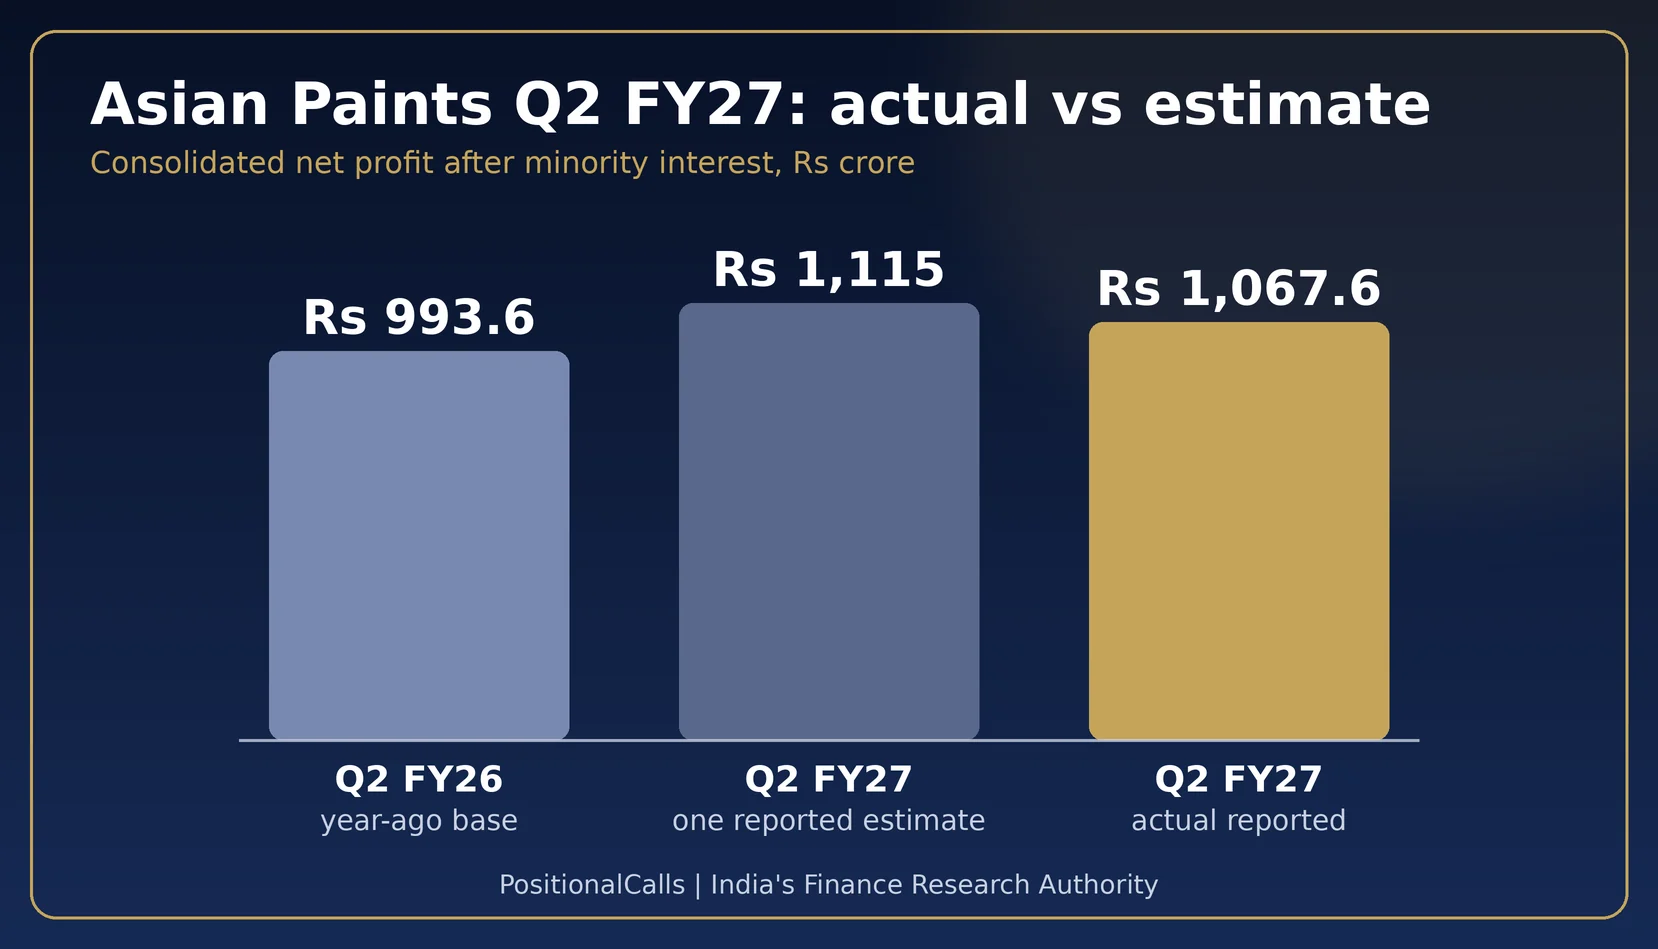
The one reported estimate of Rs 1,115 crore implied +9.5% growth, which works from a base of Rs 1,018.2 crore (my calculation). On the Rs 993.6 crore base the same estimate would have meant +12.2%. The reported +7.5% therefore falls short of the estimate on either base. A second source put the consensus slightly higher at Rs 1,120 crore.
Did Asian Paints beat estimates in Q2 FY27?
Sales beat by about 3.0% and volume was slightly ahead, but profit was about 4.3% below Rs 1,115 crore and the reported 15.6% margin was below the 17.0% estimate.
| Item | Estimate | Reported | Gap (my calculation) |
|---|---|---|---|
| Revenue | Rs 9,662 crore (one report) | Rs 9,953.9 crore net sales | +3.0% |
| Net profit | Rs 1,115 crore (one report) | Rs 1,067.6 crore | −4.3% |
| Net profit, second source | Rs 1,120 crore (consensus, as reported) | Rs 1,067.6 crore | −4.7% |
| Decorative volume growth | +6% | +6.4% | +0.4 points |
| Margin | About 17.0% | 15.6% (one source) | −1.4 points |
| Interim dividend | Not estimated | Rs 5.75 | Above last year’s Rs 4.50 |
Cite this table: PositionalCalls, “Asian Paints Estimate Versus Actual Table, as of 30 October 2026”.
Revenue and volume cleared the estimate but profit did not, which points at margin. The 15.6% figure comes from one source and compares sales with an operating profit line I have not seen. Confirm the PBDIT figure and its basis in the company release before quoting it. Estimates here are from reports, not a verified market consensus.
Was Asian Paints’ growth driven by volume or by price?
Price and mix did most of the work: decorative value grew 14.5% on 6.4% volume, so price and mix added about 7.6% (my calculation: 1.145 divided by 1.064).
| Decorative business in India | Volume | Value | Price and mix (my calculation) |
|---|---|---|---|
| Q2 FY26 (base) | +10.9% | +6.0% | about −4.5% |
| Q1 FY27 | +9.0% | +16.6% | about +6.9% |
| Q2 FY27 | +6.4% | +14.5% | about +7.6% |
Cite this table: PositionalCalls, “Asian Paints Volume and Value Table, as of 30 October 2026”.
Volume of 6.4% sits below the 8% to 10% FY27 guidance, though against a demanding Q2 FY26 base of 10.9%. The broader domestic coatings business grew volume 6.8% and value 16.4%. One reported estimate had assumed 6% volume and about 7% price, so the volume and price split was close to expectations while profit was not. That again points to input costs and mix, not demand.
| Business | Q2 FY27 net sales | Change | Note |
|---|---|---|---|
| International | Rs 1,095.6 crore | +29.5% (+23.7% in constant currency) | About 11.0% of consolidated sales (my calculation) |
| Bath fittings | Rs 94.0 crore | +18.5% | Q2 FY26: Rs 79.3 crore |
| Kitchen | Rs 110.3 crore | +13.0% | Q2 FY26: Rs 97.7 crore |
| H1 international | Rs 2,032.1 crore | +28.4% | Growth across regions, as reported |
International was the standout line. Asian Paints also reported commissioning a new VAE (vinyl acetate ethylene) plant at Dahej, per one results-day report; that is a supply-side item to watch for input-cost relief rather than a Q2 profit driver.
What is the margin worth in rupees?
On Rs 9,953.9 crore of sales, the reported 15.6% margin is about Rs 1,553 crore of operating profit; the Q2 FY26 base margin of 17.7% would have given about Rs 1,762 crore, a gap of about Rs 209 crore (my calculations).
| PBDIT margin | PBDIT on Rs 9,953.9 crore sales | Reading |
|---|---|---|
| 15.6% | Rs 1,553 crore | Reported by one source for Q2 FY27 |
| 17.0% | Rs 1,692 crore | Margin in the reported estimate |
| 17.7% | Rs 1,762 crore | Q2 FY26 base margin |
| 18.0% | Rs 1,792 crore | Bottom of FY27 guidance |
| 20.0% | Rs 1,991 crore | Top of FY27 guidance |
Cite this table: PositionalCalls, “Asian Paints Margin in Rupees Table, as of 30 October 2026”.
My calculation multiplies Rs 9,953.9 crore by each margin. Each point of margin is worth about Rs 99.5 crore. The reported 15.6% is 2.4 points below the bottom of the 18% to 20% FY27 guidance, though Q1 FY27 at 20.6% sat above it, so guidance is judged over the year, not a single quarter. Management has said Q2 usually carries margin pressure from mix and seasonality.
What does the H1 FY27 arithmetic show?
H1 FY27 net sales of Rs 20,475.3 crore are up 17.4% and net profit of Rs 2,606.9 crore is up 24.5%, so the strong Q1 more than offset the softer Q2 profit growth.
| Half-year view | H1 FY27 | H1 FY26 | Change |
|---|---|---|---|
| Net sales | Rs 20,475.3 crore | Rs 17,438.2 crore | +17.4% |
| Net profit after minority interest | Rs 2,606.9 crore | Rs 2,093.4 crore | +24.5% |
| Net profit as % of sales (my calculation) | 12.7% | 12.0% | +0.7 points |
| Q2 share of H1 profit (my calculation) | 41.0% | Q1 carried 59.0% |
Cite this table: PositionalCalls, “Asian Paints H1 FY27 Table, as of 30 October 2026”.
The preview’s arithmetic table showed that Q2 sales growth of 16% would give H1 sales growth of 17.0%. Actual Q2 growth was 16.9% and H1 growth came in at 17.4%, in line with that scenario. Q1 plus Q2 reconciles exactly: Rs 1,539.3 crore plus Rs 1,067.6 crore equals Rs 2,606.9 crore.
PositionalCalls WhatsApp channel
Follow Asian Paints filings, not forwards
- Plain-language summary of each filing
- Record-date and buy-by reminders for the dividend
- Corrections flagged openly when numbers change
What dividend did Asian Paints declare, and what is the record date?
Asian Paints declared an interim dividend of Rs 5.75 per share, face value Re 1, with record date Wednesday, 4 November 2026; the last day to buy under T+1 is Tuesday, 3 November 2026.
| Financial year | Dividend per share | Note |
|---|---|---|
| FY27 | Interim Rs 5.75 | Declared 29 October 2026; record date 4 Nov 2026 |
| FY26 | Interim Rs 4.50 + final Rs 23 = Rs 27.50 | Interim record date 18 Nov 2025; final record date 23 Jun 2026 |
| FY25 | Interim Rs 4.25 | As reported |
| FY24 | Interim Rs 5.15 | Often wrongly shown as FY26 |
Cite this table: PositionalCalls, “Asian Paints Dividend History Table, as of 30 October 2026”.
The FY27 interim is 27.8% above the FY26 interim of Rs 4.50 (my calculation). Some pages still show Rs 5.15 as the latest interim; that was FY24’s. The payment date was not captured in the reports I saw, so confirm it in the board outcome. Last year payment was on or after 27 November 2025.
- Buy by Tuesday, 3 November 2026: the last trading day before the record date.
- Hold on Wednesday, 4 November 2026: under T+1 the ex-date and record date are the same.
- Check the payment date: read it in the board outcome on the exchanges.
- Keep the contract note: you need it for tax records and any TDS credit.
What is the Rs 5.75 Asian Paints dividend worth in rupees?
100 shares receive Rs 575, 500 shares Rs 2,875 and 1,000 shares Rs 5,750 before tax; at 2,000 shares the Rs 11,500 payout may attract TDS of Rs 1,150 at 10% (my calculations).
| Shares held | Dividend at Rs 5.75 | Dividend at last year’s Rs 4.50 | TDS if applicable (10%) |
|---|---|---|---|
| 100 | Rs 575 | Rs 450 | none (below Rs 10,000) |
| 500 | Rs 2,875 | Rs 2,250 | none (below Rs 10,000) |
| 1,000 | Rs 5,750 | Rs 4,500 | none (below Rs 10,000) |
| 2,000 | Rs 11,500 | Rs 9,000 | Rs 1,150 |
Cite this table: PositionalCalls, “Asian Paints Dividend Rupee Table, as of 30 October 2026”.
TDS under Section 194 is generally 10% for residents when dividends from one company exceed Rs 10,000 in a financial year. Confirm the current rule; our guide to tax on shares and dividend TDS sets out the worked cases. Dividends are also taxable at your slab rate, so TDS is not the final tax. NRI investors face different withholding; see the NRI investment guide.
What should you verify in the Asian Paints filing before quoting these numbers?
Check the PBDIT line and its margin basis, the profit line including minority interest, any exceptional items and the dividend payment date, because results-day reports are thin on each.
| What to read | Reported mark | Question to ask |
|---|---|---|
| PBDIT and margin | 15.6% (one source) against 17.7% base | Which sales line is the margin divided by? |
| Net profit definitions | Rs 1,067.6 crore after minority interest | What is the profit including minority interest? |
| Exceptional items | None reported in the sources seen | Any one-off in the notes to the accounts? |
| Standalone profit | One report shows Rs 1,095.6 crore | Does it match the standalone filing? |
| Dividend | Rs 5.75; record date 4 Nov 2026 | Payment date and total outgo? |
| Guidance | 8% to 10% volume; 18% to 20% margin | Did the call keep or change guidance? |
Cite this table: PositionalCalls, “Asian Paints Filing Verification Table, as of 30 October 2026”.
How did the 28 October preview compare with the actual results?
The preview got the date and the 4 November record date right, but its profit and margin estimates were too high and its sales estimate was too low.
| Preview item (28 October 2026) | Preview said | Results-day reports show | Status |
|---|---|---|---|
| Board meeting date | 29 October 2026 | 29 October 2026 | Confirmed |
| Dividend record date | 4 November 2026 if declared | 4 November 2026 | Confirmed |
| Interim dividend | Rs 4.50 last year; amount open | Rs 5.75 | Higher than last year |
| Revenue estimate | Rs 9,662 crore | Rs 9,953.9 crore | Beat by 3.0% |
| Net profit estimate | Rs 1,115 crore | Rs 1,067.6 crore | Missed by 4.3% |
| Decorative volume | +6% estimate; guidance 8% to 10% | +6.4% | Below guidance |
| Q2 FY26 base | Rs 8,513.7 crore; Rs 993.6 crore | Same bases used in reports | No correction needed |
Cite this table: PositionalCalls, “Asian Paints Preview Versus Actual Table, as of 30 October 2026”.
What should you watch next after the Asian Paints Q2 results FY27?
Watch the 4 November record date, then volume against the 8% to 10% guidance, input-cost relief and the margin path back towards 18% in the December quarter.
- 4 November 2026: record date; check the exchange for the ex-date marker.
- Volume: 6.4% in Q2 is below guidance; Q3 needs a pick-up for the year to land inside 8% to 10%.
- Margin: reported at 15.6% against 17.7% a year earlier; watch for input-cost relief and the Dahej VAE plant.
- Competition: peers reported price-led growth and one reportedly trimmed dealer schemes, so pricing discipline matters.
- International: growth of 29.5% is strong; check how much is currency.
For other consumer names see our HUL Q3 results, Nestle India Q3 results and Titan Q3 results pages, or the consumption category. Another large payout with the same record date is covered in Coal India Q2 results FY27. The full list of dates is on the Q2 results calendar hub; the earlier quarter is in the Asian Paints Q3 results FY26 analysis.
What do most people miss about the Asian Paints Q2 results FY27?
Most miss that sales growth was price-led, that profit grew slower than sales because margin fell, and that Q2 profit is only 41% of the half year.
- Read the profit line and its definition before comparing with any estimate.
- Compare Q2 FY27 with Q2 FY26, never with Q1 FY27.
- Split value growth into volume and price.
- Check the PBDIT basis behind the margin.
- Buy by 3 November 2026 if you want the dividend.
Analyst’s note
- What stands out: in the Asian Paints Q2 results FY27, revenue beat while profit missed, the clearest sign that growth came from price and mix while costs rose.
- Easy to miss: Q1 FY27 delivered 59% of H1 profit, so Q2 alone is a weaker guide to the year than the headline suggests.
- What would change the view: volume back inside 8% to 10% with margin above 18% would show the squeeze was temporary.
- Caution: this is reasoning from reported numbers, not a forecast or advice. No outcome is assured.
- Reader action: check the margin basis in the release before acting on any margin figure.
Bottom line
Asian Paints Q2 results FY27: net sales Rs 9,953.9 crore (+16.9%), profit Rs 1,067.6 crore (+7.5%), dividend Rs 5.75, record date 4 November 2026. Sales beat the one estimate and profit missed it by about 4.3%. Volume of 6.4% was below guidance and the reported margin fell to 15.6%. Confirm the margin basis in the filing.
Next read: Reliance Q2 results FY27: date, base and what to read
Part of the Earnings series. The earlier quarter is covered on the Asian Paints Q3 results page.
PositionalCalls WhatsApp channel
Dividend dates and results, in plain words
- Record-date reminders with the T+1 buy-by day
- Profit definitions shown on the right base
- Links to the original company documents
Frequently asked questions
What are the Asian Paints Q2 results FY27?
Asian Paints reported consolidated net sales of Rs 9,953.9 crore, up 16.9%, and net profit after minority interest of Rs 1,067.6 crore, up 7.5%, for the quarter ended 30 September 2026, with an interim dividend of Rs 5.75.
What is the Asian Paints dividend record date for 2026?
The record date is Wednesday, 4 November 2026 for the Rs 5.75 interim dividend. Under T+1 you must own the shares by the close of Tuesday, 3 November 2026. Confirm the payment date in the exchange filing.
How much interim dividend did Asian Paints declare with the Q2 results FY27?
The board declared Rs 5.75 per share on a face value of Re 1, which is 27.8% above the FY26 interim of Rs 4.50 (my calculation). 1,000 shares would receive Rs 5,750 before tax.
Did Asian Paints beat Q2 profit estimates?
No. Against one reported estimate of Rs 1,115 crore, profit of Rs 1,067.6 crore was about 4.3% lower (my calculation). Revenue was about 3.0% above the Rs 9,662 crore estimate. The estimate was one report, not a consensus.
What was Asian Paints decorative volume growth in Q2 FY27?
Domestic decorative volume grew 6.4% and value 14.5%. That is below the FY27 guidance of 8% to 10% volume growth and below the 10.9% of Q2 FY26, so price and mix added about 7.6% (my calculation).
Which Asian Paints profit figure should I compare with the Q2 base?
Use Rs 1,067.6 crore against Rs 993.6 crore, both after minority interest, for the +7.5% growth. Rs 1,018.2 crore is the Q2 FY26 profit including minority interest. Check which line any estimate used.
What was the Asian Paints margin in Q2 FY27?
One results-day report puts the margin at 15.6%, against 17.7% in Q2 FY26 on net sales. I have not seen the PBDIT line in the company release, so confirm the figure and its basis in the filing.
How did Asian Paints international business do in Q2 FY27?
International net sales rose 29.5% to Rs 1,095.6 crore, or 23.7% in constant currency, from Rs 846.0 crore a year earlier. H1 international sales were Rs 2,032.1 crore, up 28.4%.
At Rs 5.75 a share, 500 shares receive Rs 2,875 before tax. TDS of 10% may apply for residents when dividends exceed Rs 10,000 in a year from one company, so check current rules or ask a tax adviser.
Where do I check the official Asian Paints results?
Open the company’s investor relations page or the NSE or BSE announcements for ASIANPAINT. News reports differ on profit and margin definitions, so use the filing and press release as the final source.
Sources
- Asian Paints investor relations
- Asian Paints press release, Q1 FY27, 29 July 2026
- Asian Paints board outcome, 29 May 2026
- Results-day reports by Exchange4media, Zee Business, ScanX, Whalesbook and InCred Money, 29 to 30 October 2026 (secondary, not linked)
- Business Standard, 12 November 2025 (Q2 FY26 base); Zee Business preview (estimate), as reported
Editorial disclosure. PositionalCalls.com is not a SEBI-registered research analyst or investment adviser. Investments in securities markets are subject to market risks. Read all related documents carefully before investing. Returns are never guaranteed. This page is educational, is independent and was written by Shubham Chaudhary, founder of PositionalCalls. How I researched this: I compared results-day reports of the company filing with the earlier-quarter releases, recomputed every derived number and labelled single-source figures. Corrections are published in the Data note.

Shubham Chaudhary is the founder of PositionalCalls, an independent Indian stock market research website. He writes company fundamentals, quarterly results analysis, IPO analysis and sector research for NSE and BSE listed companies, with a focus on banking stocks, insurance and long-term value investing. Every article is built from primary sources such as RBI, SEBI, NSE and BSE filings and company annual reports, and states its risks plainly in simple language for retail investors.
Coverage areas Our research standards- Numbers checked against NSE, BSE and SEBI filings
- Risks and limits stated in every article
- No paid promotions or broker tie-ups
- Articles updated when new filings arrive