
Investing · Tool
This stock average calculator works out your weighted average buy price across up to five purchases, the break-even price with charges, the profit or loss at a price you enter, and how many shares you would need to buy to bring the average down, with worked examples and the risks of averaging down.
Quick answer
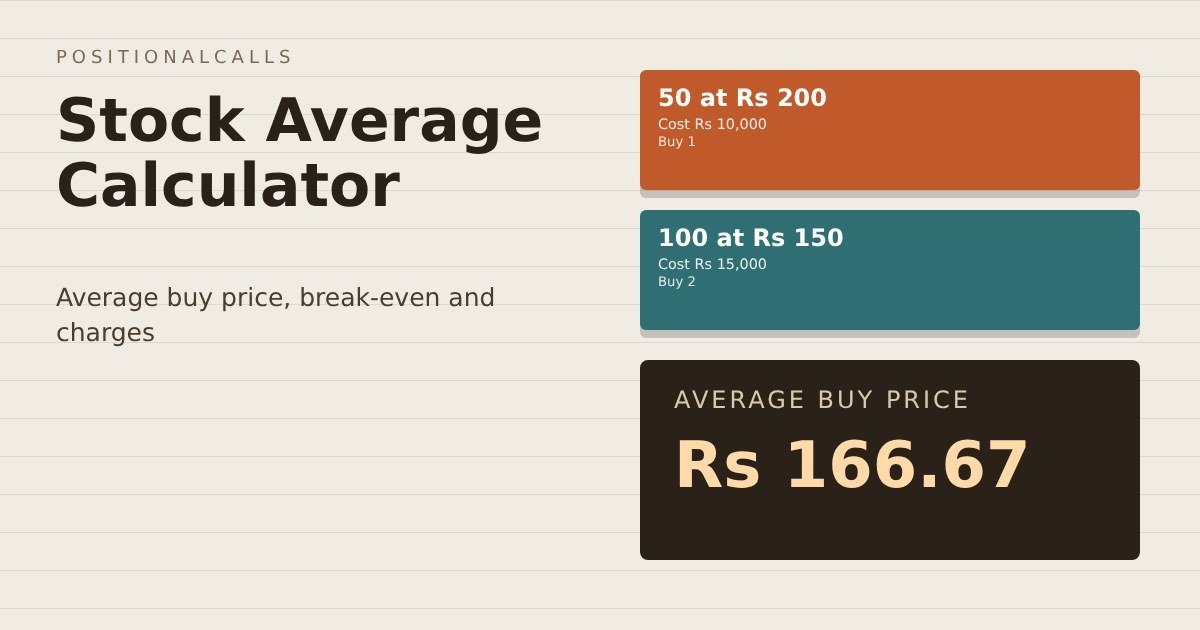
Enter each purchase in the stock average calculator below. The average is total cost divided by total shares. Buying 50 shares at Rs 200 and 100 at Rs 150 costs Rs 25,000 for 150 shares, an average of Rs 166.67, my calculation. A lower average does not guarantee a profit.
Stock average calculator: key takeaways
- Formula: average = sum of (shares × price) ÷ total shares.
- Break-even: usually the average before charges; add total charges to see the cost you must recover.
- Averaging down: lowers the average and raises the capital at risk.
- Recovery maths: a 50% fall needs a 100% gain to return to the starting price.
- Scope: arithmetic for education. It gives no buy or sell view.
In plain words: if you bought the same company at different prices, your real cost per share is somewhere in between, weighted by how many shares you bought at each price. That blended cost is your average buy price, and it is the price the stock must reach again before your position shows no loss.
Data note: as of Wednesday, 18 November 2026, 5:00 PM IST. The formula comes from Kotak Securities, Motilal Oswal, INDmoney and Jainam, and the cautions from Vested, Ventura, Equentis and DoItSwift. Figures marked as my calculation come from the formula and match the calculator on this page. The prices and quantities in the examples are round numbers chosen for the arithmetic, and no real stock is used.
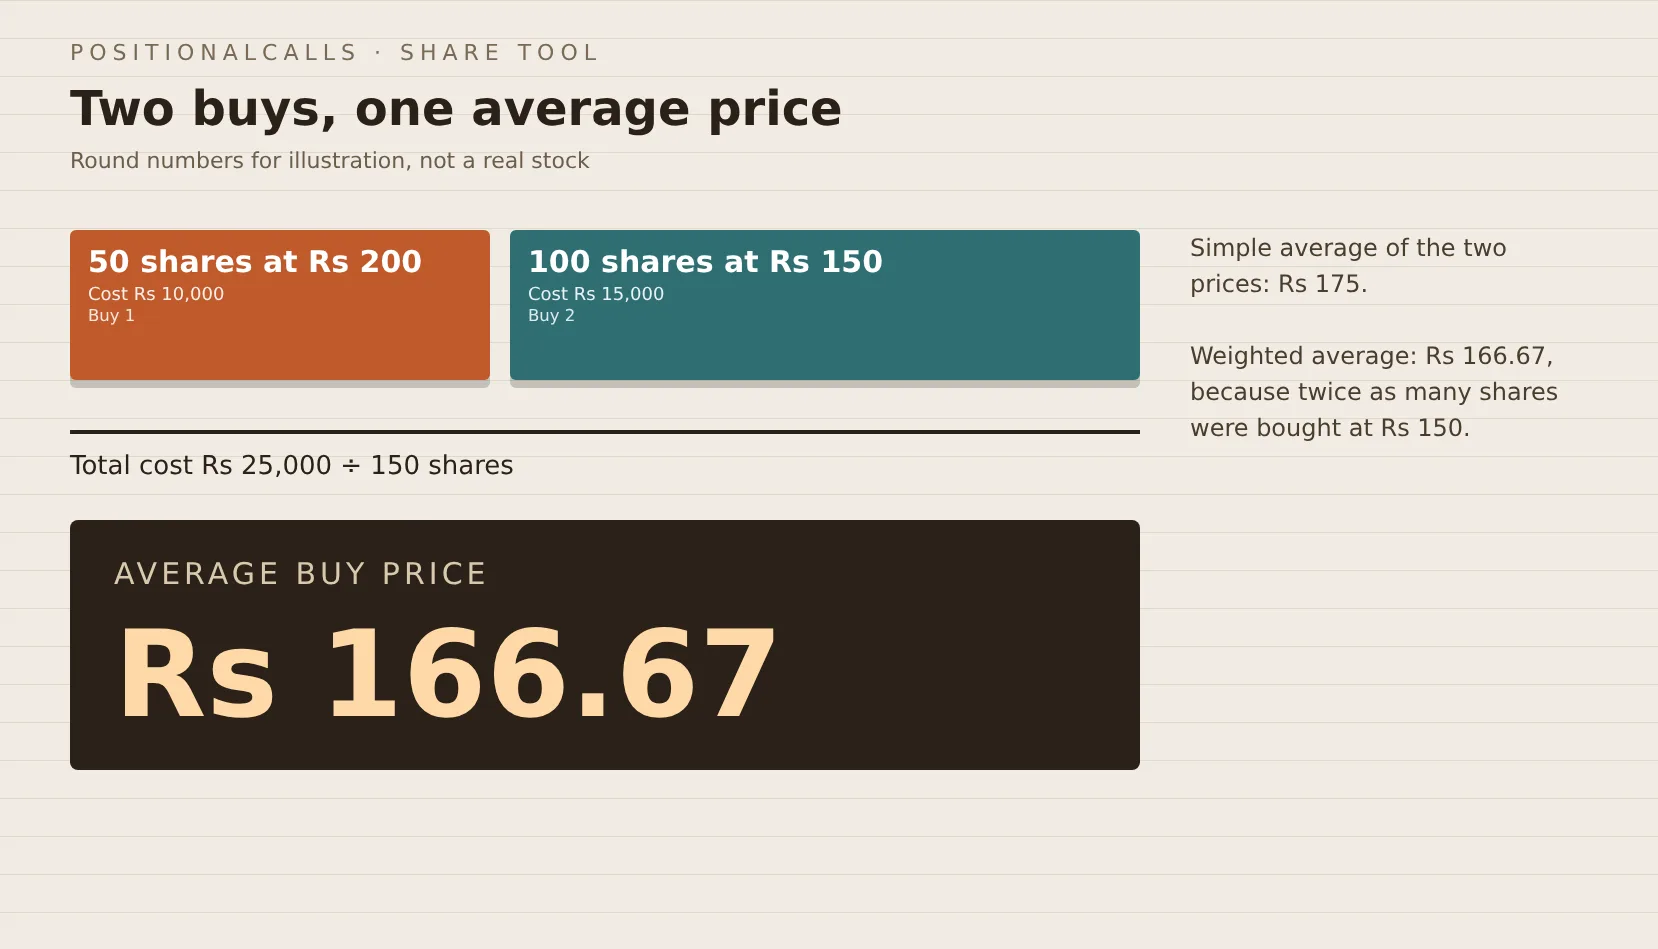
A stock average calculator example with round numbers. Source: PositionalCalls calculation using the weighted-average formula.
Use this stock average calculator to find your average buy price
Enter the shares and price for each purchase, and the stock average calculator shows your total shares, amount invested and average buy price. The defaults are 50 shares at Rs 200 and 100 at Rs 150 with a current price of Rs 160. Fill the current price and the charges boxes to see the profit or loss and the break-even. Nothing you type leaves your browser.
Used for the profit or loss line and the rise needed to break even.
Leave at 0 to match calculators that ignore charges.
What should I enter in each box?
Enter every buy of the same share, one purchase per pair of boxes, with the shares bought and the price per share. Leave unused purchases blank. The current price is optional and drives the profit line. The charges box takes the total brokerage and other costs you paid, in rupees, and stays at zero if you want a figure that ignores them.
How do I read the stock average calculator result?
The average buy price is the cost per share across all your purchases. If you entered charges, the tool also shows the break-even including them. The last line shows how far the current price must move to reach that break-even, and a plus sign means it must rise.
What formula does a stock average calculator use?
Average buy price = (sum of quantity × purchase price) ÷ sum of quantity. Motilal Oswal, Kotak Securities, INDmoney and Jainam all give this form. It is a weighted average, so a bigger purchase moves the average more than a smaller one. The table walks through the default example.
| Step | Calculation | Result |
|---|---|---|
| Cost of purchase 1 | 50 × Rs 200 | Rs 10,000 |
| Cost of purchase 2 | 100 × Rs 150 | Rs 15,000 |
| Total cost | 10,000 + 15,000 | Rs 25,000 |
| Total shares | 50 + 100 | 150 |
| Average buy price | 25,000 ÷ 150 | Rs 166.67 |
Cite this table: PositionalCalls, “Weighted average steps”; formula from Motilal Oswal, Kotak Securities, INDmoney and Jainam; the example is my calculation.
Why not just average the two prices?
Because the purchases are not the same size. A simple average of Rs 200 and Rs 150 is Rs 175, but you bought twice as many shares at Rs 150, so the weighted average is lower at Rs 166.67. The weighted formula gives more importance to the quantity bought at each price, as Equentis explains.
Does the order of purchases matter?
Not for the average. Buying 100 shares at Rs 150 first and 50 at Rs 200 later gives the same Rs 166.67, since the formula only adds up the totals. The order can matter for tax, because the lots you sell are matched in a particular way, which the tax section covers.
What do four worked examples of the stock average calculator show?
Four examples show averaging down, averaging up, a source example and a larger position. Each uses round numbers or a figure from a source, and each ties to the calculator above.
| Case | Purchases | Total cost | Average price |
|---|---|---|---|
| 1. Averaging down | 50 at Rs 200 and 100 at Rs 150 | Rs 25,000 for 150 shares | Rs 166.67 |
| 2. Averaging up | 100 at Rs 100 and 50 at Rs 150 | Rs 17,500 for 150 shares | Rs 116.67 |
| 3. Source example | 225 shares in 3 lots (Fermor) | Rs 95,500 | Rs 424.44 |
| 4. Source example | Average cut from Rs 1,600 to Rs 1,525 (Hire22) | Not stated | Break-even lower by 4.7% |
Cite this table: PositionalCalls, “Worked examples”; cases 1 and 2 are my calculation, cases 3 and 4 follow Fermor and Hire22.
What does the Fermor example show?
Fermor shows 225 shares across three lots for Rs 95,500, an average of Rs 424.44, which matches the formula: 95,500 ÷ 225. The same page notes that everyone who has bought a stock more than once is averaging, whether they planned to or not.
What does lowering the break-even by 4.7% mean?
Hire22 describes an investor who cut an average from Rs 1,600 to Rs 1,525, which lowers the price needed to break even by 4.7%, my calculation: 75 ÷ 1,600. A lower average only helps if the price later rises to it, and the extra shares add to the money at risk.
How many shares do I need to buy to reach a target average?
Shares to buy = held shares × (current average − target) ÷ (buy price − target), and the answer grows fast as the target nears the market price. The table assumes 100 shares held at an average of Rs 200 and a market price of Rs 150, and asks what each target average needs.
| Target average | Shares to buy | Extra capital | Total invested | Rise needed from Rs 150 |
|---|---|---|---|---|
| Rs 190 | 25 | Rs 3,750 | Rs 23,750 | 26.67% |
| Rs 180 | 67 | Rs 10,050 | Rs 30,050 | 20.00% |
| Rs 175 | 100 | Rs 15,000 | Rs 35,000 | 16.67% |
| Rs 170 | 150 | Rs 22,500 | Rs 42,500 | 13.33% |
| Rs 160 | 400 | Rs 60,000 | Rs 80,000 | 6.67% |
Cite this table: PositionalCalls, “Shares needed for a target average”; arithmetic by PositionalCalls; shares rounded up.
What does the table say about averaging down?
It says each step towards the market price costs more than the last. Moving the average from Rs 200 to Rs 175 needs 100 shares and Rs 15,000, while moving it from Rs 175 to Rs 160 needs another 300 shares and Rs 45,000. The break-even gets closer, but the capital in the stock rises from Rs 20,000 to Rs 80,000.
Is a lower break-even worth the extra capital?
The calculator cannot answer that, because it depends on the business and on how much you can afford to lose. Equentis advises avoiding averaging down in weak or speculative stocks. The table is there so that you can see the capital involved before you decide, not to suggest a purchase.
How much must a stock rise to recover a loss?
A fall of x% needs a gain of x ÷ (100 − x) to return to the starting price, which is always larger than x. The calculator shows this as the change from the current price to break-even. The table gives the general rule for five falls.
| Fall from the buy price | Gain needed to recover |
|---|---|
| 10% | 11.11% |
| 20% | 25.00% |
| 30% | 42.86% |
| 50% | 100.00% |
| 70% | 233.33% |
Cite this table: PositionalCalls, “Loss and recovery arithmetic”; arithmetic by PositionalCalls.
Why does the gain needed grow faster than the fall?
Because the gain is measured on a smaller base. A stock that falls from Rs 200 to Rs 100 must double to return to Rs 200, a 100% gain for a 50% fall. This is why a lower average matters: in the default example the rise needed from Rs 150 falls from 33.33% to 11.11%, although the position is larger.
What is the break-even price, and how do charges change it?
The break-even price is the price at which your position shows no loss, and Vested says it is usually the average buy price before brokerage, taxes and other charges. Calcwise instead adds total fees into the average. The table shows the effect on the default position of Rs 25,000 for 150 shares.
| Total charges paid | Break-even price | Difference from the average |
|---|---|---|
| Rs 0 | Rs 166.67 | Rs 0 |
| Rs 500 | Rs 170.00 | Rs 3.33 |
| Rs 1,000 | Rs 173.33 | Rs 6.67 |
Cite this table: PositionalCalls, “Break-even with charges”; arithmetic by PositionalCalls; the two views follow Vested and Calcwise.
Which break-even should I use?
The one that matches your question. The plain average tells you the price paid per share. The break-even with charges tells you the price at which the position covers its costs, which is the stricter test. The tool shows the second only when you enter charges, so you can compare the two on the same lots.
Where do I find my total charges?
On your contract notes and broker statements, which list brokerage, securities transaction tax, exchange and depository charges. The demat account charges in India page explains the depository costs. Add only the charges for these purchases, and add any sell-side charges separately if you want a full round-trip figure.
How do averaging down, averaging up and regular buying differ?
Averaging down lowers the average, averaging up raises it, and buying at regular intervals gives a result that depends on whether you fix the shares or the money. Choice India notes that its calculator handles both averaging up and down. The table compares them on round numbers.
PositionalCalls WhatsApp channel
Get share tools on WhatsApp
- Tool and rule changes, dated
- Plain-English calculators, no tips
- Links to updated tool pages
| Approach | Example purchases | Average price | Effect on the average |
|---|---|---|---|
| Averaging down | 100 at Rs 200 then 100 at Rs 150 | Rs 175 | Lower than the first price |
| Averaging up | 100 at Rs 100 then 50 at Rs 150 | Rs 116.67 | Higher than the first price |
| Equal shares each time | 10 shares each at Rs 60, Rs 100 and Rs 120 | Rs 93.33 | Equals the simple average of the prices |
| Equal money each time | Rs 6,000 each at Rs 60, Rs 100 and Rs 120 | Rs 85.71 | Below the simple average of the prices |
Cite this table: PositionalCalls, “Ways to build a position”; arithmetic by PositionalCalls.
Why is the equal-money average lower?
Because a fixed amount buys more shares when the price is low. At Rs 6,000 a time you get 100 shares at Rs 60, 60 at Rs 100 and 50 at Rs 120, a total of Rs 18,000 for 210 shares, which is Rs 85.71. The calculator takes shares and prices, so for an equal-money plan enter the shares each purchase actually bought.
How does the average move with each extra purchase in a stock average calculator?
Each extra purchase at the same price moves the average by less than the one before, so the average approaches the buy price slowly. The table starts with 100 shares at Rs 200 and adds 50 shares at Rs 150 up to four times.
| After purchase | Shares held | Total invested | Average price | Fall in average from Rs 200 |
|---|---|---|---|---|
| Start | 100 | Rs 20,000 | Rs 200.00 | 0.00% |
| Add 50 at Rs 150 | 150 | Rs 27,500 | Rs 183.33 | 8.33% |
| Add 50 more | 200 | Rs 35,000 | Rs 175.00 | 12.50% |
| Add 50 more | 250 | Rs 42,500 | Rs 170.00 | 15.00% |
| Add 50 more | 300 | Rs 50,000 | Rs 166.67 | 16.67% |
Cite this table: PositionalCalls, “Average after repeated purchases”; arithmetic by PositionalCalls with round numbers.
What does the pattern show?
The first extra 50 shares cut the average by Rs 16.67, and the fourth cuts it by only Rs 3.33, while each costs the same Rs 7,500. The average can never fall to the buy price of Rs 150, however many shares you add at that price. It only gets closer, which is why large purchases are needed for small improvements.
What is the maximum the average can fall to?
It can approach the lowest price you buy at but never reach it, because your earlier, higher-priced shares remain in the total. The lowest possible average from adding shares at Rs 150 is a figure just above Rs 150, and getting near it needs a very large number of shares, so the capital involved rises steeply.
How do I record purchases correctly in a stock average calculator?
Use the executed quantity and executed price from your contract notes, not the order you placed. A single order can fill in parts at different prices, and each fill is a purchase for the average. The steps below keep the inputs accurate.
- Open the contract note or the broker’s order book for each buy of the stock.
- Note the quantity bought and the average executed price for that order.
- Enter each order as one purchase, or split it if the broker shows several fills.
- Adjust older entries for any split or bonus shares before entering them.
- Check that the total shares match your holdings report.
What if I have more than five purchases?
Combine them in stages. Work out the average for the first five, then enter that average and the total shares as one purchase, and add the next ones. Because the average is weighted, the result is the same as entering every lot, which you can check with the formula. Fermor lets you enter up to 10 lots, and other tools differ, so check the limit before you compare results.
Does the calculator replace my broker’s figure?
No. Your broker’s holdings report shows its own average, which may include or exclude charges and may reflect adjustments. Use the stock average calculator to understand how the figure is built and to test what-if purchases, and use the broker report for the official record.
What are the risks of averaging down, beyond what the calculator shows?
Averaging down adds money to a position that is already losing, so the lower average comes with a larger amount at risk. The sources agree on the arithmetic and on the caution. The table sets out what each says.
| Source | What it says |
|---|---|
| Vested | Averaging down lowers your average cost, but profit depends on the price moving above your average buy price |
| Ventura | Averaging down can be rational for fundamentally sound stocks and is dangerous for deteriorating businesses |
| Equentis | Avoid averaging down in weak or speculative stocks, as it can increase risk exposure |
| DoItSwift | It increases total capital at risk if the thesis was wrong; “catching a falling knife” is a real behavioural risk |
| Incorpx | Averaging down on fundamentally weak stocks can amplify losses |
Cite this table: PositionalCalls, “Averaging down: what sources say”; sources as named; no endorsement of any approach.
What questions does the arithmetic not answer?
- Whether the business has changed since you first bought.
- How much of your total savings is already in this one stock.
- Whether you would buy it at the lower price if you held none.
- What you will do if the price falls further.
- Whether the money is needed within a few years.
Does a position-size limit help?
DoItSwift suggests position sizing and a clear invalidation level, meaning a point at which you accept that the original reasoning was wrong. That is a general risk idea, not advice about any stock. The tool helps by showing the total invested, so you can see how large the position has become after each purchase.
How do taxes and lot matching affect the average buy price?
The average buy price is a planning figure; tax is worked out lot by lot. Ventura says the first-in first-out rule decides which lots are treated as sold for tax in India, and I did not verify that against the Income-tax rules, so check it with your broker’s profit and loss statement. The calculator does not match lots.
What are the tax rates on gains from shares?
For listed equity shares in FY 2026-27, gains on shares held 12 months or less are taxed at 20%, and gains above Rs 1.25 lakh in a year on shares held longer are taxed at 12.5%, plus 4% cess, per the TaxGuru and Sahi guides cited on this site. The capital gains tax calculator estimates the tax, and capital gains tax on shares explains the rules.
Why can a lower average and a higher tax bill coexist?
Because tax depends on the lots sold and their holding periods, not on the blended average. A recent purchase at a low price can be a short-term lot even if the older lots are long-term. Use the average to understand your overall cost, and use your broker’s lot-wise report for the tax figure.
What does the calculator leave out?
The calculator works on prices and quantities only, so it leaves out everything that explains why the price moved. The table lists what is missing.
| Left out | Why it matters |
|---|---|
| Reason for the price move | A fall in a sound business and a fall in a weakening one need different thinking |
| Taxes | Lot-wise rules decide the tax, not the blended average |
| Sell-side charges | Charges on the sale reduce the final result |
| Corporate actions | Splits, bonus shares and demergers change quantities and prices |
| Dividends | Dividends received lower the effective cost and are taxed separately |
| Other holdings | The position is one part of a portfolio, which the calculator does not see |
Cite this table: PositionalCalls, “What the tool leaves out”; points from Vested, Ventura and DoItSwift as named.
How do splits and bonus shares affect the inputs?
They change the share count and the price per share without changing the total cost. After a split, enter the adjusted quantities and prices so that the total invested stays the same, or the tool will show a distorted average. Your broker’s holdings report shows the adjusted figures, and our bonus shares vs stock split calculator shows the adjusted quantity, price and average cost for a bonus or a split.
Where do sources differ on the average buy price?
The formula is the same everywhere, and the sources differ on what to include and on how current their tax notes are. The table lists three differences and how this page treats them.
| Item | View A | View B | What the page does |
|---|---|---|---|
| Charges in the average | Usually before brokerage and taxes (Vested) | Total fees added into the average (Calcwise) | Shows both, with a charges box |
| Long-term tax rate on shares | 10% above Rs 1 lakh (Hire22 page) | 12.5% above Rs 1.25 lakh (TaxGuru and Sahi, FY 2026-27) | Uses 12.5% above Rs 1.25 lakh |
| Which lots count as sold | First-in first-out (Ventura) | Not confirmed by me against the rules | Flags it as unverified |
Cite this table: PositionalCalls, “Stock average source conflicts”; sources as named; no Income-tax Act text opened.
What should I check before relying on any average?
- That every purchase of the same share is entered once.
- That quantities and prices are adjusted for splits and bonus shares.
- Whether charges are included or left out.
- That the tax rate used matches the current year.
- That the average comes from your own contract notes, not memory.
What is this page not for?
It does not tell you whether to buy more of any stock, average down or sell. PositionalCalls is not a SEBI-registered research analyst or investment adviser, and I am not a chartered accountant. The tool applies arithmetic to numbers you supply, and investments are subject to market risks.
PositionalCalls WhatsApp channel
Share tools in one channel
- Rule changes, dated
- Tools without tips
- Links to new guides
Stock average calculator: frequently asked questions
How does a stock average calculator work?
A stock average calculator multiplies the shares in each purchase by its price, adds the results, and divides by the total shares, a weighted average, per Kotak Securities and Motilal Oswal. Buying 50 shares at Rs 200 and 100 at Rs 150 costs Rs 25,000 for 150 shares, an average of Rs 166.67, my calculation.
What is the formula for the average buy price?
Average buy price = total cost of all purchases ÷ total shares bought, per INDmoney and Jainam. Total cost is the sum of quantity times price for each lot. The weighted formula gives more importance to bigger purchases, so a simple average of two prices can differ from what the stock average calculator shows.
Does averaging down guarantee a profit?
No. Vested says averaging down lowers your average cost but profit depends on the price moving above your average buy price. A stock average calculator shows the new break-even, not whether the price will reach it. Ventura calls averaging down dangerous for deteriorating businesses, so the arithmetic alone is not a reason to buy more.
What is the break-even price, and does it include charges?
The break-even price is the price at which your position shows no loss. Vested says it is usually the average buy price before brokerage and taxes, while Calcwise adds total fees into the average. This stock average calculator has a charges box, so you can see both numbers and compare them.
How many shares must I buy to reach a target average?
Shares to buy = held shares × (current average − target) ÷ (buy price − target). Holding 100 shares at Rs 200 and buying at Rs 150, a target average of Rs 175 needs 100 more shares, my calculation. Doubling the position cuts the average by only Rs 25, so use the stock average calculator to see the capital needed.
What is the difference between averaging up and averaging down?
Averaging down means buying more as the price falls, which lowers the average; averaging up means buying more as it rises, which raises it, as Choice India’s calculator notes. For example, 100 shares at Rs 100 plus 50 at Rs 150 gives an average of Rs 116.67, my calculation. The stock average calculator handles both.
Why do averaging down risks matter?
Averaging down adds capital to a falling position. Equentis advises avoiding it in weak or speculative stocks, and DoItSwift says it increases total capital at risk if the thesis was wrong. The stock average calculator shows a lower break-even, but it also shows a larger amount invested, and both are part of the picture.
Does the calculator include tax?
No. The stock average calculator works out cost and break-even only. For listed shares in FY 2026-27, gains held 12 months or less are taxed at 20% and gains above Rs 1.25 lakh a year on longer holdings at 12.5%, plus 4% cess, per the TaxGuru and Sahi guides cited on this site.
Why do two stock average calculators give different results?
They can differ in whether fees are added, how many purchases they allow, and whether they round the average. Calcwise includes fees, Vested leaves them out, and Fermor handles up to 10 lots. Enter the same lots and the same charge setting before you compare one stock average calculator with another.
Is this stock average calculator advice to buy more shares?
No. PositionalCalls is not a SEBI-registered research analyst or investment adviser, and I am not a chartered accountant. The calculator applies arithmetic to the numbers you enter. It gives no stock, subscribe, avoid, buy, sell or target view, and it does not replace your own goals and risk limits.
Sources for the stock average calculator
- Kotak Securities: stock average calculator, broker.
- Motilal Oswal: average buy price, broker.
- INDmoney: stock average calculator, broker.
- Jainam: stock average calculator, broker.
- Choice India: stock average calculator, broker.
- Equentis: stock average calculator, broker.
- Fermor: stock average calculator, tool.
- Hire22: stock average calculator, tool.
- Vested: stock average calculator, broker.
- Ventura: stock average calculator, broker.
- Ventura: average cost calculator, broker.
- Calcwise: stock average calculator, tool.
- DoItSwift: stock average calculator, tool.
- Incorpx: stock average calculator, tool.
- TaxGuru: equity STCG and, tax.
- Sahi: LTCG tax, Budget, broker.
- Not opened: contract notes, the Income-tax Act and exchange circulars; the formula and statements are from the sources above.
PositionalCalls.com is an independent research site founded by Shubham Chaudhary. PositionalCalls.com is not a SEBI-registered research analyst or investment adviser. Investments in securities markets are subject to market risks. Read all related documents carefully before investing. Returns are never guaranteed. This page is educational and publishes no subscribe, avoid, buy, sell, rating or target calls. Sources: calculator, broker and tax pages as named; no contract note or Income-tax Act text opened; no fund, buy, sell or avoid view given. I am not a chartered accountant.

Shubham Chaudhary is the founder of PositionalCalls, an independent Indian stock market research website. He writes company fundamentals, quarterly results analysis, IPO analysis and sector research for NSE and BSE listed companies, with a focus on banking stocks, insurance and long-term value investing. Every article is built from primary sources such as RBI, SEBI, NSE and BSE filings and company annual reports, and states its risks plainly in simple language for retail investors.
Coverage areas Our research standards- Numbers checked against NSE, BSE and SEBI filings
- Risks and limits stated in every article
- No paid promotions or broker tie-ups
- Articles updated when new filings arrive