
Dividends · Tool
This dividend yield calculator works out the yield on the current price and on your buy price, the dividend payout ratio, the annual and monthly dividend income, and the tax and yield after tax at your slab, with worked examples, the dividend trap and the capital needed for a target income.
Quick answer
Enter the annual dividend per share and the current price in the dividend yield calculator below. Yield is dividend ÷ price × 100. A Rs 20 dividend on a Rs 400 share is a yield of 5%, which Kotak Securities also shows. A yield moves with the price and is not a promise of future dividends.
Dividend yield calculator: key takeaways
- Formula: yield = annual dividend per share ÷ current price × 100.
- Yield on cost: uses your buy price, so it can be higher than the current-price yield.
- Payout ratio: dividend ÷ earnings per share, a check on sustainability.
- Tax: slab rate plus 4% cess; 10% TDS may apply above Rs 10,000 a year from one company.
- Scope: arithmetic for education. It gives no stock or buy view.
In plain words: a dividend is cash a company pays you for holding its share. The yield says how much that cash is, as a percentage of what one share costs on the market at the time you check. A share at Rs 400 that pays Rs 20 a year yields 5%, and if the price falls to Rs 250 with the same Rs 20, the yield rises to 8% although you receive no more.
Data note: as of Wednesday, 18 November 2026, 6:00 PM IST. The formulas come from Kotak Securities, IIFL, 5paisa, Share India, Calculator Junction and Equitiesindia, and the tax statements from Bajaj Finserv, ZiroMarket, ClearTax and the Oil India TDS FAQ. Figures marked as my calculation come from the formulas and match the calculator on this page. The dividends and prices in the examples are round numbers, and no real company is used.
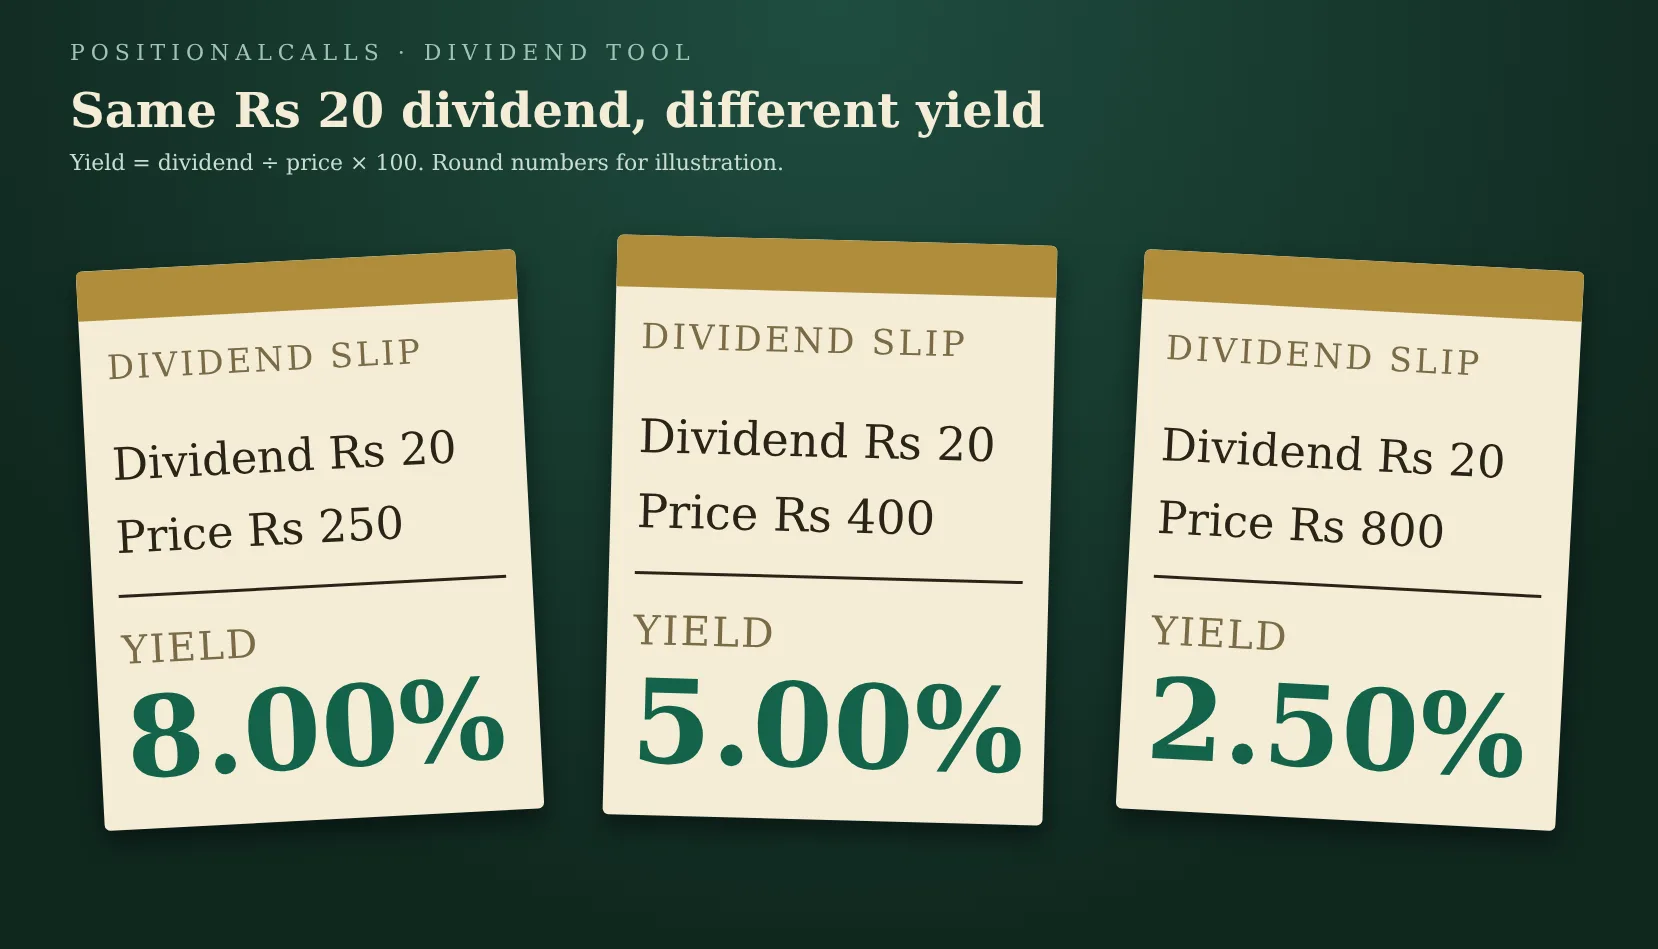
A dividend yield calculator example: the same Rs 20 dividend at different prices. Source: PositionalCalls calculation using the standard formula.
Use this dividend yield calculator to work out yield and dividend income
Enter the annual dividend per share, the current price and the shares you hold, and the dividend yield calculator shows the yield, the annual income and the income after tax. The defaults are a Rs 20 dividend, a Rs 400 price, 500 shares, a Rs 320 buy price, Rs 50 of earnings per share and a 30% slab. Nothing you type leaves your browser.
Used for yield on cost.
Used for the payout ratio.
Your own slab rate, entered by you. Dividends are taxed at the slab rate, plus 4% cess.
What should I enter in each box?
The dividend is the total per share for a year. The price is the current market price, not what you paid, as IIFL points out. Shares held turns the per-share dividend into income. The buy price is optional and gives yield on cost. Earnings per share is optional and gives the payout ratio. The slab rate is the rate you pay on your own income.
How do I read the dividend yield calculator result?
The first line is the yield on the current price. Then comes the income before tax, then the yield on your buy price and the payout ratio if you entered them. The last lines show the estimated tax with 4% cess, the income after tax and the yield after tax. A note appears when the dividend from one company is above Rs 10,000 a year.
What formula does a dividend yield calculator use?
Dividend yield = (annual dividend per share ÷ current market price per share) × 100. Kotak Securities, IIFL, 5paisa, Share India and Capmint all give this form. The table shows the formulas for the other lines in the calculator.
| Measure | Formula | Default example |
|---|---|---|
| Dividend yield | Dividend per share ÷ current price × 100 | 20 ÷ 400 × 100 = 5.00% |
| Annual dividend income | Dividend per share × shares held | 20 × 500 = Rs 10,000 |
| Yield on cost | Dividend per share ÷ buy price × 100 | 20 ÷ 320 × 100 = 6.25% |
| Payout ratio | Dividend per share ÷ earnings per share × 100 | 20 ÷ 50 × 100 = 40% |
| Tax on dividends | Income × slab rate × 1.04 | 10,000 × 30% × 1.04 = Rs 3,120 |
| Yield after tax | Yield × (1 − slab rate × 1.04) | 5% × (1 − 0.312) = 3.44% |
Cite this table: PositionalCalls, “Dividend formulas and defaults”; formulas from Kotak Securities, IIFL, 5paisa and Calculator Junction; the tax lines are my calculation.
Why does the yield change every day?
Because the price is in the denominator. 5paisa notes that even if the actual dividend stays the same, the yield shifts every day as the price goes up and down. A figure on a stock page is therefore a snapshot, and the calculator gives the yield for the price and dividend you type.
What do five worked examples of the dividend yield calculator show?
Five examples from broker pages and one from the default inputs show the same formula at different scales. Each was recomputed with the calculator and matches the figure the source gives.
| Dividend per share | Price | Yield | Source or note |
|---|---|---|---|
| Rs 20 | Rs 400 | 5.00% | Kotak Securities shows 5% |
| Rs 20 | Rs 500 | 4.00% | 5paisa shows 4% |
| Rs 6 | Rs 120 | 5.00% | Bajaj Broking shows 5% |
| Rs 25 | Rs 500 | 5.00% | StockCalc shows 5.00% |
| Rs 25 | Rs 400 buy price | 6.25% | StockCalc shows 6.25% on cost |
Cite this table: PositionalCalls, “Dividend yield worked examples”; cases from Kotak Securities, 5paisa, Bajaj Broking and StockCalc; arithmetic by PositionalCalls.
Why does the same dividend give two yields?
Because yield uses a price, and you can use two. The StockCalc case pays Rs 25: that is 5% on a Rs 500 market price and 6.25% on a Rs 400 buy price. The first is the yield a new buyer at that price gets, and the second is what the original investor is earning on the money put in.
Are these figures forecasts?
No. They apply a formula to a dividend and a price. A company can cut, skip or raise a dividend, and the price changes daily, so the result describes a moment and not a future income.
How does the price change the yield?
A falling price raises the yield and a rising price lowers it, even when the dividend does not change. The table holds a Rs 20 dividend fixed and changes the price. The yield nearly triples between Rs 800 and Rs 250, while the cash you receive stays Rs 20 a share.
| Dividend per share | Price | Yield | What changed |
|---|---|---|---|
| Rs 20 | Rs 250 | 8.00% | Only the price moved |
| Rs 20 | Rs 300 | 6.67% | Only the price moved |
| Rs 20 | Rs 400 | 5.00% | Cash received is the same Rs 20 |
| Rs 20 | Rs 500 | 4.00% | Only the price moved |
| Rs 20 | Rs 800 | 2.50% | Only the price moved |
Cite this table: PositionalCalls, “Yield at different prices”; arithmetic by PositionalCalls with a Rs 20 dividend.
What is a dividend trap?
A dividend trap is a high yield that comes from a falling price, where the dividend may not last. StockCalc raises it as a question on its page, and Ventura-style cautions about weak businesses apply. At Rs 250 the Rs 20 dividend shows 8%, but if the fall reflects weaker earnings, the dividend may be cut. The tool cannot tell, so check the payout ratio.
Does a high yield mean a better investment?
Not by itself. Yield counts only the dividend and ignores any gain or loss in the share price, so it is not the total return. A 5% yield with a price that falls 10% in the year is a loss. Treat the figure as one measure of income, to be set beside the risk and the business.
What does the payout ratio add to a dividend yield calculator?
The payout ratio shows what share of earnings is paid out, which helps judge whether a dividend can continue. It is dividend per share divided by earnings per share, per 5paisa, and it is not the same as yield, as Share India warns. The table uses Rs 50 of earnings per share.
| Dividend per share | Earnings per share | Payout ratio | Reading |
|---|---|---|---|
| Rs 10 | Rs 50 | 20% | A small share of earnings is paid out |
| Rs 20 | Rs 50 | 40% | Close to the middle |
| Rs 30 | Rs 50 | 60% | A larger share is paid out |
| Rs 45 | Rs 50 | 90% | Little is retained in the business |
| Rs 60 | Rs 50 | 120% | The dividend is more than that year’s earnings |
Cite this table: PositionalCalls, “Payout ratio at Rs 50 of earnings”; arithmetic by PositionalCalls; formula from 5paisa and Share India.
What does a payout above 100% mean?
It means the company paid out more than it earned per share that year, so the dividend came partly from reserves or borrowing. That can happen for a one-off reason, such as a special dividend, and it may not continue. The 5paisa example of a Rs 15 dividend on Rs 50 earnings shows a payout of 30%, a mid-range case.
Is a low payout ratio better?
Neither low nor high is better in itself. Capmint notes that growth-focused companies usually have lower payout ratios than mature businesses. A low payout can leave room to raise the dividend, and a high one can mean a mature business returns most of its profit. The ratio is a check, not a rating.
What is yield on cost in a dividend yield calculator, and when does it mislead?
Yield on cost divides the dividend by your original buy price, so it rises as the dividend grows while the cost stays fixed. Calculator Junction and Equitiesindia both describe it, and Equitiesindia calls it the long-term investor’s metric. The table assumes a Rs 400 purchase and a dividend that grows 10% a year, an assumption and not a forecast.
| Years after purchase | Dividend per share | Yield on a Rs 400 cost |
|---|---|---|
| 0 | Rs 20.00 | 5.00% |
| 5 | Rs 32.21 | 8.05% |
| 10 | Rs 51.87 | 12.97% |
Cite this table: PositionalCalls, “Yield on cost with a growing dividend”; arithmetic by PositionalCalls; the 10% growth is an assumption.
PositionalCalls WhatsApp channel
Get dividend tools on WhatsApp
- Tool and rule changes, dated
- Plain-English calculators, no tips
- Links to updated tool pages
Why can yield on cost mislead?
Because it ignores what the shares are worth at the current price. A 12.97% yield on cost sounds large, but if the price has risen, the yield on the current price is much lower, and the money tied up could earn that current yield elsewhere. Use the tool to see both, and use the cost figure to track income, not to judge the value of the holding.
How is dividend income taxed, and how does the dividend yield calculator show it?
Resident individuals pay tax on dividends at their slab rate plus 4% cess, and the yield after tax falls as the slab rises. Bajaj Finserv says dividend distribution tax was abolished from 1 April 2020, which moved the burden to investors. The table shows the yield after tax for a 5% yield at four slab rates.
| Slab rate | Tax with 4% cess | Yield after tax on a 5% yield |
|---|---|---|
| 0% | 0.0% | 5.00% |
| 5% | 5.2% | 4.74% |
| 20% | 20.8% | 3.96% |
| 30% | 31.2% | 3.44% |
Cite this table: PositionalCalls, “Yield after tax by slab”; arithmetic by PositionalCalls; surcharge not included.
What is TDS on dividends?
A company generally deducts 10% TDS when the dividend to a resident individual exceeds Rs 10,000 in a financial year, per Bajaj Finserv and ClearTax, and the Oil India FAQ gives the same threshold for FY 2026-27 and a 20% rate if the PAN is not furnished. TDS is not the final tax. The calculator adds a note when your income from one company is above Rs 10,000.
Where can I read the full rules?
The dividend tax in India page covers slab rates, TDS and reporting in more detail. The tax figures here are estimates for a resident individual and ignore surcharge, the choice of tax regime and any other income, so check your own return.
How do dividends and price changes combine into a total return?
Total return adds the dividend to the change in the share price, so a dividend yield can be wiped out by a fall in the price. The table assumes a Rs 400 purchase and a Rs 20 dividend and changes only the price at the end of the year. The prices are assumptions, not forecasts.
| Price at year end | Price change | Dividend received | Total return on Rs 400 |
|---|---|---|---|
| Rs 300 | −Rs 100 | Rs 20 | −20.00% |
| Rs 360 | −Rs 40 | Rs 20 | −5.00% |
| Rs 400 | No change | Rs 20 | +5.00% |
| Rs 440 | +Rs 40 | Rs 20 | +15.00% |
Cite this table: PositionalCalls, “Dividend and price in total return”; arithmetic by PositionalCalls with round numbers.
What does the table show about a 5% yield?
It shows the yield is only one part. With no price change, the 5% yield is the whole return. If the price falls 10%, the dividend of 5% is not enough to offset it and the total return is −5%. The dividend yield calculator shows income, so read it together with what the price may do, which no calculator knows.
Why do investors still value dividends?
Because a dividend is cash received regardless of the price on a given day, while a price gain is realised only when you sell. That is a reason some investors look at income, and it is also a reason for care, since the dividend can change. This page describes the arithmetic and gives no view on which approach to take.
How should I use a yield shown on a stock page?
Treat a yield on a stock page as a starting point and rebuild it with your own numbers. Pages differ in which dividend and price they use, so the figure may not match the one you calculate. The steps below make the figure comparable.
- Find the dividends declared and paid for the last full year on the company’s announcements.
- Add the interim and final dividends, and note any special dividend separately.
- Use the current market price at the time you check.
- Enter both in the calculator and compare with the page.
- Check the payout ratio against earnings per share from the latest results.
Why might my figure differ from the page?
The page may use a different price time, count only paid dividends, or include a special dividend. Fermor warns that using the wrong dividend figure or an outdated price produces a misleading result. Align the inputs first, then compare, and treat small differences as rounding.
Can I use a mutual fund distribution in the same way?
The arithmetic is similar, but a fund’s distribution comes from its net asset value and its own rules, so it is not the same as a company dividend. This page covers shares, and I have not researched fund distributions, so the figures here should not be applied to them without checking.
How much capital do I need for a target dividend income?
Capital needed = target annual income ÷ yield, so a lower yield needs far more capital. The table asks what it takes to receive Rs 1 lakh a year at four yields, before tax.
| Assumed yield | Capital for Rs 1 lakh a year | Capital for Rs 10,000 a month |
|---|---|---|
| 2% | Rs 50,00,000 | Rs 60,00,000 |
| 3% | Rs 33,33,333 | Rs 40,00,000 |
| 5% | Rs 20,00,000 | Rs 24,00,000 |
| 8% | Rs 12,50,000 | Rs 15,00,000 |
Cite this table: PositionalCalls, “Capital for a target dividend income”; arithmetic by PositionalCalls; before tax.
What does this say about chasing a higher yield?
It shows why people look at high yields, since 8% needs far less capital than 2%, and also why caution is needed. A high yield can come from a falling price or a payout that cannot last. The arithmetic does not say which yields will hold, and the tool cannot predict whether a dividend will be paid next year.
How many shares give Rs 10,000 a month?
At a Rs 20 dividend, Rs 10,000 a month is Rs 1,20,000 a year, which needs 6,000 shares, my calculation. At a Rs 400 price that is Rs 24,00,000 of capital. Change the dividend and the price in the calculator to see how those numbers move.
Which dividend should I enter in a dividend yield calculator?
Enter the total dividend for a full year, and check whether it includes one-off payments. The sources describe two practices, and the table shows the difference.
| Approach | What it counts | Source |
|---|---|---|
| Trailing (paid) | Dividends paid in the last 12 months | Fermor |
| Declared | Interim and final dividends declared for the year | Equitiesindia |
| Forward (assumed) | A dividend you expect, which is an assumption | Your own input |
Cite this table: PositionalCalls, “Which dividend to use”; practices from Fermor and Equitiesindia; no forecast given.
What about special dividends?
A special dividend is usually a one-off. Fermor’s worked example combines a regular and a special dividend, which shows why checking matters. If a one-off payment is included, the yield looks higher than a regular payout would give, so consider running the tool both with and without it.
What does the calculator leave out?
The calculator uses one dividend and one price, so it leaves out the things that decide whether the income lasts. The table lists them.
| Left out | Why it matters |
|---|---|
| Future dividends | Companies can cut, skip or raise a dividend |
| Share price change | A fall can exceed the dividend received |
| Surcharge and regime choice | Tax depends on your total income and chosen regime |
| Record date and ex-date | You must hold the share before the ex-date to receive the dividend |
| Charges and other income | Costs and other income change what you keep |
Cite this table: PositionalCalls, “What the tool leaves out”; points from Fermor, Equitiesindia and Bajaj Finserv as named.
Does the record date matter for the yield?
It matters for whether you receive a dividend, not for the yield arithmetic. A company fixes a record date, and the share trades without the dividend from the ex-date; our ex-dividend date calculator finds the last day to buy and the reference price. The yield calculator assumes you hold the share across the dividend, and the price normally adjusts around that date, which is a reason yield is only a snapshot.
Where do sources differ on dividend yield?
The formula is the same everywhere, and sources differ on which price to use, which dividend to count and which TDS threshold applies. The table lists three differences and how this page treats them.
| Item | View A | View B | What the page does |
|---|---|---|---|
| Price in the yield | Current market price (IIFL, Kotak Securities) | Buy price (Incorpx formula) | Uses the current price and shows yield on cost separately |
| Dividend counted | Paid in the last 12 months (Fermor) | Declared for the year, interim plus final (Equitiesindia) | Asks you to enter the annual total |
| TDS threshold | Rs 10,000 (Bajaj Finserv, Oil India FAQ) | Rs 5,000 up to FY 2024-25 (ClearTax) | Uses Rs 10,000 |
Cite this table: PositionalCalls, “Dividend yield source conflicts”; sources as named; no Income-tax Act text opened.
What should I check before relying on a yield?
- That the price is current and the dividend is for a full year.
- Whether a special dividend is included.
- The payout ratio and whether earnings cover the dividend.
- Why the price has moved, since a fall raises the yield.
- The tax and TDS rules for the year you receive it.
What is this page not for?
It does not tell you which dividend stock to buy or whether a dividend will continue. PositionalCalls is not a SEBI-registered research analyst or investment adviser, and I am not a chartered accountant. The tool applies arithmetic to numbers you supply, and investments are subject to market risks.
PositionalCalls WhatsApp channel
Dividend tools in one channel
- Rule changes, dated
- Tools without tips
- Links to new guides
Dividend yield calculator: frequently asked questions
How does a dividend yield calculator work?
A dividend yield calculator divides the annual dividend per share by the current market price and multiplies by 100, per Kotak Securities. With a Rs 20 dividend and a Rs 400 price, the result is 5%. Add your shares and the calculator also shows the annual income, which is Rs 10,000 for 500 shares, my calculation.
What is the dividend yield formula?
Dividend yield = (annual dividend per share ÷ current market price per share) × 100, per IIFL, 5paisa and Share India. IIFL says to use the current market price, not the price you paid. A Rs 20 dividend at Rs 500 gives 4%, which 5paisa also shows, and the dividend yield calculator on this page gives the same result.
What is yield on cost, and how is it different?
Yield on cost uses your original purchase price instead of the current price, per Calculator Junction and Equitiesindia. Buying at Rs 400 and receiving a Rs 25 dividend gives 6.25%, while the current-price yield at Rs 500 is 5%, as StockCalc shows. The dividend yield calculator shows both when you enter a buy price.
What is the dividend payout ratio?
The payout ratio is dividend per share divided by earnings per share, times 100, per 5paisa. A company earning Rs 50 a share and paying Rs 15 has a payout of 30%. Share India warns not to confuse it with yield, which uses the market price. A payout above 100% means the dividend exceeds the profit.
Is a high dividend yield a good sign?
Not by itself. Fermor says yield moves whenever the share price moves, even if the dividend is unchanged, so a falling price raises the yield. Equitiesindia says yield alone does not show whether the dividend is sustainable, and the payout ratio is more relevant. Use the dividend yield calculator as one input, not a verdict.
How is dividend income taxed in India?
Resident individuals pay tax on dividends at their slab rate plus 4% cess, per Bajaj Finserv and ZiroMarket. A company generally deducts 10% TDS when dividends from it exceed Rs 10,000 in a year, and 20% if the PAN is invalid, per the Oil India TDS FAQ. TDS is not the final tax.
Which dividend should I enter: declared or paid?
Enter the total for the year. Fermor suggests the dividends paid in the last 12 months, while Equitiesindia says to include the interim and final dividends declared for the year. Special dividends can distort a dividend yield calculator, so check whether a one-off payment is included before you rely on the yield.
How much money do I need for Rs 1 lakh of annual dividends?
Capital needed = annual income ÷ yield. At a 5% yield you need Rs 20 lakh for Rs 1 lakh a year, my calculation, and at 2% you need Rs 50 lakh. The result changes with the price and the dividend, so the dividend yield calculator figure is a snapshot, not a plan.
Does the dividend yield include share price gains?
No. Dividend yield counts only the dividend, not any rise or fall in the share price, so it is not the total return. A stock can pay a 5% yield and still lose money if the price falls by more than the dividend. The calculator shows income and yield, not the profit or loss on the shares.
Is this dividend yield calculator advice to buy a dividend stock?
No. PositionalCalls is not a SEBI-registered research analyst or investment adviser, and I am not a chartered accountant. The calculator applies arithmetic to the numbers you enter. It gives no stock, subscribe, avoid, buy, sell or target view, and a dividend is never guaranteed.
Sources for the dividend yield calculator
- Kotak Securities: dividend yield calculator, broker.
- IIFL: dividend yield calculator, broker.
- 5paisa: dividend yield calculator, broker.
- Share India: dividend yield calculator, broker.
- Bajaj Broking: dividend yield calculator, broker.
- Calculator Junction: dividend yield, tool.
- Equitiesindia: dividend yield calculator, tool.
- Fermor: dividend yield calculator, tool.
- StockCalc: dividend yield calculator, tool.
- Capmint: dividend yield glossary, industry.
- Incorpx: stock dividend calculator, tool.
- Bajaj Finserv: tax on dividend, broker.
- ClearTax: how dividends are, tax.
- Oil India: TDS FAQs, company.
- ZiroMarket: how dividends are, broker.
- Not opened: company dividend notices, the Income-tax Act and exchange circulars; the formula and statements are from the sources above.
PositionalCalls.com is an independent research site founded by Shubham Chaudhary. PositionalCalls.com is not a SEBI-registered research analyst or investment adviser. Investments in securities markets are subject to market risks. Read all related documents carefully before investing. Returns are never guaranteed. This page is educational and publishes no subscribe, avoid, buy, sell, rating or target calls. Sources: calculator, broker and tax pages as named; no dividend notice or Income-tax Act text opened; no fund, buy, sell or avoid view given. I am not a chartered accountant.

Shubham Chaudhary is the founder of PositionalCalls, an independent Indian stock market research website. He writes company fundamentals, quarterly results analysis, IPO analysis and sector research for NSE and BSE listed companies, with a focus on banking stocks, insurance and long-term value investing. Every article is built from primary sources such as RBI, SEBI, NSE and BSE filings and company annual reports, and states its risks plainly in simple language for retail investors.
Coverage areas Our research standards- Numbers checked against NSE, BSE and SEBI filings
- Risks and limits stated in every article
- No paid promotions or broker tie-ups
- Articles updated when new filings arrive