
Learning · Retirement and tool
A retirement calculator turns your current monthly spending into a corpus target, but the answer swings on inflation, the return after you stop working and how long you live. This retirement calculator shows the corpus, the SIP to reach it and the points where the usual sources disagree, using Rs 50,000 a month as the worked example.
Quick answer
A retirement calculator grows your monthly expenses to the year you retire and finds the corpus that can fund them until a chosen age. For Rs 50,000 a month, retiring at 60 and lasting to 85, at 6% inflation and 8% return, you need about Rs 6.50 crore, or a flat SIP of Rs 28,512 a month at 10%.
Retirement calculator: key takeaways
- Method: grow expenses with inflation to the retirement year, then find the corpus that pays rising expenses until your end age.
- Example: Rs 50,000 a month becomes Rs 2,87,175 at 60 and needs Rs 6.50 crore at 8% to last 25 years.
- Inflation: a 5% to 7% range moves the answer from Rs 4.42 crore to Rs 9.56 crore.
- Time: starting at 30 needs a flat SIP of Rs 28,512; starting at 40 needs Rs 84,874.
- Limits: one steady return, no tax, no separate healthcare rate.
In plain words: prices rise every year, so the Rs 50,000 you spend each month at current prices will need a much larger figure by the time you retire. A retirement calculator inflates that spending, adds up what you will need each month until a chosen age, and says how large the pile must be on the day you stop working. It then checks whether your savings and SIP can build that pile.
Data note: as of Wednesday, 18 November 2026, 11:25 PM IST. CPI figures come from the MoSPI release of 12 November 2026. Method points come from Dezerv, Fermor and Finnovate. Longevity points come from Dezerv, Wright Research and Freefincal. Rule-of-thumb multiples come from HDFC Life, iVentures and Outlook Money. EPF, PPF and SCSS rates come from Business Today and Angel One. Figures marked my calculation use the model on this page. No pension scheme document was opened.
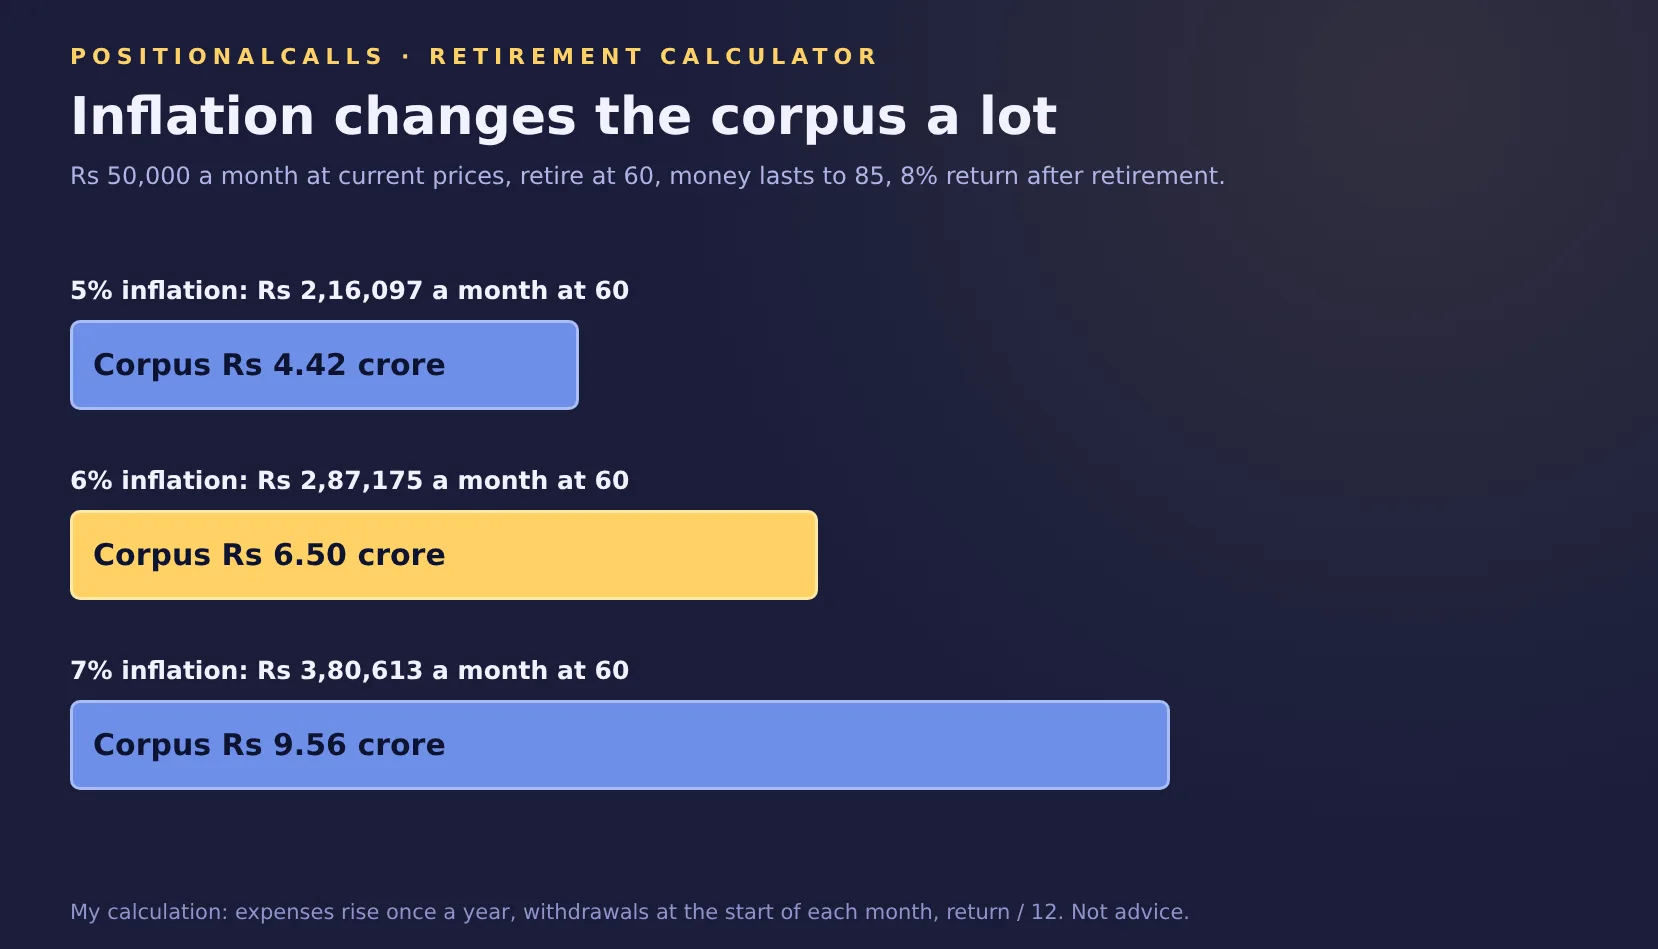 Corpus needed at 60 for Rs 50,000 a month, by inflation rate. Source: PositionalCalls calculation at an 8% return after retirement.
Use this retirement calculator to find your corpus and the SIP to reach it
Enter your age, retirement age, end age, monthly expenses, inflation, returns, existing savings and monthly investment, and the retirement calculator shows the corpus you need, what you are on course to build and the extra monthly investment that closes the gap. The defaults are age 30, retirement at 60, money to last until 85, Rs 50,000 a month, 6% inflation, 10% before and 8% after retirement, no savings and a Rs 15,000 SIP.
Use 100 if spending stays the same. Use 70 if you expect lower spending, or above 100 if it rises.
Use 0 for a flat amount. Use 5 to 10 if you expect to raise it with income.
Press Calculate retirement corpus to see the result.
How does this retirement calculator work?
The retirement calculator grows your monthly expenses once a year with inflation to the year you retire. It then finds the corpus that can pay expenses that keep rising, taken at the start of each month, until your end age, with the corpus earning the after-retirement return divided by 12. This is the same timing the SWP calculator uses. The projection side grows your savings and a monthly investment, with an optional yearly step-up, at the before-retirement return.
What does this retirement calculator not include?
Finnovate says its tool does not model tax on withdrawals, pensions or annuities, and the same applies here. This retirement calculator also leaves out your own pension or rental income, a separate healthcare inflation rate, a legacy for heirs, and the value of your home. It assumes one steady return for each phase, which no market delivers. Use it to compare plans, not to predict a rupee amount.
What is the retirement calculator formula and a worked example?
A retirement calculator takes three steps: expenses at retirement = current expenses × (1 + inflation)^years, then the corpus is the present value of the rising monthly expenses over the retirement years, and the SIP is the amount that grows to that corpus. Dezerv describes the first two steps and Fermor writes the corpus as a growing annuity with the monthly inflation rate g and the monthly return r.
| Step | Calculation | Result |
|---|---|---|
| Expenses at retirement | Rs 50,000 × 1.06^30 | Rs 2,87,175 a month |
| Years the money must last | 85 minus 60 | 25 years |
| Return after retirement | 8% a year, divided by 12 each month | 0.667% a month |
| Corpus at 60 | Present value of expenses rising 6% a year, start-of-month | Rs 6,49,87,807 |
| Multiple of first-year yearly expenses | Rs 6,49,87,807 ÷ Rs 34,46,095 | 18.9 times |
| Flat SIP at 10% for 30 years | Corpus ÷ future value of Re 1 a month | Rs 28,512 a month |
Cite this table: PositionalCalls, “Retirement calculator”; my calculation, expenses rising once a year, withdrawals and SIP at the start of each month, yearly rate divided by 12.
I checked the corpus by running it through the SWP model: starting with Rs 6,49,87,807, withdrawing Rs 2,87,175 a month with a 6% yearly step-up and an 8% return, the balance reaches zero at the end of 25 years. The corpus is 18.9 times the first-year yearly spending of Rs 34,46,095, which is why it sits well below a 25-times shortcut. The multiple depends on the gap between the 8% return and 6% inflation, a real return of about 2%.
Why do different retirement calculators give different answers?
Fermor’s example for the same Rs 50,000, 30 years, 6% inflation, 8% return and 25 years shows Rs 6.75 crore. Its formula grows expenses by the monthly inflation rate during retirement and takes withdrawals at the end of each month, while this retirement calculator steps expenses once a year and takes them at the start, so the two differ by about 4%. Tapetide gives Rs 7.64 crore for retirement at 60 on Rs 50,000, and Dezerv, which assumes a real return of about zero, gets Rs 45.7 crore at retirement for Rs 4 lakh a month with 8% inflation, 15 years to retire and 30 years of retirement. Check inflation, return, timing and the end age before you compare any two results.
What inflation should a retirement calculator assume?
Most sources use 6%, MoSPI reported headline inflation of 6.09% for October 2026, and the corpus is very sensitive: Rs 50,000 a month needs Rs 4.42 crore at 5%, Rs 6.50 crore at 6% and Rs 9.56 crore at 7%. Holistic Investment notes that at 6% expenses double about every 12 years.
| Inflation | Monthly spending at 60 | Corpus for 25 years at 8% | Change from the 6% case |
|---|---|---|---|
| 5% | Rs 2,16,097 | Rs 4,42,08,372 | -32% |
| 6% | Rs 2,87,175 | Rs 6,49,87,807 | +0% |
| 7% | Rs 3,80,613 | Rs 9,56,22,290 | +47% |
Cite this table: PositionalCalls, “Retirement calculator”; my calculation, retirement at 60 and money to last until 85, 8% return after retirement.
The MoSPI release of 12 November 2026 gives headline CPI inflation of 6.09% for October, provisional, against 5.54% for September, on the 2024 base. Its August release gives 4.82%, and Dezerv cites 4.45% for July. The 8.94% that appears on many pages is food inflation, not the headline rate, as the release itself states. One month does not set a 30-year assumption, and ThePrint notes that month-on-month price rises have eased since June, so a planner should test a range, as the table does.
Should a retirement calculator use a separate rate for healthcare?
Business Today and Dezerv put medical inflation at 12% to 14% a year, and Dezerv cites the Aon report for 11% to 14%. Dezerv shows Rs 30,000 a month of healthcare growing to about Rs 1.9 lakh in 15 years at 13%, against about Rs 95,000 at 8%. This retirement calculator uses one rate, so if healthcare is a large share of your spending, raise the blended rate or keep a separate reserve. Kuvera suggests a medical buffer of 25% of the corpus, which is its view and not a rule.
What return should you assume after retirement?
The after-retirement return matters almost as much as inflation: on Rs 50,000 a month the corpus is Rs 8.23 crore at 6%, Rs 6.50 crore at 8% and Rs 5.24 crore at 10%. Finnovate says post-retirement returns commonly range from about 6% to 9% before tax, and Fermor uses 8%.
| Return after retirement | Corpus at 60 | Corpus as multiple of first-year yearly expenses |
|---|---|---|
| 6% | Rs 8,22,62,893 | 23.9 times |
| 7% | Rs 7,29,26,275 | 21.2 times |
| 8% | Rs 6,49,87,807 | 18.9 times |
| 9% | Rs 5,82,12,930 | 16.9 times |
| 10% | Rs 5,24,09,026 | 15.2 times |
Cite this table: PositionalCalls, “Retirement calculator”; my calculation, Rs 50,000 a month at current prices, 6% inflation, retirement at 60 to 85.
A higher return lowers the corpus only if you earn it, and a retiree usually holds safer assets than a saver. Marcellus uses the 10-year government bond yield of 6.8% for August 2026 as a risk-free return, which is below the 7% lifestyle inflation in its own example. Finnovate also separates a post-tax return from a pre-tax one. If your return is before tax, lower it, or the retirement calculator will understate the corpus.
Does the retirement age change the corpus?
Yes, in two opposite ways. A later retirement means fewer years to fund but higher spending at the start, because inflation has run longer. With money lasting to 85, retiring at 55 needs Rs 5.55 crore, at 60 Rs 6.50 crore and at 65 Rs 7.31 crore. A later retirement raises the corpus here because spending has grown for ten more years, even though the money has to last 20 years and not 30, and it also gives the SIP more years to grow.
How long must the money last?
Plan beyond the average: Rs 50,000 a month needs Rs 6.50 crore to last until 85, Rs 7.43 crore until 90 and Rs 8.27 crore until 95, and official tables show a 60-year-old can expect around 18 to 20 more years. Dezerv, citing MoSPI’s SRS tables for 2020-24, gives 17.5 further years at 60 for men and 19.8 for women, and 18.9 and 20.8 in urban India.
| Money must last until | Years after 60 | Corpus at 60 | Extra over the age-85 case |
|---|---|---|---|
| 85 | 25 | Rs 6,49,87,807 | +0% |
| 90 | 30 | Rs 7,42,99,649 | +14% |
| 95 | 35 | Rs 8,26,63,835 | +27% |
Cite this table: PositionalCalls, “Retirement calculator”; my calculation, Rs 50,000 a month at current prices, 6% inflation, 8% return after retirement.
Wright Research quotes the SRS 2019-23 tables at 18.4 years at age 60, 17.3 for men and 19.6 for women, so the published figure differs by edition. These are population averages, as Wright Research says, not expiry dates. Freefincal suggests assuming a life expectancy of 90, and Business Today reports a survey in which 58.5% of respondents expect their savings to run out before 80. For a couple, plan for the younger or longer-lived partner. The retirement calculator lets you change the end age, so test 85, 90 and 95.
PositionalCalls WhatsApp channel
Get mutual fund and retirement explainers on WhatsApp
- Tax and rate changes, dated
- Calculators explained without tips
- Links to updated guides
How much SIP do you need to build the retirement corpus?
For the Rs 6.50 crore example, a flat SIP of Rs 28,512 a month at a 10% return reaches it in 30 years, and a SIP that rises 10% a year needs to start at only Rs 10,123. Fermor gets Rs 19,120 a month at 12% for its Rs 6.75 crore case, which its formula supports when contributions are made at the start of each month.
| Plan | Return before retirement | First monthly SIP |
|---|---|---|
| Flat SIP, start at 30 | 10% | Rs 28,512 |
| Flat SIP, start at 30 | 12% | Rs 18,411 |
| SIP rising 10% a year, start at 30 | 10% | Rs 10,123 |
| SIP rising 10% a year, start at 30 | 12% | Rs 7,356 |
| Flat SIP, start at 35 | 10% | Rs 48,575 |
| Flat SIP, start at 40 | 10% | Rs 84,874 |
Cite this table: PositionalCalls, “Retirement calculator”; my calculation for the Rs 6,49,87,807 corpus, SIP at the start of each month, yearly return divided by 12.
Delay is expensive. Waiting five years raises the flat SIP from Rs 28,512 to Rs 48,575, and ten years raises it to Rs 84,874, because each rupee has fewer years to grow. The default inputs show the same effect: a flat Rs 15,000 SIP grows to Rs 3,41,89,880 at 10% over 30 years, which is 52.6% of the corpus, leaving a shortfall of Rs 3,07,97,927 and an extra flat SIP of Rs 13,512 a month. Raising the same SIP by 10% a year grows it to Rs 9,62,95,868, which covers the target.
How does the SIP side of the retirement calculator relate to the SIP calculator?
It uses the same method as the SIP calculator: each instalment goes in at the start of the month and the yearly return is divided by 12. Finnovate’s Priya example uses 11% before retirement and Fermor uses 12%, but these are assumptions, not guarantees, so run the plan at a lower return too. The CAGR calculator helps you check what return your past investments actually earned.
Is the 25x or 30x rule better than a retirement calculator?
The 25x and 30x rules are shortcuts, and for the Rs 50,000 example they give Rs 8.62 crore and Rs 10.34 crore against Rs 6.50 crore from the retirement calculator, a gap that on my reading comes from rules built for longer lives or lower real returns. HDFC Life describes a corpus of 25 or 30 times annual expenses, and Tradejini says many Indian planners prefer 30 times.
| Method | Multiple of first-year yearly expenses | Corpus for Rs 50,000 a month at 60 | Source of the rule |
|---|---|---|---|
| 25 times (4% withdrawal) | 25 | Rs 8.62 crore | HDFC Life; Outlook Money |
| 28 to 33 times | 28 to 33 | Rs 9.65 crore to Rs 11.37 crore | iVentures |
| 30 times (3.3% withdrawal) | 30 | Rs 10.34 crore | HDFC Life; Tradejini |
| 33 to 40 times (2.5% to 3%) | 33 to 40 | Rs 11.37 crore to Rs 13.78 crore | Outlook Money |
| This retirement calculator, 6% and 8%, 25 years | 18.9 | Rs 6.50 crore | My calculation |
Cite this table: PositionalCalls, “Retirement calculator”; multiples from the named sources, applied by me to Rs 2,87,175 a month, or Rs 34,46,095 a year, at retirement.
The gap is not an error. A multiple like 25 or 30 bundles a withdrawal rate that is meant to last 30 years or more through market falls, while the retirement calculator uses a fixed return and a fixed end age, so it can look more generous. Outlook Money says a safer Indian withdrawal rate of 2.5% to 3% means 33 to 40 times, and Finnovate says its own tool does not use a fixed 25 or 30 times. The SWP calculator page covers the withdrawal rate in more detail. If you want a margin, run the plan with a lower return and a later end age, and compare it with the shortcut.
Where can the retirement money come from?
Common sources are EPF, PPF, NPS, mutual funds, fixed deposits and senior citizen schemes, and a retirement calculator needs one blended return for them, or separate runs for each. Finnovate’s tool breaks existing holdings into EPF, PPF, NPS, mutual funds, stocks, fixed deposits and pension, each with its own expected return.
| Source | Rate or point | Source of the figure |
|---|---|---|
| EPF | 8.25% for 2025-26, third year at that rate | Business Today; ThePrint |
| PPF | 7.1% for October to December 2026 | Angel One |
| Senior Citizen Savings Scheme | 8.2% for October to December 2026 | Angel One; Business Today |
| Post Office Monthly Income Scheme | 7.4% | Angel One |
| NPS | Market-linked; part must be annuitised | Finnovate; see the NPS calculator |
| 10-year government bond yield | 6.8% in August 2026 | Marcellus |
Cite this table: Business Today, ThePrint, Angel One, Finnovate and Marcellus, as named; PositionalCalls has not opened the scheme texts or PFRDA rules.
Business Today says the 8.25% EPF rate for 2025-26 was retained for the third consecutive year, credited by 15 July, and Outlook Money says the problem is not the EPF rate but relying on EPF alone. Rates for small savings are set every quarter, so use the PPF calculator, the NPS calculator and the FD calculator for each. Finnovate notes that its retirement tool treats the full NPS value as available corpus even though PFRDA rules require part of it to be annuitised, so check that rule before you count the whole amount.
How should you draw the retirement corpus down?
Once the corpus exists, the question changes from how much to how fast you can take it out, and the answer depends on the order of returns as much as the average. The SWP calculator page shows an example in which the same 15 yearly returns in a different order left the corpus empty in year 15 or Rs 1,07,45,970 intact.
Finnovate suggests keeping 12 to 24 months of expenses in a stable instrument outside the invested corpus, and Retirewise describes a three-bucket plan with 0 to 3 years of spending in safe assets. Wright Research also describes three buckets for liquidity, stability and growth, refilled by a written rule. Business Today carries a view that annuities can help against outliving savings, and Finnovate notes that annuity-style income is usually smaller. None of this is advice. It shows why a single steady return in a retirement calculator is only a first check.
What does the retirement calculator say about a lump sum?
The corpus figure is the amount needed on the first day of retirement, with withdrawals taken at the start of each month. If part of it is in NPS, check how much must go into an annuity. If part is in equity funds, the capital gains rules in mutual fund taxation in India decide how much of each withdrawal is taxed. The retirement calculator ignores both, so the spendable income is lower than the corpus suggests.
Where do sources differ on retirement calculator results?
Sources differ on the corpus for the same inputs, on the inflation figure and on how long to plan, so check every outside retirement calculator for its inflation, return, timing and end age. The points below are the ones I could test.
| Point | Source | My check | Status |
|---|---|---|---|
| Rs 50,000 a month, 30 years, 6% and 8%, 25 years gives Rs 6.75 crore | Fermor | Rs 6.50 crore; its formula uses monthly inflation and end-of-month withdrawals | Method differs |
| Rs 50,000 at 60 needs Rs 7.64 crore to 85 | Tapetide | Rs 6.50 crore at 6% and 8%; Rs 7.29 crore at 7% return | Inputs not stated |
| Rs 40,000 a month needs Rs 58.18 lakh | Groww | Uses 3% inflation and life expectancy 70 | Different inputs |
| Rs 45.7 crore for Rs 4 lakh a month | Dezerv | Rs 45.68 crore on its stated method | Reproduced |
| 8.94% is October inflation | Several pages | 6.09% headline; 8.94% is food, per MoSPI | Mislabelled |
| Life expectancy at 60 is 18.4 years | Wright Research (2019-23) | 17.5 men, 19.8 women in 2020-24 per Dezerv | Edition differs |
Cite this table: PositionalCalls, “Retirement calculator”; Fermor, Tapetide, Groww, Dezerv, MoSPI and Wright Research as named; my calculation with start-of-month withdrawals.
The Groww snippet shows Rs 58.18 lakh and a SIP of Rs 3,878 for Rs 40,000 a month, age 30 to 60, life expectancy 70 and 3% inflation. I could not reproduce it without its return assumption. Tapetide does not state its inflation or return in the text I saw. These are reasons to read the assumptions, not rulings on either page. I did not open any pension scheme document or the PFRDA rules.
What mistakes should you avoid with a retirement calculator?
The most common mistakes are using current spending without inflation, assuming too short a life, ignoring healthcare and counting on EPF alone. Outlook Money lists these among the errors Indians make, and a retirement calculator only helps if its inputs are realistic.
First, using current spending as the retirement figure. A household that spends Rs 50,000 a month needs Rs 2,87,175 after 30 years at 6%. Second, stopping at 80 or 85. A Business Today survey reports that 75.5% of Indians approaching retirement lack a detailed plan and that savings fall 3.6 times short of the goal, and 58.5% expect savings to run out before 80. Third, one inflation number for everything, when healthcare runs at 12% to 14%. Fourth, using the highest return. Fifth, assuming expenses will fall: a Retirewise article quotes a retiree who found that spending had not decreased a year after retiring.
Sixth, treating a house as retirement money. Finnovate’s tool excludes the primary residence, and Dezerv lists over-reliance on illiquid real estate as a mistake. Seventh, leaving out tax and costs, which this retirement calculator also omits. Eighth, never revisiting the plan. Rerun the retirement calculator each year with your actual savings, and compare the funded percentage with last year. Ninth, copying a result from another tool without checking its inflation and end age, which the table above shows can change the answer by crores.
PositionalCalls WhatsApp channel
Mutual fund and retirement updates in one channel
- Tax and small savings rate changes
- Plain-English explainers
- Links to new guides
Retirement calculator: frequently asked questions
What does a retirement calculator do?
A retirement calculator grows your current monthly expenses to the year you retire, then works out the corpus that can pay those rising expenses until a chosen age. For Rs 50,000 a month, retiring at 60 and lasting to 85, this retirement calculator shows Rs 6,49,87,807 at 6% inflation and 8% return, on my calculation.
How much money do I need to retire in India?
There is no single number. Tradejini and HDFC Life describe a rule of 25 to 30 times yearly expenses, while iVentures says 28 to 33 times may suit India. My retirement calculator example needs 18.9 times the first-year expenses because it assumes an 8% return against 6% inflation. Run your own figures instead of copying a headline crore.
What inflation should a retirement calculator use?
Holistic Investment and Fermor use 6%, and HDFC Life says many plans use 6% to 7%. MoSPI reported headline CPI of 6.09% for October 2026 and 5.54% for September, and Dezerv cites 4.45% for July. Healthcare is faster, at 12% to 14% per Business Today and Dezerv. Test 5%, 6% and 7%, as the tables here do.
What return should I assume after retirement?
Finnovate says post-retirement returns commonly range from about 6% to 9% before tax, and Fermor uses 8%. A higher assumption lowers the corpus: on my calculation the Rs 50,000 example needs Rs 8.23 crore at 6% but Rs 5.24 crore at 10%. Use a cautious figure, and check the plan at two points lower.
How long should a retirement calculator plan for?
Dezerv, citing MoSPI’s SRS tables for 2020-24, gives 17.5 further years at 60 for men and 19.8 for women, and Freefincal and Dezerv suggest planning to 90. My example needs Rs 6.50 crore to age 85, Rs 7.43 crore to 90 and Rs 8.27 crore to 95. A couple should plan for the longer-lived partner.
How much SIP do I need to build the corpus?
For the Rs 6.50 crore example over 30 years, my calculation gives a flat SIP of Rs 28,512 a month at a 10% return and Rs 18,411 at 12%. A 10% yearly step-up cuts the starting amount to Rs 10,123 at 10%. Waiting until 40 instead of 30 lifts the flat figure to Rs 84,874. Try your own in the retirement calculator.
Is the 25x or 30x rule better than a retirement calculator?
They answer different questions. The 25x rule is a shortcut tied to a 4% withdrawal, and Outlook Money says a safer Indian rate of 2.5% to 3% means 33 to 40 times. A retirement calculator uses your own age, inflation and return. Finnovate says its calculator does not use a fixed 25x or 30x rule. Compare the two results.
Should I count EPF, PPF and NPS in a retirement calculator?
Yes, as savings already set aside, with a return that matches each. EPF is 8.25% for 2025-26, per Business Today, and PPF is 7.1%, per Angel One. Finnovate notes its tool treats the full NPS value as corpus though PFRDA rules require part to be annuitised. Enter a blended return and check the NPS rules separately.
Does this retirement calculator include tax and healthcare costs?
No. It uses one inflation rate and excludes tax, fees, pension and other income, so healthcare at 12% to 14% a year is not modelled separately. Dezerv shows Rs 30,000 a month of healthcare growing to about Rs 1.9 lakh in 15 years at 13%. Use a higher blended inflation, or add a separate healthcare reserve.
Is this retirement calculator page investment advice?
No. PositionalCalls is not a SEBI-registered research analyst or investment adviser. This retirement calculator shows arithmetic from the numbers you enter and the rules as the cited sources describe them. It does not say which fund, product or retirement age suits any person, and it publishes no buy, sell or avoid calls.
Sources for the retirement calculator page
- Dezerv: how much.
- Dezerv: planning to.
- Dezerv: the healthcare.
- Dezerv: the biggest.
- Fermor: retirement corpus.
- Finnovate: retirement calculator.
- Finnovate: SWP calculator.
- Finnovate: SWP versus.
- MoSPI: press release.
- MoSPI: press release.
- ThePrint: October retail.
- Holistic Investment: calculate retirement.
- HDFC Life: how much.
- Tradejini: how much.
- iVentures: corpus required.
- Outlook Money: the 25X.
- Outlook Money: five retirement.
- Tapetide: retirement calculator.
- Groww: retirement calculator.
- Business Today: India’s retirement.
- Business Today: EPFO 8.25%.
- Business Today: retirement after.
- Business Today: small savings.
- Angel One: small savings.
- Marcellus: three forces.
- Wright Research: outlive your.
- Freefincal: running out.
- Retirewise: is Rs.
- Retirewise: sequence of.
- Kuvera: steps for.
- ThePrint: EPFO fixes.
- Not opened: any pension scheme document, the PFRDA rules, EPFO circulars, the Income-tax Act 2025 and bank rate sheets; Tapetide, Groww, Kuvera and Outlook Money points rest on search snippets; statements are from the sources above, and calculations are mine.
PositionalCalls.com is an independent research site founded by Shubham Chaudhary. PositionalCalls.com is not a SEBI-registered research analyst or investment adviser. Investments in securities markets are subject to market risks. Read all related documents carefully before investing. Returns are never guaranteed. This page is educational and publishes no subscribe, avoid, buy, sell, rating or target calls. Sources: MoSPI, calculator, broker, wealth manager and news pages as named; no pension scheme document, PFRDA rule or EPFO circular opened; no view on whether any fund, product or retirement age suits any person.

Shubham Chaudhary is the founder of PositionalCalls, an independent Indian stock market research website. He writes company fundamentals, quarterly results analysis, IPO analysis and sector research for NSE and BSE listed companies, with a focus on banking stocks, insurance and long-term value investing. Every article is built from primary sources such as RBI, SEBI, NSE and BSE filings and company annual reports, and states its risks plainly in simple language for retail investors.
Coverage areas Our research standards- Numbers checked against NSE, BSE and SEBI filings
- Risks and limits stated in every article
- No paid promotions or broker tie-ups
- Articles updated when new filings arrive