
Mutual funds · Tool
This SIP calculator estimates what a monthly SIP could be worth for the amount, return, years, yearly step-up and inflation you choose, and shows the formula, five worked examples, the effect of time and rate, the monthly amount needed for Rs 1 crore, and why different calculators disagree.
Quick answer
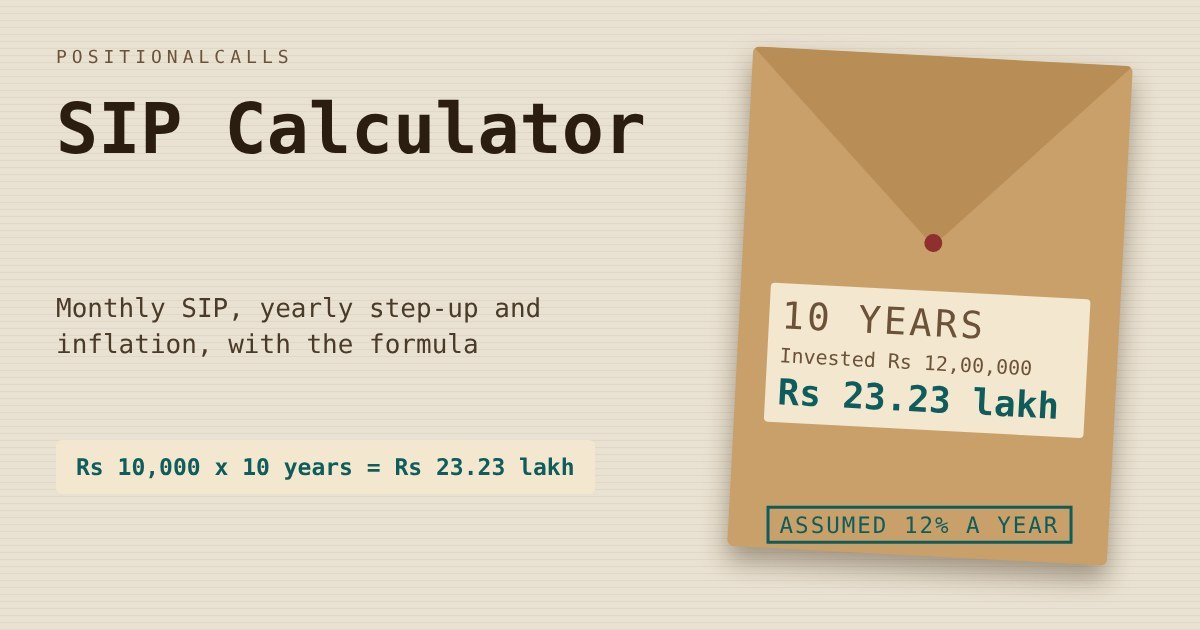
Enter your monthly amount, an assumed yearly return, the years, any yearly step-up and inflation in the SIP calculator below. A Rs 10,000 SIP for 10 years at an assumed 12% builds about Rs 23.23 lakh on Rs 12 lakh invested, an illustration and not a forecast.
SIP calculator: key takeaways
- Formula: M = P × ((1 + i)^n − 1) ÷ i × (1 + i), with i the monthly rate and n the months.
- Time: the same Rs 10,000 SIP is worth Rs 8.25 lakh at 5 years and Rs 99.91 lakh at 20 years at an assumed 12%.
- Method: dividing the yearly rate by 12 gives a higher answer than compounding it, so two calculators can differ.
- Left out: expense ratio, exit load, tax and missed instalments.
- Scope: arithmetic for education. It gives no fund or buy view.
In plain words: a SIP means you put in the same amount every month, and each instalment buys fund units at that month’s price. The calculator pretends the fund earns one fixed return every year, so each instalment grows for a different number of months. Real funds do not grow in a straight line, which is why the answer is an illustration.
Data note: as of Wednesday, 18 November 2026, 3:00 PM IST. The formula and the monthly-rate conventions come from Groww, Sahi, Mutual Funds Sahi Hai and other calculator pages named in the sources. The statements that a SIP does not guarantee returns come from fund-house pages. Every rupee figure marked as my calculation is computed from the formula and was checked against the calculator on this page. No fund performance is quoted, and I did not open any scheme document.
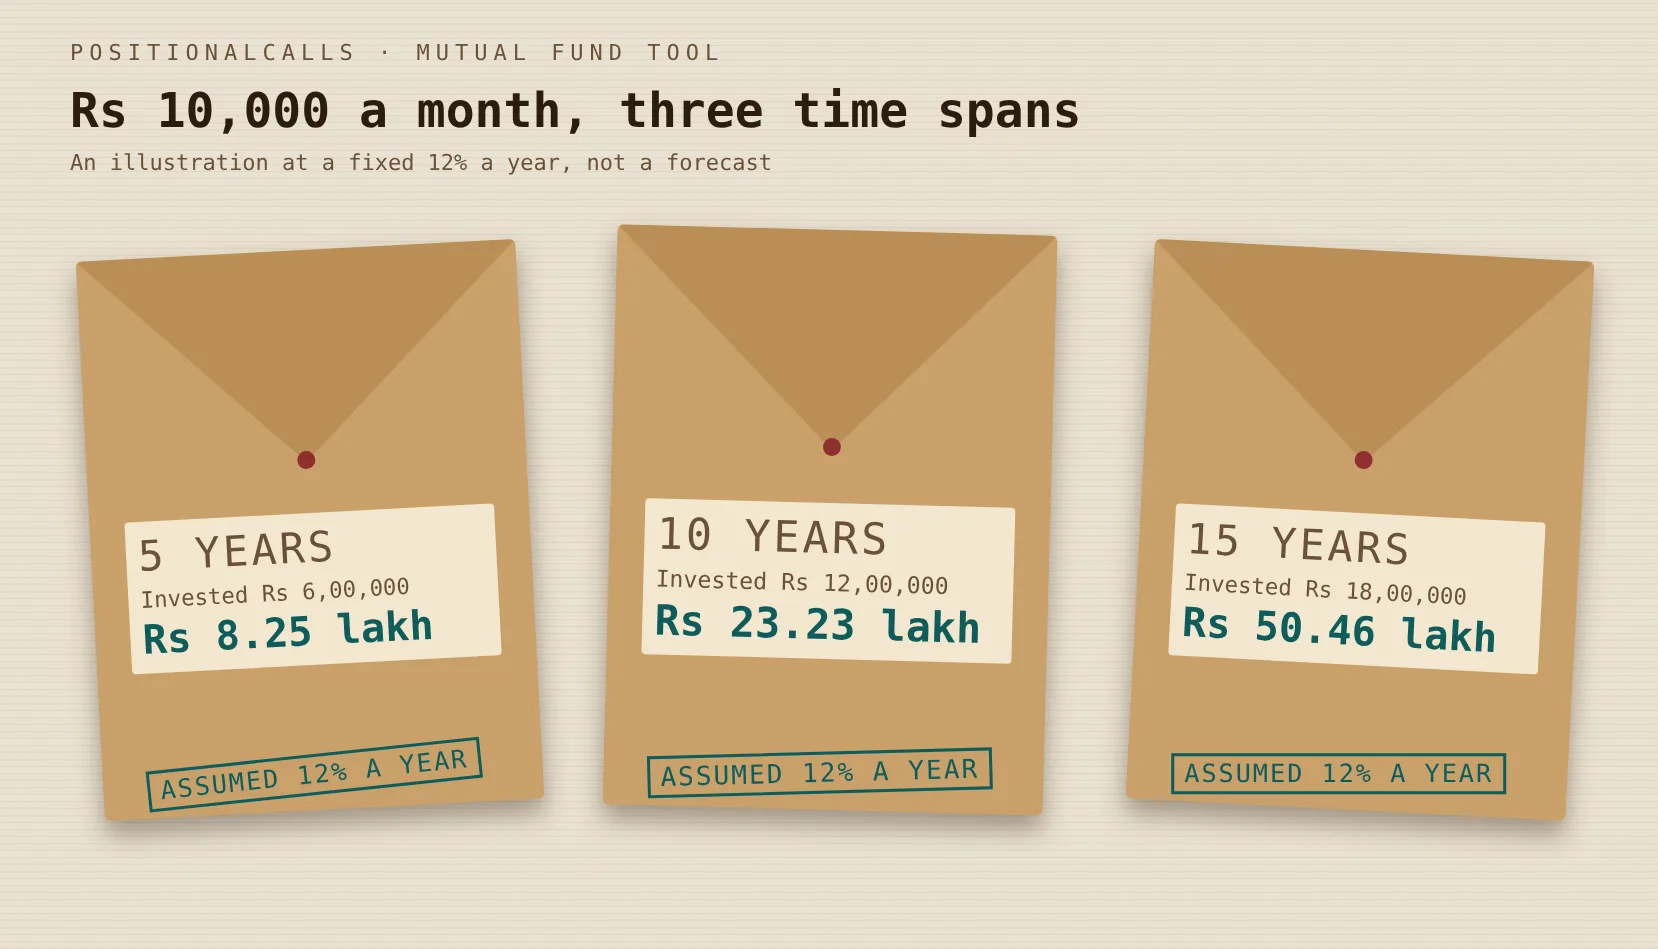 A SIP calculator example at an assumed 12% a year. Source: PositionalCalls calculation using the standard SIP formula.
Use this SIP calculator to estimate a monthly investment
Enter the monthly amount, an assumed return, the years, a yearly step-up and an inflation rate, and the SIP calculator shows the amount invested, the estimated returns and the estimated value. The defaults are Rs 10,000 a month, 12% a year, 10 years, no step-up and 6% inflation. Nothing you type leaves your browser.
An assumption you choose, not a forecast. Real fund returns vary every year.
Leave at 0 for a flat SIP. A step-up raises the instalment once every 12 months.
What should I enter in each box of the SIP calculator?
The monthly amount is the instalment you plan to invest. The return is a yearly rate you assume for the whole period, so choose a range of values rather than one. Years is the length of the SIP, from 1 to 50. The step-up is the percentage by which the instalment rises each year, and zero keeps it flat. Inflation is used only to show the final value in present-day rupees.
How do I read the result?
Total amount invested is the sum of all instalments. Estimated returns is the estimated value minus that amount. The multiple shows how many times the estimated value exceeds the amount invested. The present-day figure divides the estimated value by the inflation factor, and the last line shows the final monthly instalment, which matters when you use a step-up.
What formula does a SIP calculator use?
A SIP calculator uses the future value of an annuity formula, M = P × ((1 + i)^n − 1) ÷ i × (1 + i). Groww, Sahi and Mutual Funds Sahi Hai all give this form, and the table explains each symbol with the default example of Rs 10,000 for 10 years at 12%.
| Symbol | Meaning | Default example |
|---|---|---|
| M | Estimated value at the end | Rs 23,23,391 |
| P | Monthly SIP amount | Rs 10,000 |
| i | Monthly rate, here the yearly rate divided by 12 | 12 ÷ 12 ÷ 100 = 0.01 |
| n | Number of monthly instalments | 10 × 12 = 120 |
| (1 + i) | Extra month of growth, because each instalment is made at the start of the month | 1.01 |
Cite this table: PositionalCalls, “SIP formula symbols”; formula as given by Groww, Sahi and Mutual Funds Sahi Hai; the example is my calculation.
Why does the SIP calculator formula end with (1 + i)?
Because it treats each instalment as invested at the start of its month, so every instalment earns one extra month of return. A calculator that treats the instalment as invested at the end of the month leaves that factor out and shows a slightly lower value. The calculator on this page, like most, uses the start-of-month version.
How does the calculator handle a step-up?
The standard formula needs a fixed instalment, so a step-up cannot use it directly. The calculator adds the instalments month by month instead, growing the balance by the monthly rate each time and raising the instalment by the step-up percentage after every 12 months. With a step-up of zero it matches the formula exactly.
What do five worked examples of the SIP calculator show?
Three monthly amounts at the same assumed 12% for 10 years show that the result scales with the instalment. Doubling the monthly amount doubles the amount invested and the estimated value, because the formula is linear in P. The table uses the divide-by-12 method.
| Monthly SIP | Years | Amount invested | Estimated value | Estimated returns |
|---|---|---|---|---|
| Rs 5,000 | 10 | Rs 6,00,000 | Rs 11,61,695 | Rs 5,61,695 |
| Rs 10,000 | 10 | Rs 12,00,000 | Rs 23,23,391 | Rs 11,23,391 |
| Rs 25,000 | 10 | Rs 30,00,000 | Rs 58,08,477 | Rs 28,08,477 |
Cite this table: PositionalCalls, “Worked examples at 12%”; arithmetic by PositionalCalls at an assumed 12% a year; Sahi gives about Rs 11.6 lakh for the Rs 5,000 case.
Does the Rs 5,000 example match another source?
Yes. Sahi works the same case, Rs 5,000 a month at 12% for 10 years, and gets approximately Rs 11.6 lakh on Rs 6 lakh invested, which agrees with the Rs 11,61,695 in the table, my calculation. A calculator that uses the compounded monthly rate gives a different figure, which the last section shows.
Are these figures a forecast?
No. They show what the arithmetic gives when a fund earns exactly 12% a year with no variation. Funds do not behave that way, so the values are illustrations. Any year with a loss, or a longer stretch of low returns, would change the result, and the SIP calculator cannot show that sequence.
How does time change the result in a SIP calculator?
Time matters more than the monthly amount, because each year of compounding builds on the earlier ones. The table keeps Rs 10,000 a month and the assumed 12% and changes only the number of years. The estimated value grows faster than the amount invested.
| Years | Amount invested | Estimated value | Value as a multiple |
|---|---|---|---|
| 5 | Rs 6,00,000 | Rs 8,24,864 | 1.37 times |
| 10 | Rs 12,00,000 | Rs 23,23,391 | 1.94 times |
| 15 | Rs 18,00,000 | Rs 50,45,760 | 2.80 times |
| 20 | Rs 24,00,000 | Rs 99,91,479 | 4.16 times |
| 25 | Rs 30,00,000 | Rs 1,89,76,351 | 6.33 times |
Cite this table: PositionalCalls, “Results by years”; arithmetic by PositionalCalls at an assumed 12% and Rs 10,000 a month.
What does the table say about starting late?
Going from 20 to 25 years adds Rs 6 lakh of instalments and raises the estimated value from Rs 99.91 lakh to Rs 1.90 crore at the assumed 12%. The jump comes from compounding on a large balance, not from the extra instalments. The same arithmetic means a short SIP leaves little time for the effect to build.
Is a longer SIP always better?
Not on this evidence alone. The SIP calculator assumes the return holds for every year, and a long period only helps if the fund earns a positive return on average. A fund that earns little or loses money gains nothing from more time. The table shows arithmetic, so it cannot say which funds will earn what.
How does the assumed return change a SIP calculator result?
A small change in the assumed rate moves the result by a large amount over ten years. The table holds Rs 10,000 a month and 10 years constant. Moving from 8% to 14% takes the estimated value from Rs 18.42 lakh to Rs 26.21 lakh, my calculation.
| Assumed return a year | Amount invested | Estimated value | Estimated returns |
|---|---|---|---|
| 8% | Rs 12,00,000 | Rs 18,41,657 | Rs 6,41,657 |
| 10% | Rs 12,00,000 | Rs 20,65,520 | Rs 8,65,520 |
| 12% | Rs 12,00,000 | Rs 23,23,391 | Rs 11,23,391 |
| 14% | Rs 12,00,000 | Rs 26,20,914 | Rs 14,20,914 |
Cite this table: PositionalCalls, “Results by return rate”; arithmetic by PositionalCalls at Rs 10,000 a month for 10 years.
Which rate should I use in the SIP calculator?
No single rate is right. Outlook Money says relying on a fixed 12% assumption can mislead a financial plan, and Lemonn adds that a 12% figure in an illustration is not a promise. A practical way to use the tool is to run several rates and see how wide the range is. Planning around the lowest figure leaves room for a weaker outcome.
Why not use a past return from a fund page?
Past performance may not continue, a point HSBC Mutual Fund makes in its SIP material. A figure from a fund page covers a specific period and may include a strong stretch. The SIP calculator applies one rate to every year, so entering a past number would treat a history as if it were a rule.
PositionalCalls WhatsApp channel
Get mutual fund tools on WhatsApp
- Tool and rule changes, dated
- Plain-English calculators, no tips
- Links to updated tool pages
What does a step-up do in a SIP calculator?
A step-up raises the instalment each year, so more money goes in during the later years, when the balance is already large. Tata Mutual Fund describes a step-up SIP as increasing the amount at fixed intervals by a preset percentage or amount. The table uses Rs 10,000 a month, 12% and 10 years.
| Yearly step-up | Amount invested | Estimated value | Last monthly instalment |
|---|---|---|---|
| 0% (flat) | Rs 12,00,000 | Rs 23,23,391 | Rs 10,000 |
| 5% | Rs 15,09,347 | Rs 27,86,942 | Rs 15,513 |
| 10% | Rs 19,12,491 | Rs 33,74,326 | Rs 23,579 |
Cite this table: PositionalCalls, “Step-up results”; arithmetic by PositionalCalls; step-up definition from Tata Mutual Fund.
Is a higher estimated value from a step-up a better outcome?
Not necessarily. A step-up value is higher partly because you invest more. The 10% case puts in Rs 19.12 lakh instead of Rs 12 lakh, so the value rises with the money you add. The multiple of value to amount invested is lower with a step-up, because the later instalments have less time to grow.
How should I pick a step-up percentage?
Match it to what you can afford. HSBC Mutual Fund says top-ups can help offset the effect of inflation on your investment over time, and Tata Mutual Fund says the feature suits investors who expect to increase their contribution. Check the last instalment in the SIP calculator result to see whether that amount is realistic for you in year ten.
How does inflation change a SIP calculator result?
Inflation reduces what a future sum can buy, so the headline value overstates spending power. The calculator divides the estimated value by (1 + inflation) raised to the number of years. At 6% inflation, Rs 23,23,391 after 10 years is worth Rs 12,97,369 in present-day rupees, my calculation.
| Item | Figure | How it is worked out |
|---|---|---|
| Estimated value after 10 years | Rs 23,23,391 | Rs 10,000 at 12% |
| Inflation assumed | 6% a year | An assumption you can change |
| Divisor | 1.7908 | 1.06 raised to 10 |
| Value in present-day rupees | Rs 12,97,369 | Rs 23,23,391 ÷ 1.7908 |
Cite this table: PositionalCalls, “Inflation adjustment”; arithmetic by PositionalCalls; the inflation rate is an assumption.
Which inflation rate should I enter?
Use a rate you believe is reasonable for your own expenses, and test a higher and a lower value. I do not quote a forecast here. The point of the present-day line in the SIP calculator is to remind you that a larger number in the future does not mean the same increase in what you can buy.
How does a SIP compare with a lump sum in a SIP calculator?
A lump sum puts all the money to work from the first day, while a SIP adds it over time, so with the same total the lump sum compounds for longer. The table compares Rs 12 lakh invested at once with Rs 10,000 a month for 10 years, both at an assumed 12% a year.
| Approach | Money invested | Estimated value after 10 years | Why it differs |
|---|---|---|---|
| Lump sum of Rs 12,00,000 | Rs 12,00,000 on day one | Rs 37,27,018 | All money grows for 10 years |
| SIP of Rs 10,000 a month | Rs 12,00,000 over 120 months | Rs 23,23,391 | Each instalment grows for fewer months |
Cite this table: PositionalCalls, “SIP versus lump sum arithmetic”; lump sum at 12% compounded yearly, SIP at 1% a month; arithmetic by PositionalCalls.
Does this mean a lump sum is better?
No. The comparison assumes you have Rs 12 lakh available on day one and that the fund earns the same return every year, which is the assumption the SIP calculator makes. Most people build savings from income over time, and SIPs exist for that reason. The table shows the effect of timing, not which choice suits you, and it ignores that markets can fall after a lump sum is invested.
How much SIP do I need for Rs 1 crore in a SIP calculator?
At an assumed 12% a year with the divide-by-12 method, a monthly SIP of about Rs 43,041 reaches Rs 1 crore in 10 years. Longer periods need much less each month. The table solves the formula for P and rounds the result.
| Years | Monthly SIP needed | Amount invested | Estimated value |
|---|---|---|---|
| 10 | Rs 43,041 | Rs 51,64,920 | About Rs 1,00,00,000 |
| 15 | Rs 19,819 | Rs 35,67,420 | About Rs 1,00,00,000 |
| 20 | Rs 10,009 | Rs 24,02,160 | About Rs 1,00,00,000 |
Cite this table: PositionalCalls, “Monthly SIP for Rs 1 crore”; arithmetic by PositionalCalls at an assumed 12% a year with the annual rate divided by 12.
Why does the SIP calculator need a different amount at a lower return?
At a lower assumed return, each instalment grows less, so a larger monthly amount is needed for the same target. If you set the return to 8% instead of 12%, the amount rises sharply. Run the SIP calculator at several rates before you pick a goal amount, and treat the lower result as a safer planning figure.
Can I reverse the calculation in the calculator?
The calculator goes forward, from an amount to a value. To work out the amount for a target, try amounts until the value reaches the target, or divide the target by the annuity factor, the part of the formula after P. For 10 years at 1% a month the factor is about 232.34, so Rs 1 crore divided by that gives the figure above.
What does a SIP calculator leave out?
The calculator leaves out everything except one assumed return, so real results can differ in both directions. The table lists what is missing and why it matters.
| Left out | Why it matters |
|---|---|
| Expense ratio | It is deducted from the fund’s returns, so a net return is lower than a gross one |
| Exit load | A charge for leaving early that reduces what you receive |
| Tax | Equity fund gains are taxed on sale; see the tax page |
| Missed instalments | A skipped month lowers the amount invested and the value |
| Return variation | A real fund goes up and down; the calculator uses one rate |
Cite this table: PositionalCalls, “What the tool leaves out”; points from fund-house and broker pages on SIP risk as named in the sources.
How are gains from a SIP taxed when I sell?
For listed equity and equity-oriented funds in FY 2026-27, gains on units held 12 months or less are taxed at 20%, and gains above Rs 1.25 lakh a year on units held longer are taxed at 12.5%, plus 4% cess, per the TaxGuru and Sahi guides cited on this site. Each instalment is a separate purchase with its own holding period. The mutual fund taxation in India page and the capital gains tax calculator cover the rest.
Is a SIP a safe investment?
A SIP is a method, not a guarantee. Bajaj Finserv says it does not remove market risk or guarantee returns, and Aditya Birla Sun Life Mutual Fund says a SIP does not assure a profit or guarantee protection against loss in a declining market. The SIP calculator cannot show a loss because it assumes a fixed return. For a scheme whose rate is set by the government each quarter, the PPF calculator shows a maturity estimate on the same kind of yearly arithmetic, and the FD calculator does the same for a bank deposit. For the cost side of money you borrow, the EMI calculator works out the monthly instalment. Once the corpus is built and you start taking money out, the SWP calculator shows how long it lasts.
Why do different SIP calculators give different answers?
They convert the yearly return to a monthly rate in two ways, and the two methods give different values for the same inputs. Many pages, including Sahi and Mutual Funds Sahi Hai, divide the annual rate by 12. Others, including Fermor, StockCalc and Itrstats, compound it, so 12% becomes 0.9489% a month and they call dividing by 12 an approximation that inflates results.
| Monthly SIP, 10 years, 12% | Annual rate ÷ 12 (1% a month) | Compounded rate (0.9489% a month) | Difference |
|---|---|---|---|
| Rs 5,000 | Rs 11,61,695 | Rs 11,20,179 | Rs 41,516 |
| Rs 10,000 | Rs 23,23,391 | Rs 22,40,359 | Rs 83,032 |
| Rs 25,000 | Rs 58,08,477 | Rs 56,00,897 | Rs 2,07,580 |
Cite this table: PositionalCalls, “Monthly-rate method conflict”; arithmetic by PositionalCalls; methods as described by Sahi, Groww, Fermor, StockCalc and Itrstats.
Which method does this SIP calculator use?
It lets you choose. The default divides the yearly rate by 12, the convention most calculators and the Sahi example use, and a drop-down switches to the compounded method. Groww gives the same formula but describes the compounded conversion as the right way to get the monthly return, so the sources themselves do not agree.
What should I check before relying on any result?
- The method used to convert the yearly return into a monthly one.
- Whether instalments are assumed at the start or the end of the month.
- The assumed return, which should be one you would not be shocked to miss.
- Whether the figure includes inflation, tax and fund charges.
- Your own goal and time horizon.
What is this page not for?
It does not tell you which fund to pick, how much to invest or whether to start a SIP. PositionalCalls is not a SEBI-registered research analyst or investment adviser, and I am not a chartered accountant. The SIP calculator applies arithmetic to numbers you supply, and mutual fund investments are subject to market risks.
PositionalCalls WhatsApp channel
Fund tools in one channel
- Rule changes, dated
- Tools without tips
- Links to new guides
SIP calculator: frequently asked questions
How does a SIP calculator work?
A SIP calculator applies the future value of an annuity formula to your monthly amount, the assumed yearly return and the number of months. For Rs 10,000 a month at 12% for 10 years, the sip calculator gives about Rs 23.23 lakh on Rs 12 lakh invested, my calculation.
What is the formula used in a SIP calculator?
The common formula is M = P × ((1 + i)^n − 1) ÷ i × (1 + i), where P is the monthly amount, i is the monthly rate and n is the number of months, per Groww and Sahi. The extra (1 + i) treats each instalment as invested at the start of the month.
Is the SIP return in the calculator guaranteed?
No. A SIP is a method of investing in a mutual fund, not a product with a fixed return, and Aditya Birla Sun Life Mutual Fund says a SIP does not guarantee returns or protect capital. A SIP calculator shows an illustration from a rate you type,
What is a step-up SIP in a SIP calculator?
A step-up or top-up SIP raises the instalment by a set percentage at fixed intervals, usually every year, per Tata Mutual Fund. In this sip calculator, a 10% yearly step-up on Rs 10,000 for 10 years raises the amount invested to Rs 19,12,491 and the estimated value to Rs 33,74,326, my calculation.
Why do two SIP calculators give different answers for the same inputs?
They convert the yearly rate to a monthly rate in different ways. Many divide by 12, so 12% becomes 1% a month. Others compound it, so 12% becomes 0.9489% a month. On Rs 10,000 for 10 years that is Rs 23,23,391 versus Rs 22,40,359, my calculation. This sip calculator lets you choose either method.
How much SIP do I need to build Rs 1 crore?
At an assumed 12% a year with the annual rate divided by 12, about Rs 43,041 a month builds Rs 1 crore in 10 years, Rs 19,819 in 15 years and Rs 10,009 in 20 years, my calculation. These are assumptions, not forecasts. A lower return needs a higher SIP amount, so test several rates.
Does the SIP calculator include tax and expense ratio?
No. The sip calculator leaves out the fund’s expense ratio, exit load, tax and any missed instalments. Equity fund gains are taxed when you sell: 20% within 12 months and 12.5% above Rs 1.25 lakh a year after that, per the tax guides on this site.
What return rate should I enter in a SIP calculator?
There is no correct number, and Outlook Money warns that relying on a fixed 12% assumption can mislead a financial plan. Run the sip calculator at several rates, such as 8%, 10%, 12% and 14%, and plan around the lower figures. At Rs 10,000 for 10 years, 8% gives Rs 18.4 lakh.
Is the SIP value shown in future rupees or present-day rupees?
The headline value is in future rupees, with no inflation applied. The calculator also shows the value in present-day rupees using the inflation rate you enter. At 6% inflation, Rs 23,23,391 after 10 years is worth about Rs 12,97,369 in present-day rupees, my calculation, so the spending power is lower than the headline.
Is this SIP calculator advice to start or stop a SIP?
No. PositionalCalls is not a SEBI-registered research analyst or investment adviser, and I am not a chartered accountant. The calculator shows arithmetic on numbers you type. It gives no fund, subscribe, avoid, buy, sell or target view, and it does not replace your own goals.
Sources for the SIP calculator
- Groww: SIP calculator, broker.
- Sahi: SIP full form,, broker.
- Mutual Funds Sahi Hai: SIP calculator, industry.
- Fermor: SIP calculator, tool.
- StockCalc: step-up SIP calculator, tool.
- Itrstats: SIP calculator, tool.
- Aditya Birla Sun Life MF: benefits of SIP, fund house.
- Kotak Mutual Fund: SIP myths, fund house.
- Bajaj Finserv: what is SIP, broker.
- Tata Mutual Fund: what is step-up, fund house.
- Outlook Money: when SIPs fail, news.
- Lemonn: SIP returns guaranteed, broker.
- TaxGuru: equity STCG and, tax.
- Sahi: LTCG tax, Budget, broker.
- Not opened: scheme documents, AMFI or SEBI circulars and the Income-tax Act; the formula and statements are from the sources above.
PositionalCalls.com is an independent research site founded by Shubham Chaudhary. PositionalCalls.com is not a SEBI-registered research analyst or investment adviser. Investments in securities markets are subject to market risks. Read all related documents carefully before investing. Returns are never guaranteed. This page is educational and publishes no subscribe, avoid, buy, sell, rating or target calls. Sources: calculator, broker, fund-house and tax pages as named; no scheme document opened; no fund, buy, sell or avoid view given. I am not a chartered accountant.

Shubham Chaudhary is the founder of PositionalCalls, an independent Indian stock market research website. He writes company fundamentals, quarterly results analysis, IPO analysis and sector research for NSE and BSE listed companies, with a focus on banking stocks, insurance and long-term value investing. Every article is built from primary sources such as RBI, SEBI, NSE and BSE filings and company annual reports, and states its risks plainly in simple language for retail investors.
Coverage areas Our research standards- Numbers checked against NSE, BSE and SEBI filings
- Risks and limits stated in every article
- No paid promotions or broker tie-ups
- Articles updated when new filings arrive