
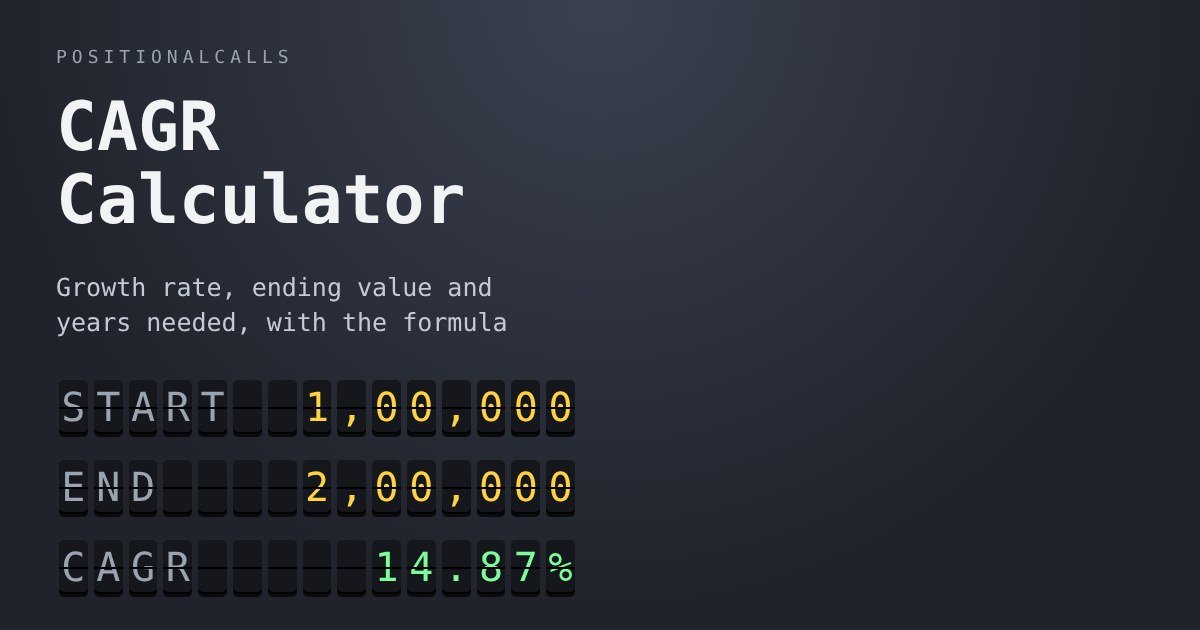
Investing · Tool
This CAGR calculator finds the yearly growth rate between a beginning and an ending value, or the ending value and the years needed from a CAGR you choose, and it explains the formula, absolute return, XIRR, the rule of 72 and an inflation-adjusted rate with worked examples.
Quick answer
Enter a beginning value, an ending value and the years in the CAGR calculator below. CAGR is (ending ÷ beginning)^(1 ÷ years) − 1. Rs 1,00,000 growing to Rs 2,00,000 in 5 years is a CAGR of 14.87% a year, my calculation, which Tata Capital also shows.
CAGR calculator: key takeaways
- Formula: CAGR = (Ending value ÷ Beginning value)^(1 ÷ n) − 1.
- Versus absolute return: the same 100% total gain is 41.42% a year over 2 years and 7.18% over 10 years.
- SIPs: use XIRR for monthly investments; CAGR suits one start and one end value.
- Real return: divide (1 + CAGR) by (1 + inflation) and subtract 1.
- Scope: arithmetic for education. It gives no fund or buy view.
In plain words: if you put in Rs 1 lakh and it became Rs 2 lakh five years later, CAGR answers one question: at what steady yearly rate would Rs 1 lakh have had to grow to reach Rs 2 lakh in five years? The answer is a single yearly percentage you can set beside a bank deposit, an index or another investment held for a different length of time.
Data note: as of Wednesday, 18 November 2026, 4:00 PM IST. The formula and worked examples come from 5paisa, Tata Capital, Angel One, Upgrowth, Munim, Belong and other pages named in the sources. Figures marked as my calculation are computed from the formula and match the calculator on this page. No fund or stock performance is quoted, and the example values are round numbers, not a forecast.
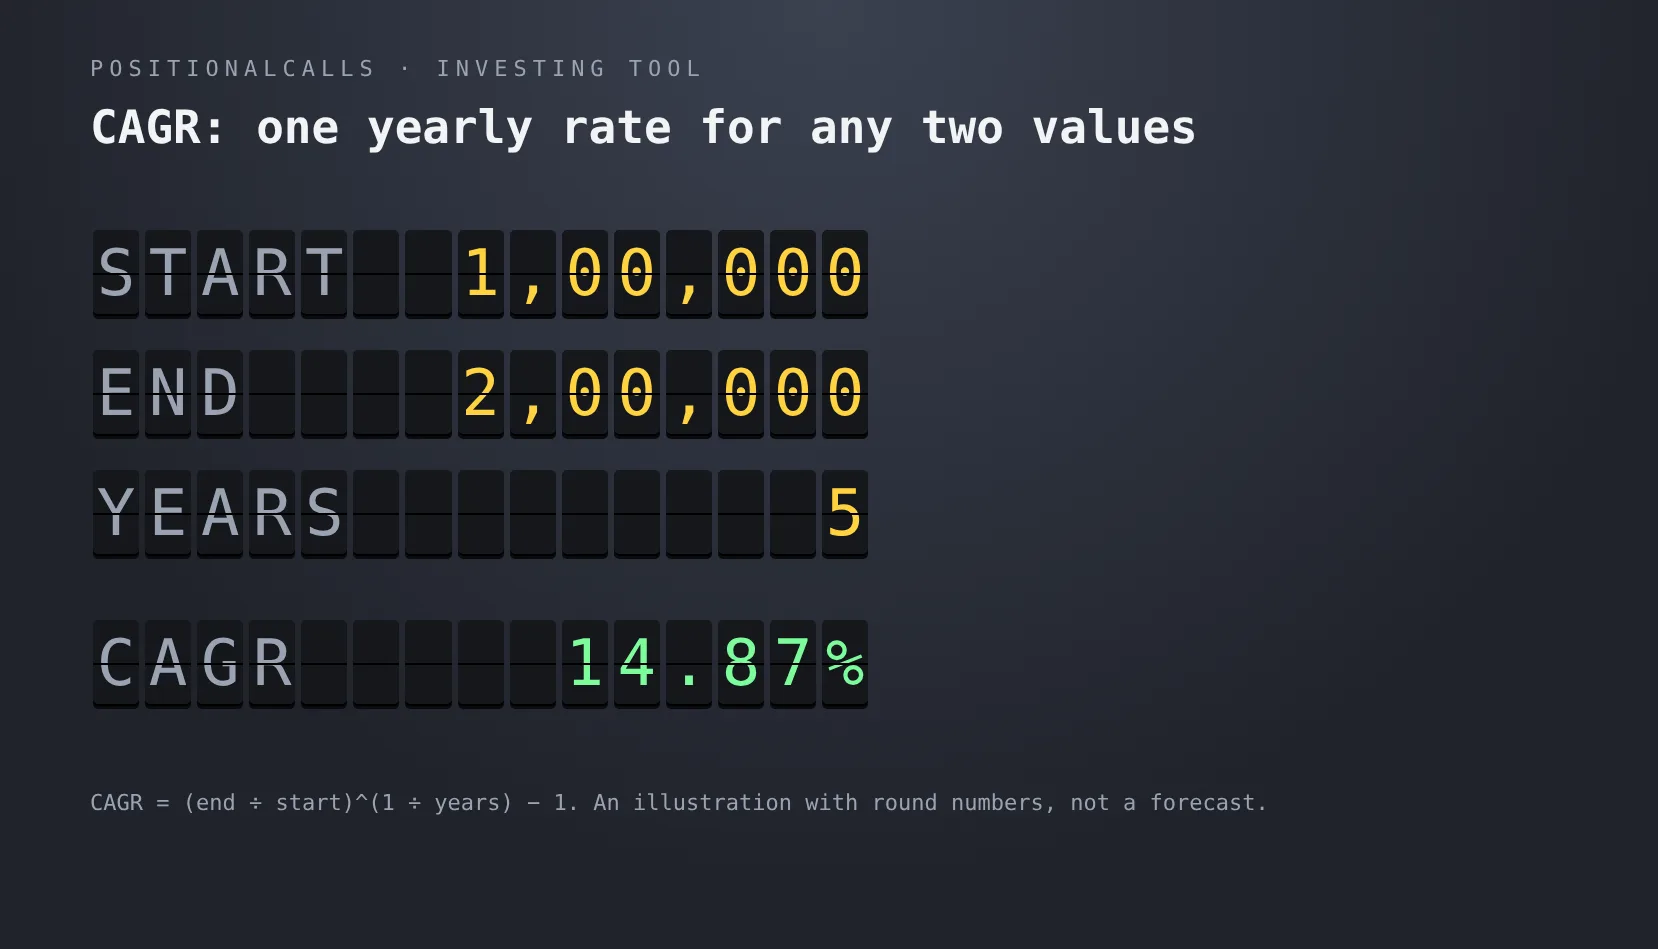
A CAGR calculator example: Rs 1 lakh to Rs 2 lakh in 5 years. Source: PositionalCalls calculation using the standard CAGR formula.
Use this CAGR calculator to find a growth rate, an ending value or the years needed
Pick what you want to find, enter the values you know, and the CAGR calculator shows the result with the absolute return and the multiple. The default finds the CAGR for Rs 1,00,000 growing to Rs 2,00,000 in 5 years. Nothing you type leaves your browser.
Used when finding CAGR or years. Ignored when finding the ending value.
Used when finding CAGR or the ending value. Decimals such as 2.5 are allowed.
Used only when finding the ending value or the years needed.
Which boxes does each mode use?
To find CAGR, use the beginning value, the ending value and the years. To find an ending value, use the beginning value, the years and a CAGR. To find the years needed, use the beginning value, the ending value and a CAGR. The boxes not used in a mode are ignored, so leave them as they are.
How do I read the CAGR calculator result?
The first line is the answer for the mode you chose. The absolute return is the total gain as a percentage of the start, with no time in it. The multiple shows how many times the ending value exceeds the start. For a positive CAGR the tool also shows the exact years to double at that rate.
What is the formula behind a CAGR calculator?
CAGR = (Ending value ÷ Beginning value)^(1 ÷ n) − 1, where n is the number of years. 5paisa, Angel One, Tata Capital and FundsIndia all give this form. Multiply by 100 for a percentage. The table lists the symbols and the solved forms used by the three modes of the calculator.
| Find | Formula | Example |
|---|---|---|
| CAGR | (Ending ÷ Beginning)^(1 ÷ n) − 1 | (2,00,000 ÷ 1,00,000)^(1 ÷ 5) − 1 = 14.87% |
| Ending value | Beginning × (1 + CAGR)^n | 1,00,000 × 1.12^10 = Rs 3,10,585 |
| Years needed | ln(Ending ÷ Beginning) ÷ ln(1 + CAGR) | ln 10 ÷ ln 1.12 = 20.32 years |
| Absolute return | (Ending − Beginning) ÷ Beginning | (2,00,000 − 1,00,000) ÷ 1,00,000 = 100% |
Cite this table: PositionalCalls, “CAGR formulas and examples”; formula as given by 5paisa, Angel One and Tata Capital; the solved forms and examples are my calculation.
Why is it a power and not a division?
Because growth compounds. If a value grows by the same rate each year, the end value is the beginning value multiplied by (1 + rate) once per year. Taking the n-th root of the total growth factor undoes that, which is what raising to the power of 1 ÷ n does. A plain division by the years would give a simple average, not a compounded one.
What happens with part of a year?
Enter the years as a decimal. A holding of 2 years and 6 months is 2.5 years. The formula works for any positive n, so the CAGR calculator accepts decimals. Count the time between the two dates, because an error of a few months changes the rate noticeably on a short holding.
What do six worked examples of the CAGR calculator show?
Six examples from broker and bank pages and a loss case show how the same formula behaves. Each value was recomputed with the calculator and matches the figure the source gives, apart from rounding.
| Beginning | Ending | Years | CAGR | Source or note |
|---|---|---|---|---|
| Rs 1,00,000 | Rs 2,00,000 | 5 | 14.87% | Tata Capital shows 14.87% |
| Rs 5,00,000 | Rs 11,00,000 | 8 | 10.36% | 5paisa shows about 10.36% |
| Rs 1,00,000 | Rs 1,50,000 | 4 | 10.67% | Angel One uses this case; my calculation |
| Rs 2,00,000 | Rs 3,50,000 | 5 | 11.84% | Belong uses this case; my calculation |
| Rs 1,00,000 | Rs 2,50,000 | 5 | 20.11% | Tapetide shows about 20.11% |
| Rs 1,00,000 | Rs 50,000 | 2 | −29.29% | A loss; my calculation |
Cite this table: PositionalCalls, “CAGR worked examples”; cases from Tata Capital, 5paisa, Angel One, Belong and Tapetide; arithmetic by PositionalCalls.
Do the examples show a forecast?
No. They show what a given start and end imply, not what any investment will do. A beginning value, an ending value and a time period are facts about the past or an assumption you choose. The CAGR calculator cannot tell you how an investment will behave in the future.
Why does the loss example give a negative number?
Because the ending value is below the start, so the ratio is less than 1 and the root is less than 1. Subtracting 1 leaves a negative rate. Rs 1,00,000 falling to Rs 50,000 over two years is a 50% absolute loss and a CAGR of −29.29% a year, my calculation, since a yearly loss compounds.
How is CAGR different from absolute return in a CAGR calculator?
Absolute return is the total gain and ignores time, while CAGR spreads that gain over the years with compounding. Upgrowth makes the point that 50% over one year is excellent and over ten years is poor. The table holds the absolute return at 100% and changes only the time.
| Beginning | Ending | Years | Absolute return | CAGR |
|---|---|---|---|---|
| Rs 1,00,000 | Rs 2,00,000 | 2 | 100% | 41.42% |
| Rs 1,00,000 | Rs 2,00,000 | 5 | 100% | 14.87% |
| Rs 1,00,000 | Rs 2,00,000 | 10 | 100% | 7.18% |
Cite this table: PositionalCalls, “Absolute return versus CAGR”; arithmetic by PositionalCalls; the time point follows Upgrowth.
When is absolute return enough?
When you compare two investments held for the same period, or when the holding is short. Angel One says absolute return is more relevant for shorter periods. As soon as the periods differ, the CAGR calculator is the fairer measure, since a 100% gain over 2 years and over 10 years are not the same achievement.
What does a given CAGR do to Rs 1 lakh over ten years?
A higher CAGR compounds into a much larger sum over a long period. The table uses the ending-value mode of the CAGR calculator: Rs 1,00,000 held for 10 years at four assumed rates. The rates are assumptions, not predictions.
| Assumed CAGR | Ending value after 10 years | Absolute return | Multiple |
|---|---|---|---|
| 8% | Rs 2,15,892 | 115.89% | 2.16 times |
| 10% | Rs 2,59,374 | 159.37% | 2.59 times |
| 12% | Rs 3,10,585 | 210.59% | 3.11 times |
| 15% | Rs 4,04,556 | 304.56% | 4.05 times |
Cite this table: PositionalCalls, “Rs 1 lakh at four assumed rates for 10 years”; arithmetic by PositionalCalls.
How long to reach ten times the money?
The years-needed mode shows how rate drives time. To turn Rs 1,00,000 into Rs 10,00,000 takes about 29.92 years at 8%, 24.16 at 10%, 20.32 at 12% and 16.48 at 15%, my calculation. The same target takes almost half the time at the highest rate, which shows why small differences in the assumed rate matter in a plan.
How long does it take to double money at a given CAGR, and what is the rule of 72?
The exact doubling time is ln 2 ÷ ln(1 + CAGR), and the rule of 72 estimates it as 72 ÷ the rate. Rupee Rubric uses the rule, giving about 5.8 years at 12.33%. The table compares the two methods for five rates and shows that the rule is close but not exact.
| CAGR | Exact years to double | Rule of 72 estimate | Gap |
|---|---|---|---|
| 6% | 11.90 | 12.0 | 0.10 |
| 8% | 9.01 | 9.0 | -0.01 |
| 10% | 7.27 | 7.2 | -0.07 |
| 12% | 6.12 | 6.0 | -0.12 |
| 15% | 4.96 | 4.8 | -0.16 |
Cite this table: PositionalCalls, “Doubling time: exact versus rule of 72”; arithmetic by PositionalCalls; rule as used by Rupee Rubric.
Which should I use?
Use the rule for a quick mental check and the calculator when you need the figure. The rule overstates the time at low rates and understates it at higher ones, but the gap is under a quarter of a year in the table. It also assumes the rate holds, which real returns do not. At the 7.1% reported for PPF, doubling takes about 10.1 years, my calculation; see the PPF calculator.
PositionalCalls WhatsApp channel
Get investing tools on WhatsApp
- Tool and rule changes, dated
- Plain-English calculators, no tips
- Links to updated tool pages
How do I turn a CAGR into a real return after inflation?
Divide (1 + CAGR) by (1 + inflation) and subtract 1, which is slightly different from subtracting the two rates. A 12% nominal CAGR with 6% inflation is a real CAGR of 5.66%, my calculation, and not 6%. The table shows three nominal rates against 6% assumed inflation.
| Nominal CAGR | Assumed inflation | Real CAGR | Simple subtraction |
|---|---|---|---|
| 8% | 6% | 1.89% | 2% |
| 10% | 6% | 3.77% | 4% |
| 12% | 6% | 5.66% | 6% |
Cite this table: PositionalCalls, “Real CAGR after inflation”; arithmetic by PositionalCalls; the inflation rate is an assumption.
Why does this matter?
The nominal figure from a CAGR calculator overstates what the money can buy. The Rs 3,10,585 in the ten-year table is worth less in present-day rupees. Entering your own inflation rate and comparing the real rate with the nominal one keeps the headline in perspective, and I do not forecast inflation here.
Why is averaging yearly returns different from using a CAGR calculator?
The simple average of yearly returns overstates growth whenever returns vary, which is why CAGR uses the compounded rate. Rupee Rubric makes this point with a Rs 1 lakh example. The table uses a simpler case: a gain of 50% followed by a fall of 30%.
| Year | Return | Value at year end (start Rs 1,00,000) |
|---|---|---|
| 1 | +50% | Rs 1,50,000 |
| 2 | −30% | Rs 1,05,000 |
| Simple average of the two returns | +10% | Not a growth rate |
| CAGR over two years | +2.47% | Rs 1,05,000 |
Cite this table: PositionalCalls, “Average return versus CAGR”; arithmetic by PositionalCalls; the point follows Rupee Rubric.
What does this mean for a fund factsheet?
When you see a simple average of yearly returns, treat it as higher than what you would have earned. A compounded rate is the fair summary. The CAGR calculator turns the beginning and ending value into that rate directly, so you do not need the yearly figures.
What CAGR do I need to reach a goal, using a CAGR calculator?
The same formula works backwards from a target: the CAGR needed is the target ratio raised to 1 ÷ years, minus 1. The table asks what yearly rate turns Rs 10 lakh into Rs 1 crore, a ten-times target, over three periods. A longer period lowers the rate needed.
| Target | Years | CAGR needed | Reading |
|---|---|---|---|
| Rs 10 lakh to Rs 1 crore | 10 | 25.89% | A demanding rate over a short period |
| Rs 10 lakh to Rs 1 crore | 15 | 16.59% | Lower, but still above the figures in the earlier tables |
| Rs 10 lakh to Rs 1 crore | 20 | 12.20% | Needs the longest period |
Cite this table: PositionalCalls, “CAGR needed for a ten-times goal”; arithmetic by PositionalCalls with the standard formula.
Does the goal table say a target is achievable?
No. It says what rate the arithmetic needs. Whether any investment can deliver that rate, with what risk, is a separate question the CAGR calculator cannot answer. Treat a required rate that looks high as a sign to revisit the amount, the time or the target, not as a prediction.
How does the CAGR calculator handle holding periods that are not whole years?
The same total gain gives a very different yearly rate depending on how long it took, so measure the time carefully. The table fixes a 30% gain, Rs 1,00,000 to Rs 1,30,000, and changes the holding period to years with fractions.
| Holding period | Years entered | Absolute return | CAGR |
|---|---|---|---|
| 1 year 6 months | 1.5 | 30% | 19.11% |
| 2 years 6 months | 2.5 | 30% | 11.07% |
| 3 years 3 months | 3.25 | 30% | 8.41% |
Cite this table: PositionalCalls, “CAGR for part-year holding periods”; arithmetic by PositionalCalls.
Is a short holding period misleading?
It can be. Annualising a gain made over a few months into a yearly rate assumes the same pace for a full year, which rarely happens. Use the CAGR calculator for periods of a year or more and read very short periods as absolute returns instead, a point Angel One makes when it says absolute return is more relevant for shorter periods.
Can I use it for business numbers such as revenue?
Yes. CAGR works for any quantity that grows over time. If a company’s revenue rose from a hypothetical Rs 100 crore to Rs 180 crore over four years, the CAGR is 15.83%, my calculation. Petpooja’s calculator page also describes using it for business metrics. The number says nothing about the quality of the growth.
When should I use XIRR instead of a CAGR calculator?
Use CAGR for one beginning value and one ending value, and XIRR when money goes in or out on several dates. Munim and Angel One say XIRR suits monthly SIPs, and Upgrowth says CAGR works for single lump-sum investments only. The table sets out the three measures.
| Measure | Best for | Needs | Weakness |
|---|---|---|---|
| Absolute return | Short or equal periods | Start and end values | Ignores time |
| CAGR | One lump sum held for years | Start value, end value, years | Ignores timing of extra cash flows |
| XIRR | SIPs and irregular cash flows | Each amount and its date | Needs a dated list of every flow |
Cite this table: PositionalCalls, “Absolute return, CAGR and XIRR”; points from Munim, Angel One, Upgrowth and Rupee Rubric.
Can I use the CAGR calculator for a SIP?
Only as a rough check on the total, because the instalments were invested for different lengths of time. If you want to estimate what a SIP could be worth for an assumed return, the SIP calculator does that. For a return actually achieved on a SIP, a dated cash-flow tool such as XIRR is the right measure. For a corpus you are drawing down rather than building, the SWP calculator shows how long a monthly withdrawal lasts at an assumed return.
What does a CAGR calculator leave out?
The calculator uses only two values and the time between them, so it leaves out everything that happened on the way. The table lists what is missing and how to handle it.
| Left out | Why it matters | What to do |
|---|---|---|
| Volatility and risk | Two funds can share a CAGR and differ widely in swings | Look at the path, not only the rate |
| Extra cash flows | Added or withdrawn money breaks the single-start assumption | Use XIRR |
| Tax | A pre-tax CAGR overstates what you keep | Use the post-tax ending value |
| Charges | Brokerage and fund costs reduce the ending value | Use the net ending value |
| Inflation | A nominal rate overstates buying power | Work out the real CAGR |
Cite this table: PositionalCalls, “What a CAGR calculator leaves out”; points from Angel One, Belong and Munim as named in the sources.
How do I include tax?
Replace the ending value with the amount you would keep after tax, as Belong suggests, and the CAGR calculator then shows an after-tax rate. For listed equity and equity-oriented funds, the rates in FY 2026-27 are 20% within 12 months and 12.5% above Rs 1.25 lakh after that, plus 4% cess, per the TaxGuru and Sahi guides cited on this site. The capital gains tax calculator works out the tax.
Is a high CAGR a sign of a good investment?
Not by itself. A CAGR describes a period, so it depends on the start and end dates, and a period that begins at a low point shows a high rate. The CAGR calculator gives the number, and judging whether it is good needs the risk, the period and the alternatives, none of which the number includes.
Where do rules of thumb and sources differ on CAGR?
The formula is the same everywhere, but shortcuts and use-cases differ. The table lists three places where two views give different answers or advice, and how this page treats each.
| Item | View A | View B | What the page does |
|---|---|---|---|
| Time to double at 12% | 6.0 years (rule of 72) | 6.12 years (exact) | Shows the exact figure |
| Average of yearly returns | 10% (simple average of +50% and −30%) | 2.47% (CAGR) | Uses CAGR |
| CAGR for a SIP | Works for one lump sum only (Upgrowth, Munim) | Tapetide says CAGR and XIRR match for a one-time investment | Uses CAGR for a lump sum and points to XIRR for a SIP |
Cite this table: PositionalCalls, “CAGR shortcuts and views”; arithmetic by PositionalCalls; sources as named.
What should I check before relying on any CAGR figure?
- That the beginning and ending values are on the same basis, both before or both after tax.
- That the years count the actual holding period.
- That there were no extra deposits or withdrawals in between.
- Whether the figure is nominal or real.
- The risk taken to earn it.
What is this page not for?
It does not tell you what to buy, sell or hold. PositionalCalls is not a SEBI-registered research analyst or investment adviser, and I am not a chartered accountant. The CAGR calculator applies arithmetic to numbers you supply, and investments are subject to market risks.
PositionalCalls WhatsApp channel
Investing tools in one channel
- Rule changes, dated
- Tools without tips
- Links to new guides
CAGR calculator: frequently asked questions
How does a CAGR calculator work?
A CAGR calculator divides the ending value by the beginning value, raises the result to the power of one divided by the years, and subtracts 1, per 5paisa. Rs 1,00,000 growing to Rs 2,00,000 in 5 years gives 14.87% a year, which Tata Capital also shows. The CAGR calculator turns a total gain into a smooth yearly rate.
What is the CAGR formula?
CAGR = (Ending value ÷ Beginning value)^(1 ÷ n) − 1, where n is the number of years, per Angel One and 5paisa. For Rs 5,00,000 becoming Rs 11,00,000 over 8 years, 5paisa shows about 10.36%, and the CAGR calculator on this page gives the same result.
What is the difference between CAGR and absolute return?
Absolute return is the total percentage gain over the whole period and ignores time, as Upgrowth explains. CAGR spreads that gain over the years with compounding. A 100% absolute return is 41.42% a year over 2 years and 7.18% a year over 10 years, my calculation, so the CAGR calculator makes different periods comparable.
Can I use a CAGR calculator for a SIP?
Not accurately. Munim and Angel One say XIRR suits monthly SIPs because money goes in on different dates, while CAGR assumes one beginning value and one ending value. Use the CAGR calculator for a single lump sum, and use the SIP calculator on this site to estimate a SIP value from an assumed return.
Does CAGR show the risk of an investment?
No. Angel One notes that CAGR does not show volatility, risk or the path an investment took to reach its final value. A fund that rose 50% and then fell 30% has a CAGR of 2.47% over the two years, my calculation, and the CAGR calculator cannot show that swing.
How do I find how long it takes to reach a target?
Use the years-needed mode of the CAGR calculator. Years = ln(target ÷ start) ÷ ln(1 + CAGR). Rs 1 lakh needs about 20.32 years to reach Rs 10 lakh at 12% a year, my calculation. The rule of 72 gives about 6 years to double at 12%, against 6.12 exactly.
Is a negative CAGR possible?
Yes. If the ending value is below the beginning value, the result is negative. Rs 1,00,000 falling to Rs 50,000 in 2 years is a CAGR of −29.29% a year, my calculation. A negative CAGR means the value shrank by that rate on average each year, and the CAGR calculator shows it with a minus sign.
Should I calculate CAGR before or after tax?
Use the value you actually keep. Belong suggests replacing the ending value with the post-tax amount to get an after-tax CAGR. The CAGR calculator works on any two values you enter, so test both. The capital gains tax calculator on this site estimates tax on shares and mutual funds.
What CAGR is good?
There is no fixed answer, and a CAGR of any period is a past or assumed figure, not a forecast. Compare it with inflation and with the risk taken. A 12% nominal CAGR at 6% inflation is a real return of about 5.66%, my calculation,.
Is this CAGR calculator advice to buy or sell anything?
No. PositionalCalls is not a SEBI-registered research analyst or investment adviser, and I am not a chartered accountant. The calculator applies arithmetic to the values you enter. It gives no fund, stock, subscribe, avoid, buy, sell or target view, and it does not replace your own goals.
Sources for the CAGR calculator
- 5paisa: CAGR calculator, broker.
- Tata Capital: CAGR in mutual, broker.
- Angel One: what is CAGR, broker.
- FundsIndia: CAGR calculator, broker.
- Upgrowth: CAGR to XIRR, tool.
- Munim: CAGR calculator, broker.
- Rupee Rubric: CAGR calculator, tool.
- Belong: how to calculate, broker.
- Tapetide: CAGR calculator, tool.
- IIFL: CAGR calculator, broker.
- TaxGuru: equity STCG and, tax.
- Sahi: LTCG tax, Budget, broker.
- Not opened: fund factsheets, scheme documents and the Income-tax Act; the formula and statements are from the sources above.
PositionalCalls.com is an independent research site founded by Shubham Chaudhary. PositionalCalls.com is not a SEBI-registered research analyst or investment adviser. Investments in securities markets are subject to market risks. Read all related documents carefully before investing. Returns are never guaranteed. This page is educational and publishes no subscribe, avoid, buy, sell, rating or target calls. Sources: calculator, broker and tax pages as named; no factsheet or scheme document opened; no fund, buy, sell or avoid view given. I am not a chartered accountant.

Shubham Chaudhary is the founder of PositionalCalls, an independent Indian stock market research website. He writes company fundamentals, quarterly results analysis, IPO analysis and sector research for NSE and BSE listed companies, with a focus on banking stocks, insurance and long-term value investing. Every article is built from primary sources such as RBI, SEBI, NSE and BSE filings and company annual reports, and states its risks plainly in simple language for retail investors.
Coverage areas Our research standards- Numbers checked against NSE, BSE and SEBI filings
- Risks and limits stated in every article
- No paid promotions or broker tie-ups
- Articles updated when new filings arrive