
Banking · Bank of Baroda
In the Bank of Baroda Q2 results, a record profit hides slower core earnings, a lower margin and a weak first half. Here is what drove the number and what to watch next.
Quick answer
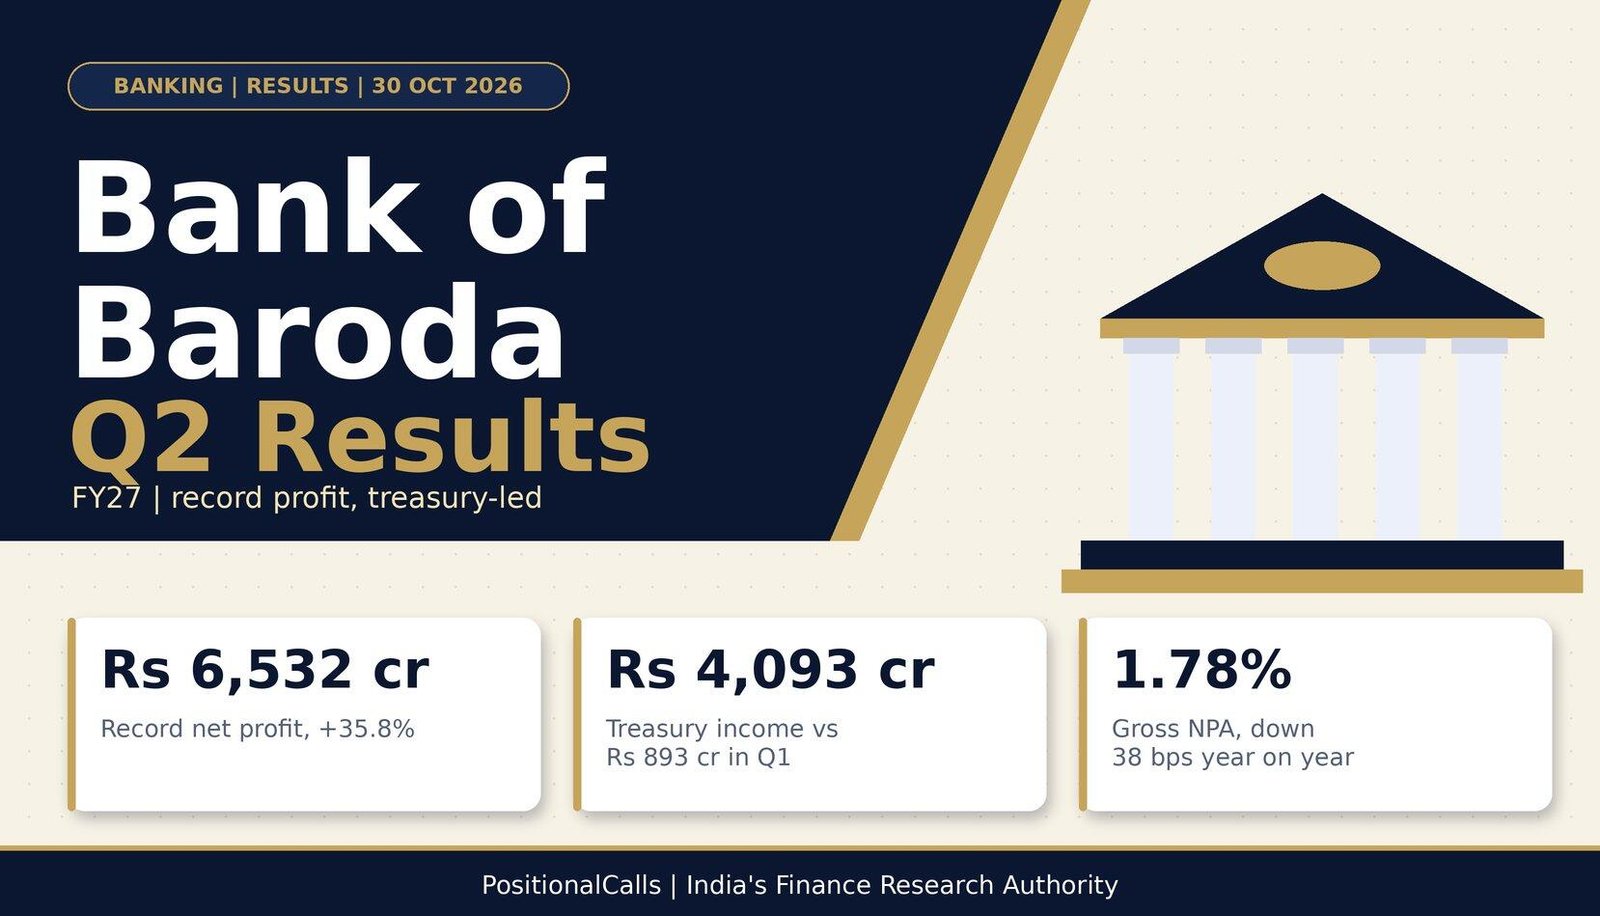
Bank of Baroda Q2 results: Bank of Baroda reported a record standalone net profit of Rs 6,532 crore (+35.8%) for the quarter ended 30 September 2026. Net interest income rose 9% to Rs 13,026 crore, but treasury income of Rs 4,093 crore, linked to NSE share-sale gains, drove the jump. Gross NPA fell to 1.78% and NIM to 2.74%.
Latest update (Wednesday, 4 November 2026, 5:30 PM IST): Bank of Baroda reported on Friday, 30 October 2026, and the stock reacted on Monday, 2 November 2026. A confirmed closing price after 2 November and the Q3 FY27 results date were not found as of the time above.
Key takeaways
- Profit: Rs 6,532 crore, up 35.8%, the highest quarterly profit on record.
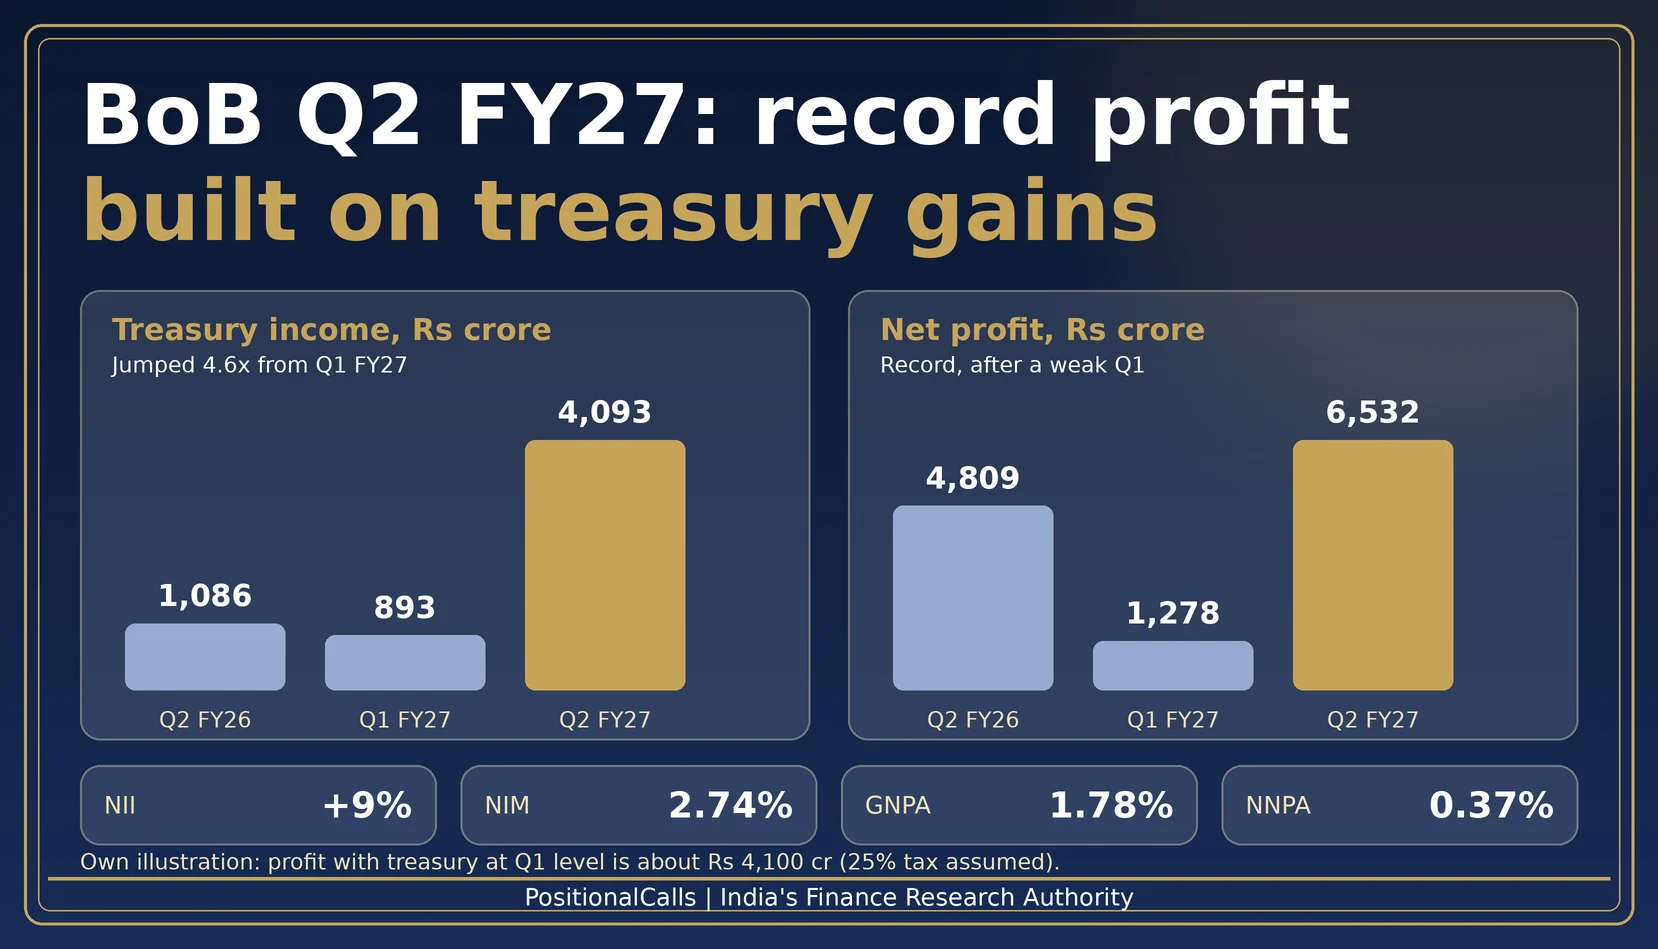
- Source: treasury income Rs 4,093 crore against Rs 893 crore in Q1.
- Core: NII +9% to Rs 13,026 crore; NIM 2.74%, down from 2.96%.
- Quality: gross NPA 1.78%, net NPA 0.37%, CRAR 16.61%.
- Half-year: H1 profit Rs 7,810 crore, down 16.5%.
- Watch: reports use NII for two different lines.
In plain words: NII is net interest income, the gap between interest earned and interest paid. NIM is that gap as a share of earning assets. GNPA and NNPA are gross and net bad loans as a share of loans. A basis point (bps) is one hundredth of a percentage point.
Data note: as of Wednesday, 4 November 2026, 5:30 PM IST. Figures are standalone and come from news reports of the bank’s results, not from the filing itself. One source shows NIM at 2.76% and others at 2.74%. Share prices are from 2 November 2026.
Bank of Baroda Q2 results FY27: what are the key numbers?
Bank of Baroda reported a standalone net profit of Rs 6,532 crore for the quarter ended 30 September 2026, up 35.8% from Rs 4,809 crore and its highest quarterly profit ever. The board approved the numbers on Friday, 30 October 2026. Most of the jump came from non-interest income, which almost doubled, not from the core lending business. That is the central point of the Bank of Baroda Q2 results.
| Metric (standalone) | Q2 FY27 | Q2 FY26 | Change | Why it matters |
|---|---|---|---|---|
| Net profit | Rs 6,531.54 cr | Rs 4,809.39 cr | +35.8% | Record, but boosted by a one-time-type gain |
| Net interest income (NII) | Rs 13,026 cr | about Rs 11,954 cr | +9% | The steady core earnings line |
| Non-interest income | Rs 6,881 cr | about Rs 3,510 cr (derived) | +96% | Drove the profit jump |
| Treasury income | Rs 4,093 cr | Rs 1,086 cr | +277% | Linked to the NSE share sale |
| Gross NPA ratio | 1.78% | 2.16% | -38 bps | Cleaner book |
| Net NPA ratio | 0.37% | 0.57% | -20 bps | Lower stress after provisions |
Cite this table: PositionalCalls, “Bank of Baroda Q2 FY27 key numbers, as of 4 November 2026”.
Data note: figures are standalone and as reported by Business Standard, JM Financial and PSU Connect between 30 October and 2 November 2026. I have not opened the exchange filing. The year-ago non-interest income is derived by me from the reported 96% growth.
Where did Bank of Baroda’s record profit come from?
In the Bank of Baroda Q2 results, the record profit came mainly from treasury income of Rs 4,093 crore, which Business Standard links to the sale of part of the bank’s NSE shares during the exchange’s IPO. Treasury income was Rs 1,086 crore a year ago and Rs 893 crore in the previous quarter.
Non-interest income rose about 96% to Rs 6,881 crore. Operating profit, which is profit before provisions and tax, jumped 50.9% to Rs 11,430 crore against about Rs 8,127 crore in Q1 FY27. If treasury income had stayed near its Q1 level of Rs 893 crore, operating profit would have been roughly Rs 8,230 crore. That is my own rough calculation (Rs 11,430 crore less the Rs 3,200 crore treasury step-up), and it shows operating profit would have been close to Q1 instead of 40% higher.
| Scenario (own illustration) | Pre-tax change | Net profit (Rs cr) | Versus Q2 FY26 (Rs 4,809 cr) |
|---|---|---|---|
| Reported | none | 6,532 | +35.8% |
| Treasury income at Q1 FY27 level (Rs 893 cr) | -3,200 | about 4,130 | about -14% |
| Treasury income at Q2 FY26 level (Rs 1,086 cr) | -3,007 | about 4,280 | about -11% |
| Q1 level, and Rs 1,600 cr prudential provision added back | -1,600 net | about 5,330 | about +11% |
Cite this table: PositionalCalls, “Bank of Baroda Q2 FY27 profit scenarios, as of 4 November 2026”.
Assumptions: a flat 25% tax rate on every adjustment and no other line changing. This is an illustration to show scale, not a forecast and not the bank’s adjusted profit. Treasury income is not entirely one-off, so the real underlying figure sits somewhere between the reported and the lower rows.
In plain words: the bank earned a record profit mainly because it sold part of its holding in the stock exchange. That gain is large, but it cannot be repeated every quarter.
How strong are Bank of Baroda’s core earnings?
In the Bank of Baroda Q2 results, core earnings grew steadily but slowly: NII rose 9% and the net interest margin fell to 2.74%. Core fee income actually declined 9%, according to JM Financial.
| Core line | Q2 FY27 | Q1 FY27 | Q2 FY26 |
|---|---|---|---|
| Net interest income | Rs 13,026 cr | Rs 12,524 cr | about Rs 11,954 cr |
| Global NIM | 2.74% | 2.77% | 2.96% |
| Domestic NIM | 2.89% | 2.93% | 3.10% |
| Interest income | Rs 35,085 cr (+11%) | not found | not found |
| Interest expended | Rs 22,059 cr (+13%) | not found | not found |
Cite this table: PositionalCalls, “Bank of Baroda Q2 FY27 core earnings, as of 4 November 2026”.
Interest expense grew faster than interest income, 13% against 11%, which is why margin shrank. Net interest margin is the gap between what a bank earns on loans and pays on deposits, expressed as a share of earning assets. A fall of 22 bps over a year on a balance sheet this large is material. Cost of deposits was 4.66% in Q1 FY27, down 39 bps from a year earlier, so the squeeze is coming from lower loan yields, not higher deposit costs.
Motilal Oswal relayed management’s expectation of NIM in a 2.75% to 2.95% range with a bias to the upper end. Q2 at 2.74% is just below the bottom of that band. One source gives 2.76% for the same quarter, so I use 2.74%, which Business Standard also reports as a 3 bps fall from Q1.
Why is H1 profit down 16.5% when Q2 is a record?
Because Q1 FY27 profit was only Rs 1,278 crore after heavy provisions, so half-year profit of Rs 7,810 crore is still 16.5% below last year’s Rs 9,351 crore. A record quarter does not mean a record half-year.
| Period | Net profit | Operating profit | Non-interest income | Comment |
|---|---|---|---|---|
| Q2 FY27 | Rs 6,532 cr | Rs 11,430 cr | Rs 6,881 cr | Record, NSE-linked gain |
| Q1 FY27 | Rs 1,278 cr | Rs 8,127 cr | Rs 3,470 cr | Weak, provisions heavy |
| H1 FY27 | Rs 7,810 cr (-16.5%) | Rs 19,557 cr (+23.7%) | Rs 10,351 cr (+26.4%) | Profit down, operations up |
| H1 FY26 | Rs 9,351 cr | Rs 15,812 cr | Rs 8,189 cr | Base |
Cite this table: PositionalCalls, “Bank of Baroda H1 FY27 versus H1 FY26, as of 4 November 2026”.
One report attributes the gap to an other-provision charge of Rs 6,073 crore in H1 FY27, which outweighed the growth in NII and operating profit. That figure comes from a single source, so I treat it as indicative. Motilal Oswal says the bank made additional prudential provisions of about Rs 1,600 crore in Q2 and holds a floating provision of about Rs 2,500 crore, which will help in the move to expected-credit-loss (ECL) provisioning.
In plain words: ECL provisioning means setting aside money for losses that are expected, not only for losses that have already happened. Banks have been preparing for this shift, and building buffers early reduces future shocks.
Definition trap: some reports use the letters NII for both net interest income and non-interest income. In this post NII always means net interest income, and the other line is called non-interest income.
PositionalCalls WhatsApp channel
Get bank results alerts first
- Bank of Baroda, SBI and peer results in plain language
- Fast updates when filings or dates change
- Treasury, NIM and NPA decoders for every bank result
Has Bank of Baroda’s asset quality really improved?
Yes. In the Bank of Baroda Q2 results, gross NPA fell to 1.78% and net NPA to 0.37%, both better than a year ago and the previous quarter. Capital adequacy stood at 16.61%.
| Ratio | Q2 FY27 | Q1 FY27 | Q2 FY26 | Change vs year ago |
|---|---|---|---|---|
| Gross NPA | 1.78% | about 1.99% | 2.16% | -38 bps |
| Net NPA | 0.37% | about 0.50% | 0.57% | -20 bps |
| Capital adequacy (CRAR) | 16.61% | not found | 16.26% (Q2 FY25 per one summary) | not comparable |
Cite this table: PositionalCalls, “Bank of Baroda Q2 FY27 asset quality, as of 4 November 2026”.
Q1 FY27 ratios are derived from the reported quarter-on-quarter changes of 21 bps (gross) and 13 bps (net). Provision coverage was not found in the reports I reviewed, so I have not shown it. The year-ago CRAR figure in the table is from a different year and is shown only for reference.
Lower NPAs plus extra provisions is a sensible combination. The bank used part of its gain to build buffers instead of reporting it all as profit, which is why the profit scenario above adds the prudential provision back separately.
How fast are Bank of Baroda’s loans and deposits growing?
The Bank of Baroda Q2 results show loans up 18% year on year and deposits up 16%, but a large part came from FCNR(B) deposits and loans leveraged against them. Excluding that, loan and deposit growth was 13.5% year on year.
FCNR(B) deposits are foreign-currency fixed deposits that NRIs can hold with Indian banks. Business Standard reports leverage of about Rs 60,500 crore against these deposits (the report shows Rs 605 billion). Management raised its credit growth guidance for FY27 to 13-15%, according to Motilal Oswal.
| Growth line | Reported | Excluding FCNR(B) |
|---|---|---|
| Loans, year on year | 18% | 13.5% |
| Deposits, year on year | 16% | 13.5% |
| Deposits, quarter on quarter | 7% | 11.2% as reported |
| FY27 credit growth guidance | 13-15% (raised) | not applicable |
Cite this table: PositionalCalls, “Bank of Baroda Q2 FY27 growth, as of 4 November 2026”.
A Business Standard headline dated 29 October 2026 says new RBI forex derivative norms will raise FCNR(B) hedging costs for banks. I have not read that article, so I do not rely on it here, but it is a point to follow because FCNR(B)-linked lending helped growth this quarter. For NRI readers, our NRI investment in the Indian stock market guide explains the account types.
Bank of Baroda Q2 FY27 vs Q1 FY27 vs Q2 FY26: the full table
The three-quarter view of the Bank of Baroda Q2 results shows a strong Q2 sandwiched between a weak Q1 and a flat year-ago base. The table puts the main lines side by side.
| Line | Q2 FY27 | Q1 FY27 | Q2 FY26 |
|---|---|---|---|
| Net profit | Rs 6,532 cr | Rs 1,278 cr | Rs 4,809 cr |
| NII | Rs 13,026 cr | Rs 12,524 cr | Rs 11,954 cr |
| Non-interest income | Rs 6,881 cr | Rs 3,470 cr | not found |
| Treasury income | Rs 4,093 cr | Rs 893 cr | Rs 1,086 cr |
| Global NIM | 2.74% | 2.77% | 2.96% |
| Gross NPA | 1.78% | about 1.99% | 2.16% |
| Return on assets | not found | not found | 1.07% |
Cite this table: PositionalCalls, “Bank of Baroda three-quarter comparison, as of 4 November 2026”.
Last year’s Q2 profit of Rs 4,809 crore was itself down 8% from the year before, so the 35.8% growth is measured against a low base. Return on assets for Q2 FY26 was 1.07% and return on equity 15.37%. One brokerage view is that a return on assets of 0.95% to 1% is sustainable, which is below what a record-profit quarter would suggest.
Bank of Baroda shares rose as much as 5% to an intraday high of Rs 250.89 on Monday, 2 November 2026, then pared gains to Rs 244.75, up 2.6%, by 12:30 PM IST. The stock opened at Rs 243 on the NSE and more than 12.5 million shares traded by midday.
The pre-results close works out to about Rs 238.5 by my calculation from the reported percentage move. For comparison, the stock closed at Rs 278.30 on the BSE on 31 October 2025, so the share is roughly 12% lower than a year ago on different exchanges and dates. A confirmed closing price after 2 November 2026 was not found as of Wednesday, 4 November 2026, 5:30 PM IST.
Motilal Oswal raised its FY27 and FY28 earnings estimates by 15% and 4% respectively, citing strong treasury gains. That is one reported estimate change; I do not publish ratings or price targets, because PositionalCalls.com is not a SEBI-registered research analyst or investment adviser.
How to read the Bank of Baroda Q2 results: a decoder table
Look past the headline to six lines: NII growth, NIM, fee income, treasury income, NPAs and provisions. The table gives the mark to compare against and the question to ask.
| What to read | Mark to compare | Q2 FY27 | Question to ask |
|---|---|---|---|
| NII growth | 9.5% in Q1 FY27 | 9% | Can it re-accelerate as loan yields stabilise? |
| Global NIM | 2.75-2.95% (as relayed) | 2.74% | Does margin move into the guided band? |
| Core fee income | flat | -9% | Why did fees fall in a growth quarter? |
| Treasury income | Rs 893 cr (Q1) | Rs 4,093 cr | How much repeats in Q3? |
| Gross NPA | 2.16% a year ago | 1.78% | Is the fall from recoveries or write-offs? |
| Credit growth | 13-15% guidance | 18% reported | What is growth excluding FCNR(B)? |
Cite this table: PositionalCalls, “Bank of Baroda results decoder, as of 4 November 2026”.
Peer banks to compare: our SBI Q2 results preview, Bajaj Finance Q2 results and older bank posts on HDFC Bank, ICICI Bank and Axis Bank. For the exchange gain, see our NSE results and IPO path explainer, and for dates use the Q2 results calendar.
For shareholders, the number to watch is not the record profit but how much of it repeats. For depositors, asset quality and capital adequacy of 16.61% matter more than quarterly profit.
- What you need: nothing to act on. This is an analysis, not a call to buy or sell.
- Dividend: I found no interim dividend announcement in the reports reviewed. Check the exchange filing for any corporate action.
- Tax angle: if you hold the shares, gains and dividends follow the rules in our capital gains tax on shares guide. Confirm current rates with an adviser.
- NRI note: FCNR(B) deposits are part of the growth story. See the NRI guide above for account types.
- Scam warning: fake SMS and WhatsApp messages about bank results, dividends and KYC are common. Verify only on the bank’s official site and exchange announcements.
What most people miss in the Bank of Baroda Q2 results
What to watch next, and a checklist
After the Bank of Baroda Q2 results, the Q3 FY27 results date has not been confirmed as of Wednesday, 4 November 2026, 5:30 PM IST. I will update this page when the board meeting is announced.
- Whether treasury income returns to the Rs 900 crore to Rs 1,100 crore range.
- NIM movement against the 2.75% to 2.95% guidance.
- Fee income recovery after a 9% fall.
- Further prudential and floating provisions as ECL transition approaches.
- FCNR(B) lending trends and any change in hedging costs.
- Any exchange filing on dividends or capital raising.
Your own checklist:
- I have read the bank’s exchange filing and press release myself.
- I know which NII a headline means.
- I have separated treasury gains from core earnings.
- I have checked the live share price.
- I am not relying on one outlet’s figure for NIM, which varies between 2.74% and 2.76%.
Analyst’s note
The points below are my reasoning from the reported numbers. They are not a recommendation.
- What stands out: a record headline built on a one-time-type gain, with core earnings growing at 9%.
- Easy to miss: half-year profit is down 16.5%, so the record quarter followed a very weak one.
- What would change the view: treasury income staying elevated, or NIM moving back above 2.8%.
- Caution: asset quality is improving, but extra provisions suggest management is cautious.
- Reader action: compare operating profit with and without treasury, using the scenario table above.
Bottom line
Bottom line
The Bank of Baroda Q2 results show a record Rs 6,532 crore profit, but treasury income of Rs 4,093 crore did the heavy lifting. Core NII grew 9%, margin slipped to 2.74%, and asset quality improved. Half-year profit is still 16.5% lower.
Next read: SBI Q2 results for the largest public sector bank, or the Q2 results calendar.
Part of the Banking series under Earnings coverage. Last year’s quarter is covered in our Bank of Baroda Q3 results post.
PositionalCalls WhatsApp channel
Follow the rest of the Q2 results season
- Daily results calendar with confirmed and tentative dates
- Profit-quality checks, not just headline numbers
- New tax and banking explainers as they publish
Bank of Baroda Q2 results FAQs
What was Bank of Baroda’s net profit in the Bank of Baroda Q2 results?
Bank of Baroda reported a standalone net profit of Rs 6,532 crore for Q2 FY27, up 35.8% from Rs 4,809 crore and the bank’s highest quarterly profit.
When were the Bank of Baroda Q2 results announced?
The board approved the Q2 FY27 results on Friday, 30 October 2026, for the quarter and half-year ended 30 September 2026.
Why did Bank of Baroda profit rise 35.8% in the Bank of Baroda Q2 results?
Mainly because non-interest income rose about 96% to Rs 6,881 crore, with treasury income of Rs 4,093 crore linked to the sale of part of its NSE shares.
What is Bank of Baroda’s net interest margin?
Global NIM was 2.74% in Q2 FY27, down from 2.96% a year ago and 2.77% in Q1. Domestic NIM was 2.89%.
What is Bank of Baroda’s gross NPA in Q2 FY27?
Gross NPA was 1.78%, against 2.16% a year earlier, and net NPA was 0.37%, against 0.57%.
Why is Bank of Baroda’s H1 profit lower than last year?
H1 FY27 profit was Rs 7,810 crore, down 16.5% from Rs 9,351 crore because Q1 FY27 profit was only Rs 1,278 crore after heavy provisions.
How much did Bank of Baroda’s NII grow?
Net interest income grew 9% to Rs 13,026 crore. Do not confuse it with non-interest income, which some reports also abbreviate as NII.
How fast are Bank of Baroda’s loans growing?
Loans grew 18% year on year, or 13.5% excluding FCNR(B)-linked lending. Management guides FY27 credit growth of 13-15%, as relayed by Motilal Oswal.
The stock hit an intraday high of Rs 250.89, up over 5%, on 2 November 2026 and traded at Rs 244.75 by 12:30 PM IST.
Did Bank of Baroda announce a dividend with Q2 FY27 results?
I found no dividend announcement in the reports reviewed. Check the exchange filing for any corporate action before relying on this.
Sources
- Bank of Baroda Q2 FY27 results and press release on the NSE and BSE announcement pages (primary; to be checked by the reader).
- Business Standard, “Bank of Baroda gains 5% on record profit in Q2; here’s what brokerages say”, 2 November 2026.
- Business Standard Hindi, Bank of Baroda Q2 FY27 results report, 30 October 2026.
- JM Financial market news, 31 October 2026.
- PSU Connect, “Bank of Baroda Q2 net profit jumps 36% to Rs 6,532 cr”, October 2026.
- Kotak Neo, Bank of Baroda Q1 FY27 result, 25 July 2026.
- Indian Masterminds and Quartr results summaries for Q2 FY27 and Q2 FY26.
Editorial disclosure: PositionalCalls.com is an independent research and education site founded by Shubham Chaudhary. PositionalCalls.com is not a SEBI-registered research analyst or investment adviser. Investments in securities markets are subject to market risks. Read all related documents carefully before investing. Returns are never guaranteed. How I researched this: I read the bank’s results as reported by Business Standard, JM Financial and PSU Connect, compared figures across sources, recalculated every derived number shown as my calculation, and listed disagreements instead of choosing the more exciting number.

Shubham Chaudhary is the founder of PositionalCalls, an independent Indian stock market research website. He writes company fundamentals, quarterly results analysis, IPO analysis and sector research for NSE and BSE listed companies, with a focus on banking stocks, insurance and long-term value investing. Every article is built from primary sources such as RBI, SEBI, NSE and BSE filings and company annual reports, and states its risks plainly in simple language for retail investors.
Coverage areas Our research standards- Numbers checked against NSE, BSE and SEBI filings
- Risks and limits stated in every article
- No paid promotions or broker tie-ups
- Articles updated when new filings arrive