


Earnings Analysis · NBFC · Q2 FY27
Bajaj Finance Q2 Results FY27: Profit Growth, AUM Expansion and the Risks Investors Should Watch
Bajaj Finance reported strong year-on-year growth in profit, net interest income and assets under management for the September 2026 quarter. The deeper question is whether growth can continue while credit costs, capital requirements and regulatory uncertainty remain controlled.
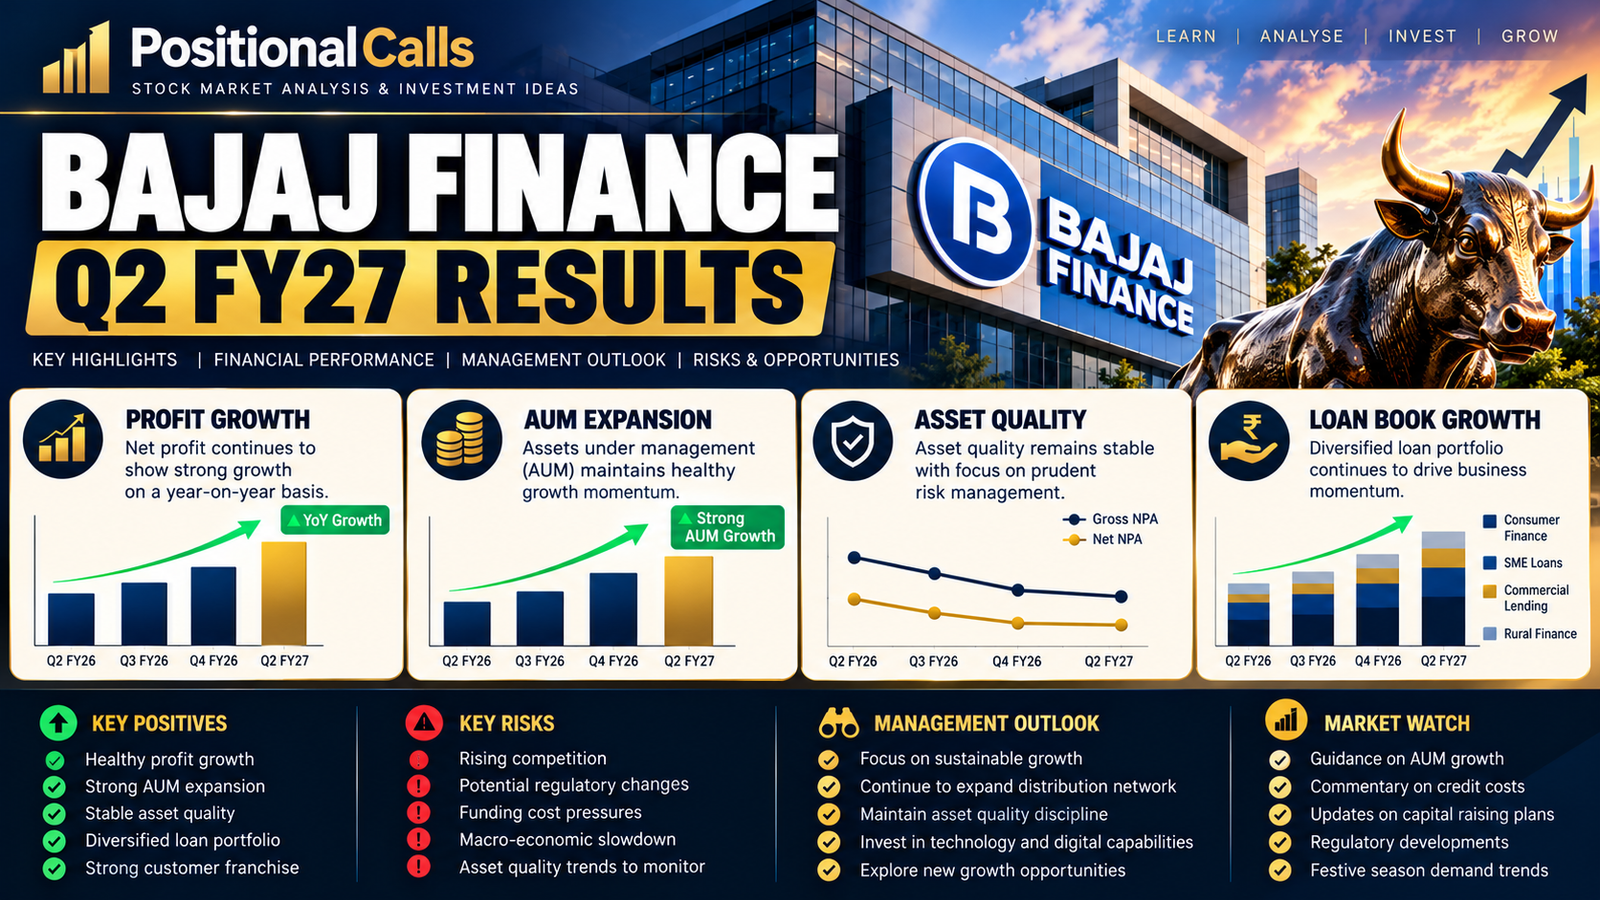
Bajaj Finance’s Q2 FY27 results present a combination investors need to examine carefully: rapid earnings growth, a larger loan book and improved headline non-performing asset ratios, alongside questions about provisions, specific lending segments, capital raising and the regulatory environment. The company reported consolidated net profit of approximately ₹6,367 crore, up about 29% year on year, while net interest income increased 24% to ₹13,335 crore. Assets under management (AUM) reached approximately ₹5.85 lakh crore, up around 26%.
These are strong headline growth rates. They do not, on their own, prove that the stock is attractively valued or that future credit costs will remain low. A lender’s long-term economics depend on the return earned on its loan book after funding costs, operating expenses, provisions and the capital required to support expansion.
This article separates reported operating performance from interpretation. Figures should be checked against the company’s official results and investor presentation before publication or reuse. Contemporary coverage from Business Standard and Financial Express provides additional context. The official company source is its investor-relations financial results page.
Key Takeaways
- Consolidated net profit was reported at approximately ₹6,367 crore, up about 29% year on year.
- Net interest income rose 24% to ₹13,335 crore and AUM grew around 26% to approximately ₹5.85 lakh crore.
- Reported gross and net NPA ratios improved year on year, but investors should also assess Stage 2/Stage 3 assets, provisions and segment-level credit costs.
- Loan losses and provisions included an additional management and macroeconomic provision; the reported total and any adjusted figure must be distinguished.
- Proposed capital raising, regulatory developments and the valuation paid for the shares remain important parts of the investment case.
Bajaj Finance Q2 FY27 Results: Key Financial Numbers
The following table summarises figures reported in coverage of the quarter. Confirm every number against the company’s official financial statements and investor presentation before using it as a definitive filing-based figure.
| Metric | Reported Q2 FY27 figure | Context |
|---|---|---|
| Consolidated net profit | Approximately ₹6,367 crore | Up about 29% year on year |
| Net interest income (NII) | ₹13,335 crore | Up 24% year on year |
| Net total income | ₹15,974 crore | Up approximately 23% year on year |
| Assets under management | Approximately ₹5.85 lakh crore | Up around 26% year on year |
| New loans booked | 13.45 million | Up 11%; festive-season timing affects comparability |
| Customers added during quarter | 4.42 million | Total customer franchise reported at 128.85 million |
| Gross NPA ratio | 1.06% | Reported lower than the year-ago level of 1.24% |
| Net NPA ratio | 0.42% | Reported lower than the year-ago level of 0.60% |
| Loan losses and provisions | Approximately ₹2,166 crore | Included an additional ₹337 crore management and macroeconomic provision, as reported |
Source note: reported figures from results coverage published on 19 October 2026. Confirm consolidated/standalone basis, definitions and exact amounts in the official company filing. Values rounded for readability.
1. Profit Growth: Strong Numbers Need a Quality Check
A roughly 29% year-on-year increase in consolidated net profit is a meaningful result, but the headline alone does not explain the drivers. Investors should examine the relationship between net interest income, operating expenses, credit costs, tax and the growth of the loan book.
Net interest income is the difference between interest income earned on loans and other interest-bearing assets and the interest expense paid on funding. It is central to a lender’s earnings power. NII growth can reflect an expanding loan book, changes in lending yields, a shift in product mix or lower funding costs. Each driver has different implications for sustainability.
If NII consistently grows faster than AUM, investors should investigate whether yields or funding economics are improving. If NII growth trails AUM growth, possible explanations include pricing competition, a changing portfolio mix or higher funding costs. Neither relationship should be interpreted without checking the detailed disclosures.
Net profit is the residual after a wider set of expenses and provisions. A lender may expand NII but still face pressure from operating costs, credit losses or funding conditions. The quality question is whether growth in core income can translate into durable earnings without an unacceptable increase in risk.
2. AUM Growth: Scale Is Useful Only When Returns Hold Up
AUM was reported at approximately ₹5.85 lakh crore at the end of September 2026, an increase of around 26% year on year. A larger loan book can support future interest income, customer relationships and product distribution. It also requires funding, operational capacity, risk controls and regulatory capital.
Measure incremental profitability
Every new loan should be assessed on the income it generates after funding costs, expected losses, servicing expenses and capital consumption. Rapid growth can create value when underwriting is disciplined and pricing reflects risk. Growth can destroy value if it is won through weak pricing or relaxed credit standards.
Review portfolio mix
Consolidated AUM can conceal differences between lending segments. Investors should examine product-level growth, ticket size, borrower profiles and the performance of newer loan vintages. A segment expanding rapidly may have different loss patterns from a mature portfolio.
Track funding efficiency
Expansion depends on access to deposits and other funding sources at sustainable costs. Higher funding costs can compress margins even when disbursements and AUM rise. Investors should review the liability mix, maturity profile, liquidity position and capital adequacy alongside loan growth.
3. Asset Quality: Headline NPAs Improved, but Keep Looking
The reported gross NPA ratio declined to 1.06% from 1.24% a year earlier, while the net NPA ratio declined to 0.42% from 0.60%. On the reported comparison, this is encouraging. It is not sufficient evidence that credit risk has permanently declined.
NPA ratios can move because impaired loans change, the total loan book expands, recoveries improve, accounts are written off or the portfolio mix changes. Investors should therefore look beyond the ratio to absolute stressed assets, Stage 2 and Stage 3 assets under the applicable accounting framework, write-offs, recoveries and segment-level credit costs.
Contemporary reporting on 21 October 2026 also described early signs of stress in short-tenor gold loans and noted an increase in Stage 2 and Stage 3 assets quarter on quarter. This does not negate the improvement in the headline year-on-year NPA ratios; it shows why portfolio-level details matter. Read the Reuters report on regulatory concerns and lending risks and compare it with the company’s disclosures.
The appropriate test is whether asset quality remains stable as loans season, economic conditions change and lending segments expand. Investors should avoid extrapolating one quarter’s improvement indefinitely.
4. Provisions and Credit Costs: Reported Versus Adjusted
Loan losses and provisions were reported at approximately ₹2,166 crore, up around 4% year on year. The total included an additional management and macroeconomic provision of approximately ₹337 crore. Reported coverage indicated that excluding this additional provision, the remaining amount was approximately ₹1,829 crore, lower than the comparable year-ago figure.
The distinction is important, but an adjusted figure must never replace the reported figure without explanation. A provision may reflect management’s attempt to build resilience against uncertain conditions. Excluding it from a comparison can help examine underlying movements, but it does not mean the expense is economically irrelevant.
Investors should read the reported amount first, then assess any adjustment on a clearly disclosed and consistently applied basis. The key questions are whether provisioning remains adequate, whether credit costs are consistent with the risk in the portfolio and whether management assumptions remain reasonable as lending expands.
Credit losses often emerge with a lag. A low current ratio is not a guarantee that future losses will stay low, particularly when the loan book is growing quickly or borrower conditions are changing.
5. Loan Volumes and Seasonality: Avoid Misreading One Quarter
The company booked 13.45 million new loans in Q2 FY27, an increase of 11% year on year. The company reportedly cautioned that the comparison was affected by an earlier start to the festive season in the previous year.
Seasonal timing can shift customer purchases, promotions and disbursements between quarters. This can make a single year-on-year growth rate less informative than it first appears. Investors should review several quarters and compare loan volumes with customer additions, average ticket size and the resulting change in AUM.
Loan count is not the same as the value of loans disbursed. A higher number of small loans can produce a different AUM outcome from a smaller number of larger loans. Product mix and repayment patterns also affect the trajectory of the loan book.
6. Customer Franchise: Size Is Not the Same as Value
Bajaj Finance reported that it added 4.42 million customers during the quarter, taking its customer franchise to 128.85 million. A large customer base can support cross-selling, repeat usage and more efficient distribution of financial products. But the customer count alone does not establish profitability or customer activity.
Investors should examine how the company defines its customer franchise, how many customers are active borrowers, how retention develops and whether customers use more than one product. Customer acquisition costs, servicing expenses, delinquency trends and contribution margins help reveal whether a growing franchise is becoming more economically valuable.
Results coverage reported proposals to raise up to ₹11,700 crore through a qualified institutional placement and up to ₹5,800 crore through warrants convertible into equity shares for promoter and holding company Bajaj Finserv, subject to applicable approvals and conditions. These proposals should not be described as completed transactions unless official disclosures confirm completion.
New capital can support lending growth, strengthen capital adequacy and provide flexibility. It can also dilute existing shareholders, depending on the final terms and number of shares issued. The correct analysis considers the purpose of the capital, its cost, timing, approvals, dilution and the returns expected from deploying the funds.
Investors should use the official exchange filing to confirm the amount, instrument, pricing, issue terms, approvals and status. A board proposal, shareholder approval and completed fundraise are different stages and should not be conflated.
8. Regulatory Risk: Separate Confirmed Rules from Potential Outcomes
Recent coverage highlighted questions relating to flexi-loan products, insurance distribution economics and potential regulatory developments. The financial effect depends on the exact regulatory action, its scope, implementation date and the company’s response. A reported concern is not automatically proof that a material financial impact has already occurred.
Investors should distinguish between a consultation or potential rule, a formal direction and a measurable effect on revenue, costs or product structure. Track official regulatory communications and the company’s exchange disclosures. If the outcome remains uncertain, the uncertainty should be stated rather than converted into a definite forecast.
Regulation can influence product design, customer disclosures, fees, distribution models and compliance costs. For a diversified lender, the impact may vary by business segment. A careful analysis identifies which parts of the business are directly exposed and avoids treating a broad headline as a complete assessment.
Markets respond to the gap between reported performance and what investors had already expected. A company can report robust growth and still see its shares decline if expectations were higher, risks remain unresolved or the valuation already reflects an optimistic outlook.
For a lender, investors may focus on credit costs, asset quality, funding costs, capital needs and regulatory uncertainty rather than the headline profit number. Broader market conditions and sector sentiment can also affect the immediate reaction.
The right interpretation is not that the market is necessarily right or wrong. The price reaction should prompt a more detailed examination of expectations, valuation and risk. A precise valuation conclusion requires verified share-price data, the appropriate share count, earnings inputs and comparable-company assumptions. This article does not invent a price target or guarantee a future return.
10. What to Monitor in the Next Quarter
- NII and margins: Determine whether income growth remains consistent with AUM growth and funding costs.
- Credit costs: Review provisions, Stage 2/Stage 3 assets, recoveries, write-offs and segment-level performance.
- Loan mix: Check whether growth is concentrated in segments with different risk or return profiles.
- Capital and liquidity: Track capital adequacy, funding mix, liquidity buffers and the status of any proposed fundraise.
- Regulatory developments: Use official updates to distinguish confirmed obligations from possible outcomes.
- Management guidance: Compare actual customer additions, loan volumes and AUM with stated expectations, accounting for seasonality.
These indicators are more useful when reviewed over multiple quarters than when treated as isolated pass-or-fail signals. The aim is to establish whether growth remains profitable and adequately funded while risk stays within acceptable limits.
11. Cross-Sector Earnings Context
Quarterly results are best interpreted in the context of each company’s business model. A lender’s key variables include credit cost, funding cost, capital adequacy and loan growth. An energy conglomerate or a paint manufacturer has a different set of drivers, including commodity exposure, demand, pricing and margins.
For a wider view of corporate performance across sectors, read our coverage of Reliance Industries Q3 Results 2026 and Asian Paints Q3 Results FY26. These are cross-sector comparisons, not direct valuation peers for Bajaj Finance.
Conclusion: Growth Is Strong; Quality and Valuation Still Decide the Case
Bajaj Finance’s Q2 FY27 results show strong reported year-on-year growth in profit, net interest income and AUM, alongside an improvement in headline NPA ratios. These are important signals of operating momentum. They do not remove the need to examine provisions, specific lending segments, funding economics, capital requirements and regulatory developments.
The investment analysis should separate three questions: Is the business expanding? Is that expansion generating sustainable risk-adjusted returns? And does the prevailing market valuation compensate investors for the remaining uncertainty? The answers require official filings, a consistent set of financial inputs and a clear distinction between reported data and interpretation.
The next quarters’ credit-cost trends, funding economics, regulatory developments and returns on capital will help investors assess whether growth is translating into durable value. No single quarterly result can settle the entire investment case.
Follow Positional Calls on WhatsApp
Get finance and market research updates through the official Positional Calls WhatsApp Channel. Use the channel to follow new analysis; always verify time-sensitive financial figures against primary disclosures.
Frequently Asked Questions
What was Bajaj Finance’s Q2 FY27 net profit?
Published results coverage reported consolidated net profit of approximately ₹6,367 crore, up about 29% year on year. Confirm the exact figure and reporting basis against the company’s official results.
How much did Bajaj Finance’s AUM grow?
AUM was reported at approximately ₹5.85 lakh crore at 30 September 2026, up around 26% year on year.
Did asset quality improve in Q2 FY27?
The reported gross NPA ratio declined to 1.06% from 1.24% a year earlier and the net NPA ratio declined to 0.42% from 0.60%. Investors should also review Stage 2 and Stage 3 assets, provisions and segment-level trends.
Why can a share price fall after strong quarterly results?
A stock may fall when results do not exceed expectations, valuation is demanding, risks remain unresolved or broader market conditions weaken. Strong earnings growth does not guarantee a positive share-price reaction.
What is the most important risk to monitor?
There is no single risk for every investor. Credit costs, lending-segment trends, funding economics, regulatory developments and the valuation paid should be assessed together using official disclosures.
Where can investors verify the results?
Start with the official investor-relations financial results page and its stock-exchange filings and investor presentation. Check the quarter, consolidation basis and definitions before comparing numbers.
Disclaimer: This article is for informational and educational purposes only. It is not investment advice, a personalised recommendation, or a prediction of future share-price performance. Financial figures and event details can change or be clarified by subsequent disclosures. Verify all material information against official company and exchange filings and consult a qualified adviser where appropriate.
Shubham tracks Indian equity markets with a focus on banking stocks, insurance companies, and long-term value investing. PositionalCalls was built to give independent investors the same quality of research that institutional desks produce, in plain language, with no brokerage bias and no paid promotions. All analysis is sourced from RBI, SEBI, NSE/BSE filings, and company annual reports.