
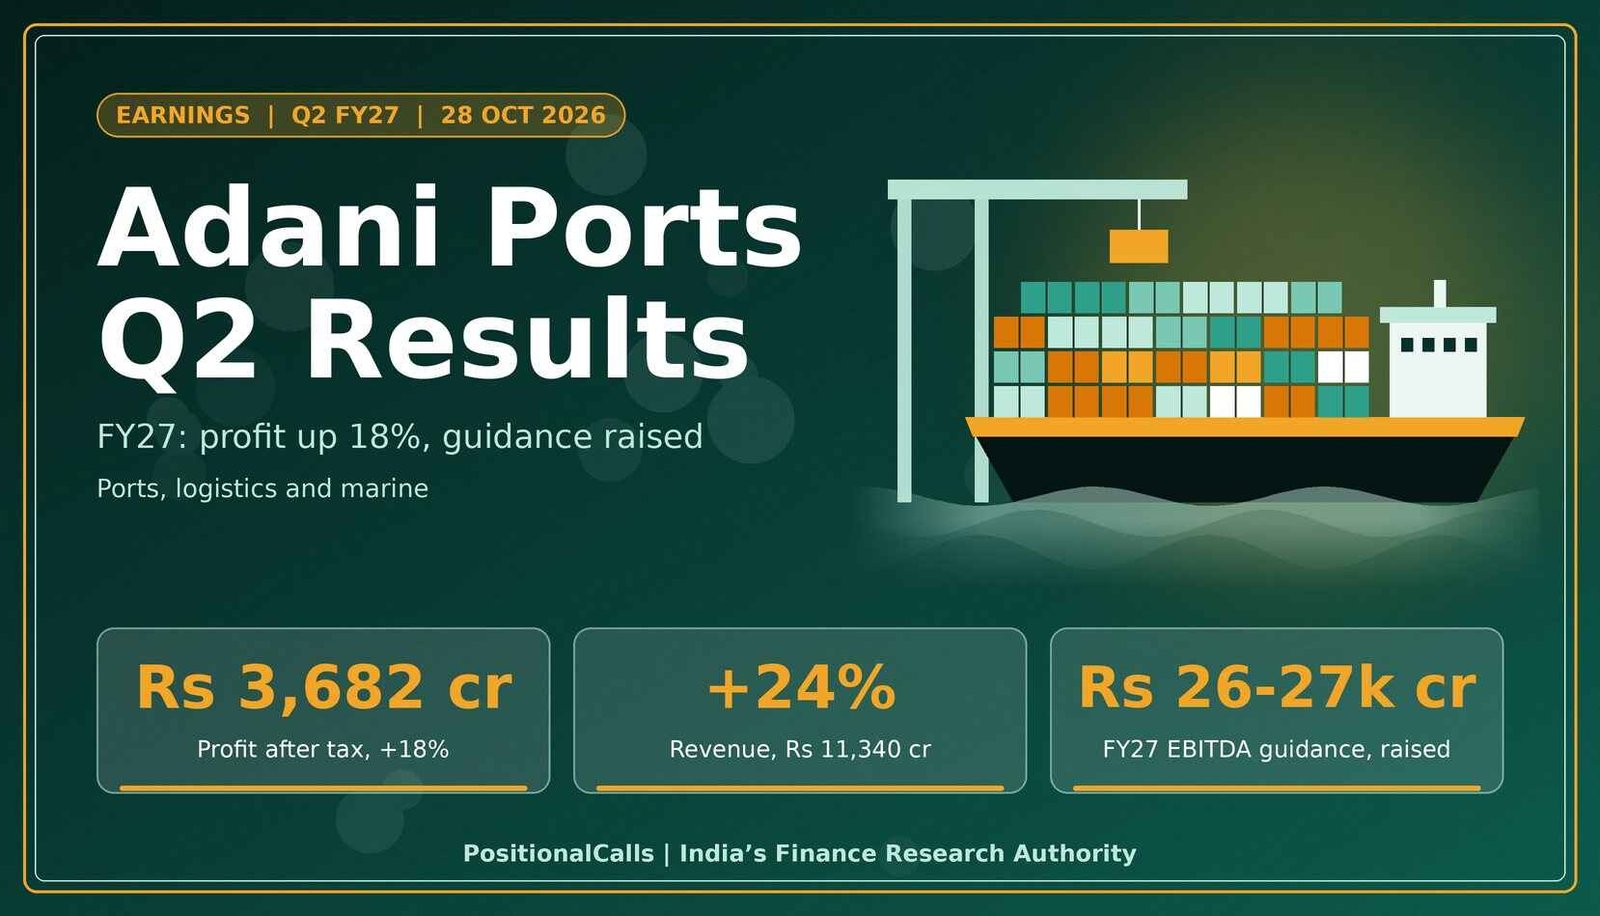
Earnings · Adani Ports
Adani Ports and SEZ grew revenue 24% in the September quarter and raised its FY27 guidance. This page shows which business earned the growth, which profit number to trust and what the second half has to deliver.
Quick answer
Adani Ports Q2 results for FY27: consolidated profit after tax rose 18% to Rs 3,682 crore from Rs 3,120 crore, on revenue of Rs 11,340 crore (+24%) and EBITDA of Rs 6,807 crore (+23%). The company raised FY27 revenue guidance to Rs 44,000-46,000 crore and EBITDA guidance to Rs 26,000-27,000 crore. Reported Wednesday, 28 October 2026.
Latest update (Wednesday, 4 November 2026, 11:00 AM IST): The results were published on Wednesday, 28 October 2026 and the shares closed over 6% higher on Thursday, 29 October 2026. Coverage I reviewed did not mention an interim dividend. No later price move is confirmed in this edition. The next dated event is the Q3 FY27 results date, which the company has not announced.
Key takeaways
- Profit: Consolidated PAT Rs 3,682 crore vs Rs 3,120 crore a year ago (+18%). Profit attributable to owners is reported near Rs 3,622 crore by some outlets.
- Revenue and EBITDA: Revenue Rs 11,340 crore (+24%), EBITDA Rs 6,807 crore (+23%). EBITDA margin was 60.0% against 60.5% a year ago (my calculation).
- Biggest driver: International ports gave about 49% of the Rs 1,257 crore EBITDA increase (my calculation); revenue there rose 71% and EBITDA 236%.
- Domestic cargo: Cargo was 118 MMT with 27.3% all-India cargo share; Kotak Securities called domestic volume growth of 4% modest.
- FY27 guidance: Revenue Rs 44,000-46,000 crore, EBITDA Rs 26,000-27,000 crore, capex Rs 15,000-17,000 crore; each raised.
- Share reaction: Shares closed more than 6% higher on Thursday, 29 October 2026, per PTI.
In plain words: Adani Ports earns money by handling cargo at ports, running trucks and warehouses, and operating ships and offshore vessels. EBITDA is profit before interest, tax, depreciation and amortisation, so it shows what the operations earned before financing costs and accounting charges. PAT is profit after tax.
Data note: as of Wednesday, 4 November 2026, 11:00 AM IST. Business figures come from the company’s media release dated 28 October 2026 and press reports of it; the stock exchange filing carries the audited line items, so use it for the final profit definition. Share-price figures are as reported by news outlets. One widely repeated claim, that the capex increase came in a separate late filing on Friday, is not what the company release shows: the capex raise was in the 28 October release itself.
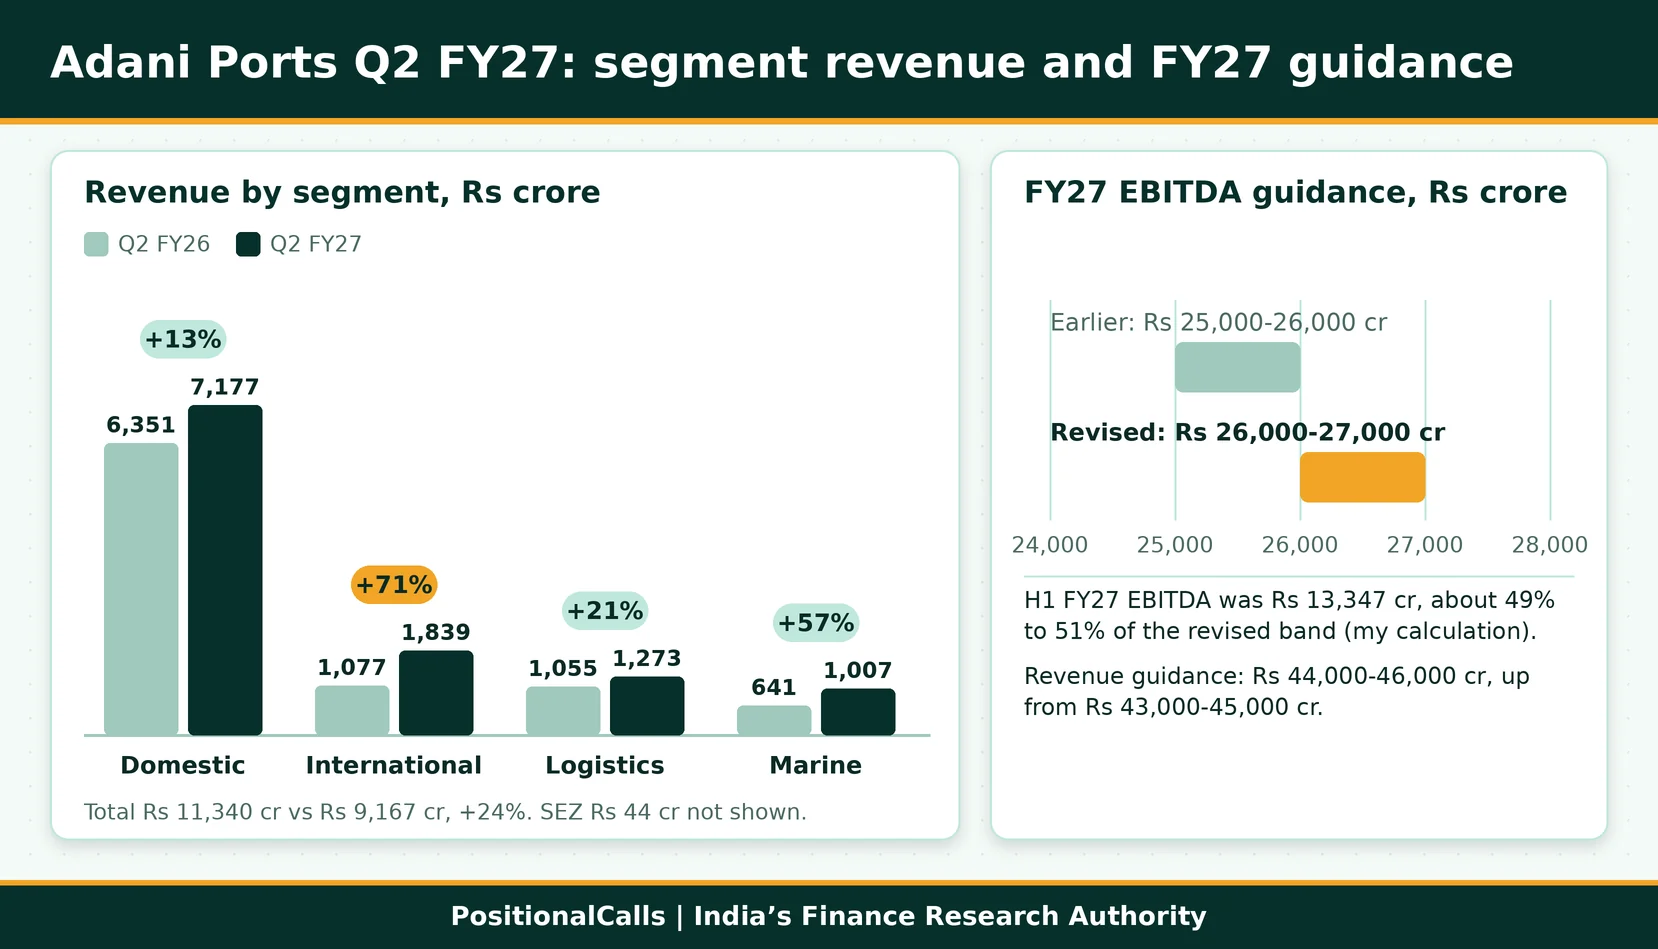
Adani Ports Q2 results FY27: key numbers at a glance
Adani Ports grew revenue 24% and EBITDA 23% in Q2 FY27, while profit after tax grew 18%, so profit growth lagged operating growth.
| Metric | Q2 FY27 | Q2 FY26 | Change | Why it matters |
|---|---|---|---|---|
| Revenue (Rs crore) | 11,340 | 9,167 | +24% | All five business lines grew |
| EBITDA (Rs crore) | 6,807 | 5,550 | +23% | Operating profit before interest, tax and depreciation |
| EBITDA margin (my calculation) | 60.0% | 60.5% | -0.5 pt | Growth came from scale, not richer margins |
| PAT (Rs crore) | 3,682 | 3,120 | +18% | Headline profit in the company release |
| H1 FY27 PAT (Rs crore) | 7,332 | 6,431 | +14% | Half-year profit growth is slower than the quarter |
| H1 FY27 EBITDA (Rs crore) | 13,347 | 11,046 | +21% | Used to test the raised guidance |
Cite this table: PositionalCalls, “Adani Ports Q2 Results Key Numbers Table, as of 4 November 2026”.
The figures behind these Adani Ports Q2 results are from the APSEZ Q2 FY27 media release. Year-ago figures are from the APSEZ Q2 FY26 media release and the same release. For other companies’ results, see the Q2 results calendar.
What was Adani Ports’ net profit in Q2 FY27, and which figure is right?
The Adani Ports net profit Q2 FY27 headline is Rs 3,682 crore, up 18%, which is consolidated profit after tax; some pages show Rs 3,622 crore or Rs 3,630 crore because they use different profit lines.
Search results for the Adani Ports Q2 results show three different profit numbers. They are not errors by the company. They measure different things, and pages often mix them without saying so.
| Profit line | Q2 FY27 (Rs crore) | Q2 FY26 (Rs crore) | Growth | Source and note |
|---|---|---|---|---|
| Consolidated PAT, company headline | 3,682 | 3,120 | +18% | Company release; the main figure used in this post |
| Consolidated PAT with decimals | 3,682.44 | 3,120.20 | +18.0% (my calculation) | PTI for Q2 FY27; Bajaj Broking for the year-ago base |
| Profit attributable to owners | 3,622 | 3,109 | +16.5% (my calculation) | Upstox and NewsBytes; confirm in the exchange filing |
| Rounded aggregator figure | 3,630 | 3,100 | +17.1% | Sahi only; conflicts with the lines above, so not used |
Cite this table: PositionalCalls, “Adani Ports Q2 Results Three Profit Definitions, as of 4 November 2026”.
On these reported figures, the gap between total PAT and profit attributable to owners is about Rs 60 crore this quarter against about Rs 11 crore a year ago (my calculation). That gap is the share of profit that belongs to minority shareholders in subsidiaries. It widened, which is one reason owners’ profit grew 16.5% while total PAT grew 18%.
My rule in this post: I use Rs 3,682 crore because the company itself uses it, and I name the other lines when they appear. A reader comparing with another site should first check which line that site uses.
Why did EBITDA grow 23% while the margin slipped? The sales-versus-margin bridge
Adani Ports EBITDA Q2 FY27 rose Rs 1,257 crore to Rs 6,807 crore; all of the rise came from higher sales, and margin pressure took away about Rs 59 crore, on my bridge calculation.
EBITDA rose by Rs 1,257 crore, from Rs 5,550 crore to Rs 6,807 crore. I split that rise into what extra revenue would have earned at last year’s margin, and what the change in margin did.
| Step | Rs crore | How I calculated it |
|---|---|---|
| Q2 FY26 EBITDA | 5,550 | Company release |
| Sales effect | +1,316 | Revenue rise of Rs 2,173 crore multiplied by the year-ago margin of 60.5% |
| Margin effect | -59 | Q2 FY27 revenue of Rs 11,340 crore multiplied by the margin change of -0.52 percentage points |
| Q2 FY27 EBITDA | 6,807 | Company release; the three steps add up to it |
Cite this table: PositionalCalls, “Adani Ports Q2 Results EBITDA Bridge, as of 4 November 2026”.
The margin dip is small, so it is not a warning on its own. It matters because the mix is changing. Faster-growing lines such as logistics and marine earn lower margins than domestic ports, and the next section shows how that plays out segment by segment.
Which business drove the Adani Ports Q2 results?
International ports delivered about 49% of the EBITDA increase and domestic ports about 41%, so overseas terminals are now a large share of growth.
| Segment | Revenue, Rs crore (YoY) | EBITDA, Rs crore (YoY) | EBITDA margin (year ago) | Share of EBITDA rise |
|---|---|---|---|---|
| Domestic ports | 7,177 (+13%) | 5,201 (+11%) | 72.5% (73.8%) | 41% |
| International ports | 1,839 (+71%) | 878 (+236%) | 47.7% (24.2%) | 49% |
| Logistics | 1,273 (+21%) | 237 (+8%) | 18.6% (20.9%) | 1% |
| Marine | 1,007 (+57%) | 447 (+32%) | 44.4% (52.7%) | 9% |
| SEZ | 44 (+2%) | 44 (+2%) | 100.0% (100.0%) | 0% |
| Total | 11,340 (+24%) | 6,807 (+23%) | 60.0% (60.5%) | 100% |
Cite this table: PositionalCalls, “Adani Ports Q2 Results Segment Engine Table, as of 4 November 2026”.
Revenue and EBITDA by segment in the Adani Ports Q2 results are from the company release. The margins and the share of EBITDA increase are my calculations. Segment revenue adds up to Rs 11,340 crore and segment EBITDA to Rs 6,807 crore, in both years.
Domestic ports are still the base of the business, at about 76% of EBITDA, down from about 84% a year ago. Three of the four main segments saw margins fall year on year. Only international ports improved, and by a wide margin, from 24.2% to 47.7%.
What was Adani Ports’ cargo volume in Q2 FY27?
Adani Ports cargo volume Q2 FY27 was 118 million tonnes at its domestic ports, with 27.3% of all-India cargo and 44.4% of container cargo, on 671 MMT of capacity.
Cargo volume is the most-watched operating number for a port company, because tariffs and costs are set by contract and capacity. The company release gives the volume, the market shares and the capacity, but not a year-ago volume.
Kotak Securities, quoted by IIFL, said domestic cargo grew 4%, which it called modest, and expected volumes to pick up in the second half. If that 4% applies to the 118 MMT figure, the year-ago quarter was close to 113 MMT (my calculation, not a company number).
One data platform (Arthneeti, secondary) adds that total cargo including international ports was 142 MMT, up 15%, with container volume of 4,220 thousand TEUs, up 13%. That agrees with my sum of 118 MMT domestic and 24 MMT international, but I did not find it in the company release, so treat it as reported, not confirmed.
Domestic ports revenue rose 13% against that cargo growth, which the company attributes to cargo growth and higher realisations. In plain words, each tonne earned more, and the business also earns from services beyond cargo handling.
On capacity use, 118 MMT in a quarter is a run-rate of about 472 MMT a year, around 70% of the 671 MMT capacity (my rough calculation; cargo is seasonal and capacity is an annual figure).
New capacity arrived in the quarter. The company secured a 30-year concession for the CQ-I and CQ-II dry bulk berths at Paradip Port, adding 18 MMT of mechanised capacity, and began EXIM operations at Vizhinjam. Bulk cargo links to coal, ore and steel demand; for that context see the Coal India Q2 results and the Tata Steel Q2 results.
How big is the international ports jump, and how much of it is acquisition?
International ports revenue rose 71% to Rs 1,839 crore and EBITDA rose 236% to Rs 878 crore at a record 47.7% margin, partly because an Australian terminal is now in the numbers.
Volumes at the international ports rose to 24 MMT from 10 MMT. The company credits the ramp-up of the Colombo West International Terminal (CWIT), Tanzania and the North Queensland Export Terminal (NQXT) in Australia.
The base is not like for like. The company’s release list shows the NQXT acquisition completing on 23 December 2025, after the year-ago quarter ended. So part of the 71% is acquired revenue, and the release does not split organic from acquired growth. I would not read the 236% EBITDA jump as pure organic improvement.
- CWIT: handled 2 million TEUs in its first 18 months, and Phase II doubled capacity from 1.6 million to 3.2 million TEUs.
- Colombo target: the terminal aims at nearly 25% of the Port of Colombo’s targeted capacity of 13 million TEUs by 2028.
- Tanzania: record quarterly volume of 265,518 TEUs, including a record month of 91,625 TEUs in July 2026.
Emkay Global, quoted by IIFL, highlighted the 71% revenue growth. The sequential view is also strong: international EBITDA was Rs 730 crore in Q1 FY27 at a 41.8% margin, so Q2 added Rs 148 crore and about six margin points in one quarter.
PositionalCalls WhatsApp channel
Adani Ports Q3: get the number that matters
- The base to beat and segment table before the next Adani Ports result
- Which profit line each report is using, flagged clearly
- Dividend dates and filing links the day they appear
How did logistics and marine perform in Q2 FY27?
Logistics revenue rose 21% to Rs 1,273 crore but EBITDA rose only 8%; marine revenue rose 57% to Rs 1,007 crore and EBITDA rose 32%, so both grew faster than they earned.
Logistics: recovery after a hit in Q1
The company says logistics recovered from Q1 FY27, which was affected by the West Asia crisis. TEU volumes rose 15% to 167,453 from 145,310 in Q1. Trucking revenue rose 28% year on year and revenue at the international freight network more than doubled to Rs 289 crore. EBITDA margin was 18.6% against 20.9% a year ago (my calculation).
Marine: more vessels, lower margin
Marine growth was supported by 138 vessels against 127 a year earlier, more offshore work and a start in subsea services. Margin was 44.4% against 52.7% a year ago (my calculation). Growth in a newer business often costs margin early, so the question for Q3 is whether the margin stabilises.
What is Adani Ports’ FY27 guidance after the Q2 results?
Adani Ports FY27 guidance now has the company raising revenue guidance by Rs 1,000 crore to Rs 44,000-46,000 crore, EBITDA guidance by Rs 1,000 crore to Rs 26,000-27,000 crore and capex guidance by Rs 3,000 crore to Rs 15,000-17,000 crore.
What changed on 28 October 2026
| Item (Rs crore) | Earlier FY27 guidance | Revised FY27 guidance | Change |
|---|---|---|---|
| Revenue | 43,000-45,000 (11%-16% growth) | 44,000-46,000 (14%-19% growth) | +1,000 each end |
| EBITDA | 25,000-26,000 (9%-14% growth) | 26,000-27,000 (14%-18% growth) | +1,000 each end |
| Capex | 12,000-14,000 | 15,000-17,000 | +3,000 each end |
| Net debt to EBITDA | Up to 2.5x | Up to 2.5x | No change |
The earlier band is in the APSEZ FY26 media release. The revised band is in the APSEZ Q2 FY27 media release. The company says the aim is to reach Rs 91,500 crore of revenue and Rs 52,000 crore of EBITDA by FY31, which it describes as 2.4 times and 2.3 times FY26 levels.
What the second half has to deliver
Subtracting first-half actuals from the guidance shows what the company needs in the second half. The year-ago base here is approximate, because I back-solved FY26 revenue (about Rs 38,600 crore) and EBITDA (about Rs 22,850 crore) from the company’s own growth percentages.
| Measure (Rs crore) | H1 FY27 actual | Implied H2 FY27 | Approx. H2 growth needed |
|---|---|---|---|
| Revenue | 22,161 | 21,839 to 23,839 | +8% to +17% |
| EBITDA | 13,347 | 12,653 to 13,653 | +7% to +16% |
Cite this table: PositionalCalls, “Adani Ports Q2 Results H2 FY27 Implied Guidance Table, as of 4 November 2026”.
H1 EBITDA grew 21%. The guidance implies H2 growth of roughly 7% to 16%. That means the new band looks achievable on the first-half run-rate and leaves room, but the company is not guiding to a repeat of the first-half pace. This is my reading of the arithmetic, not a forecast.
How strong is the balance sheet after H1 capex of Rs 10,521 crore?
Net debt to EBITDA was 1.8 times on the company’s proforma basis, against a guided ceiling of 2.5 times, after Rs 10,521 crore of capex in the first half.
| Item | Figure | Note |
|---|---|---|
| Gross debt | Rs 57,717 crore | As of 30 September 2026, company release |
| Cash balance | Rs 12,502 crore | Company release |
| Net debt | Rs 45,215 crore | My calculation: gross debt minus cash |
| Net debt to EBITDA | 1.8x | Proforma, using trailing NQXT EBITDA, per the company |
| H1 operating cash flow | Rs 13,327 crore | Funded Rs 10,521 crore of investments |
| H1 free cash flow | Rs 2,806 crore | Company figure; matches 13,327 minus 10,521 |
| Capex implied for H2 | Rs 4,479 to 6,479 crore | My calculation from the Rs 15,000-17,000 crore guidance |
| Credit ratings | S&P BBB (stable), JCR A-, CARE and ICRA AAA | S&P upgrade from BBB-, per the company |
Cite this table: PositionalCalls, “Adani Ports Q2 Results Balance Sheet Snapshot, as of 4 November 2026”.
Two readings matter. First, capex is front-loaded, since the guidance implies H2 spending well below the H1 level. Second, the company reports a 1.8 times ratio after Rs 30,346 crore of capex over two years, which gives room under the 2.5 times ceiling. Average debt maturity was 4.9 years against 5.2 years a year earlier.
The shares rose more than 2% at the open and closed over 6% higher on Thursday, 29 October 2026, the first session after the results.
| Date and time (IST) | Reported price or move | Source type |
|---|---|---|
| Tue 27 Oct, close | Rs 1,754.50 on NSE | Upstox |
| Wed 28 Oct, close | About Rs 1,761.30 on NSE | Derived from IIFL: Rs 1,800.60 was up Rs 39.30 |
| Thu 29 Oct, 9:18 AM | Rs 1,800.60, up 2.23% | IIFL, citing NSE data |
| Thu 29 Oct, 1:23 PM | BSE Rs 1,857.35, up 5.59%; NSE Rs 1,857.40, up 5.45%; top Sensex and Nifty gainer | Free Press Journal |
| Thu 29 Oct, close | Settled over 6% higher | PTI |
A 6% rise on the Rs 1,761.30 prior close implies a close above about Rs 1,867 (my calculation; I did not find the exact close). Upstox noted before the results that the stock had moved more than 5.6% within ten days of results in three of the last nine quarters, so a move of this size has precedent. I did not find a confirmed price after 29 October as of the time of writing.
Brokerages published views after the results. Emkay Global pointed to the 71% international revenue growth and Kotak Securities to modest domestic cargo growth. PositionalCalls is not a SEBI-registered research analyst, so this page does not publish price targets or buy, sell or hold views.
How do the Adani Ports Q2 results compare with Q1 FY27 and a year ago?
Q2 beat Q1 on revenue by 4.8% and on EBITDA by 4.1%, but profit after tax was almost flat at about 0.9% higher than Q1.
| Rs crore unless stated | Q2 FY27 | Q1 FY27 | Q2 FY26 |
|---|---|---|---|
| Revenue | 11,340 | 10,821 | 9,167 |
| EBITDA | 6,807 | 6,540 | 5,550 |
| EBITDA margin (my calculation) | 60.0% | 60.4% | 60.5% |
| PAT (Q1 is my calculation: H1 minus Q2) | 3,682 | 3,650 | 3,120 |
| International ports revenue | 1,839 | 1,747 | 1,077 |
| International ports EBITDA margin | 47.7% | 41.8% | 24.2% |
| Marine fleet (vessels) | 138 | 135 | 127 |
Cite this table: PositionalCalls, “Adani Ports Q2 Results Three-Period Comparison, as of 4 November 2026”.
The Q1 FY27 figures come from the APSEZ Q1 FY27 media release and from first-half totals in the Q2 release. A press report of Q1 profit at about Rs 3,650 crore agrees with my subtraction, while Upstox reported Rs 3,315 crore for Q1, which may be the profit attributable to owners; confirm the line in the filing. Port companies do not have a strong festival season like consumer firms, so the year-on-year column is the cleaner comparison and the sequential column shows momentum.
How to read the next Adani Ports results: a decoder
At Q3 FY27, check domestic cargo growth, international margin and whether first-half EBITDA keeps pace with the Rs 26,000-27,000 crore guidance.
| What to read | Q2 FY27 mark | Question to ask |
|---|---|---|
| Domestic cargo growth | 118 MMT; about 4% per Kotak | Did the second-half pick-up arrive? |
| International EBITDA margin | 47.7% | Does it hold once NQXT is in both periods? |
| Logistics margin | 18.6% | Did recovery from the Q1 West Asia hit lift it? |
| Marine margin | 44.4% (52.7% a year ago) | Has fleet growth stopped diluting margin? |
| EBITDA against guidance | H1 Rs 13,347 crore | Is nine-month EBITDA near 75% of the band? |
| Net debt to EBITDA | 1.8x vs 2.5x ceiling | Does it stay low as capex rises? |
| PAT against EBITDA growth | 18% against 23% | What do depreciation and interest look like in the filing? |
Cite this table: PositionalCalls, “Adani Ports Q2 Results Decoder, as of 4 November 2026”.
The company reported Q3 FY26 on 3 February 2026, so a Q3 FY27 date around early February 2027 is plausible, but no date is confirmed as of Wednesday, 4 November 2026, 11:00 AM IST. The board will announce it through an exchange intimation.
What most people miss in the Adani Ports Q2 results
Most pages repeat the 18% profit growth; the details that change the picture are the margin dip, the acquisition base and the slower second half the guidance implies.
Results alone need no action, and coverage I reviewed mentioned no dividend, so check the exchange filing before assuming one.
- What you need: nothing special. The shares trade on NSE and BSE like any other listed stock.
- Tax angle: gains on sale and any dividend are taxed under current rules. Check the current rates in our guide to capital gains tax on shares or ask a tax adviser.
- NRI note: NRIs buy through a PIS account with limits that changed in 2026. See NRI investment in the Indian stock market.
- Costs: brokerage and demat charges vary, so check your broker’s current schedule.
- Scam warning: fake “results alert” groups and tip sellers use well-known company names. No genuine result needs your OTP or an app download.
Related infrastructure and energy results: Power Grid Q2 results, Reliance Q2 results, ONGC Q2 results and the maritime peer Shipping Corporation of India Q3 results.
Analyst’s note
- What stands out: a quarter where international ports delivered about half of the EBITDA increase.
- Easy to miss: the margin dip and the acquisition base, both in the sections above.
- What would change the view: second-half EBITDA growth tracking the first-half pace, or falling below the implied 7%.
- Caution: a 6% one-day rise reflects expectations on one day and says nothing about the next quarter.
- Reader action: open the exchange filing and confirm the profit line, depreciation, interest and tax before relying on any single number.
Bottom line
Adani Ports delivered a clean quarter on scale, with international ports as the standout and a slightly lower margin. The raised guidance still implies slower second-half growth, and the profit line you quote should match the one in the filing.
Next read: Q2 results calendar.
Part of the Earnings series.
PositionalCalls WhatsApp channel
Never miss a results-day update
- Same-day decoders for the biggest companies reporting
- Record dates and dividend amounts checked against filings
- Corrections posted openly when a number changes
Adani Ports Q2 results: frequently asked questions
When were the Adani Ports Q2 results announced?
Adani Ports announced its Q2 FY27 results on Wednesday, 28 October 2026, for the quarter ended 30 September 2026. The company release is dated that day. The exact filing time is not confirmed in the sources I reviewed.
What was Adani Ports’ net profit in Q2 FY27?
Consolidated profit after tax was Rs 3,682 crore, up 18% from Rs 3,120 crore a year ago. Some outlets show Rs 3,622 crore, which is reported as profit attributable to owners and equals growth of about 16.5%.
Why do some sites show Rs 3,622 crore or Rs 3,630 crore for Adani Ports Q2 results?
They use different profit lines or rounding. Rs 3,682 crore is consolidated PAT. Rs 3,622 crore is reported as profit attributable to owners. Rs 3,630 crore appears on one aggregator only. Confirm in the exchange filing.
What is the Adani Ports FY27 guidance after the Q2 results?
Revenue guidance is Rs 44,000-46,000 crore, EBITDA guidance Rs 26,000-27,000 crore and capex Rs 15,000-17,000 crore. Each was raised on 28 October 2026. The net debt to EBITDA ceiling of up to 2.5 times is unchanged.
What was the Adani Ports cargo volume Q2 FY27 figure?
Cargo volume was 118 million tonnes, with 27.3% of all-India cargo and 44.4% of container cargo, on domestic capacity of 671 MMT. Kotak Securities put domestic cargo growth at about 4%, which it called modest.
Did Adani Ports declare a dividend with the Q2 results?
Coverage I reviewed did not mention an interim dividend with the Q2 results. Dividend decisions are announced through an exchange intimation, so check the NSE or BSE announcements page for any later declaration.
How did the stock move after the Adani Ports Q2 results?
The shares rose over 2% at the open on Thursday, 29 October 2026 and settled over 6% higher, per PTI. I did not find a confirmed price after that day as of Wednesday, 4 November 2026, 11:00 AM IST.
What is Adani Ports’ net debt to EBITDA?
The company reports 1.8 times on a proforma basis using trailing NQXT EBITDA, against a ceiling of up to 2.5 times. Gross debt was Rs 57,717 crore and cash Rs 12,502 crore, so net debt is about Rs 45,215 crore on my calculation.
Why did Adani Ports profit grow slower than EBITDA in Q2 FY27?
EBITDA grew 23% but PAT grew 18%. Extra EBITDA of Rs 1,257 crore became extra PAT of Rs 562 crore. Depreciation, interest and tax explain the gap; check the filing for the split.
When are Adani Ports Q3 FY27 results?
The company has not announced a date as of Wednesday, 4 November 2026, 11:00 AM IST. Q3 FY26 results came on 3 February 2026, so early February 2027 is plausible. Watch for the board meeting intimation on NSE and BSE.
Sources
- APSEZ Q2 FY27 media release (28 October 2026)
- APSEZ Q1 FY27 media release (29 July 2026)
- APSEZ FY26 media release (30 April 2026)
- APSEZ Q2 FY26 media release (4 November 2025)
- Adani Ports and SEZ investor site
- Business Standard, 28 October 2026; PTI via HDFC Sky, 29 October 2026; IIFL, 29 October 2026; Upstox, 28 October 2026; Free Press Journal, 28 and 29 October 2026; Republic World, 28 October 2026; Univest, Sahi, NewsBytes, Oneindia and Bajaj Broking (secondary, named not linked).
PositionalCalls.com is not a SEBI-registered research analyst or investment adviser. Investments in securities markets are subject to market risks. Read all related documents carefully before investing. Returns are never guaranteed. PositionalCalls is an independent Indian stock market research and education site founded by Shubham Chaudhary. This page is education and results analysis, not a recommendation to buy, sell or hold any security. How I researched this: I read the company’s media releases, cross-checked figures against Business Standard, PTI, IIFL and Upstox reports, recomputed every derived number, and listed conflicts openly. I have not opened the exchange filing itself.

Shubham Chaudhary is the founder of PositionalCalls, an independent Indian stock market research website. He writes company fundamentals, quarterly results analysis, IPO analysis and sector research for NSE and BSE listed companies, with a focus on banking stocks, insurance and long-term value investing. Every article is built from primary sources such as RBI, SEBI, NSE and BSE filings and company annual reports, and states its risks plainly in simple language for retail investors.
Coverage areas Our research standards- Numbers checked against NSE, BSE and SEBI filings
- Risks and limits stated in every article
- No paid promotions or broker tie-ups
- Articles updated when new filings arrive