
Earnings · Bajaj Auto
Bajaj Auto reported its September quarter on 27 October 2026 with record revenue, EBITDA and profit. Exports did most of the work, and group profit rose faster than the company’s own. Here is what the numbers show and where reports disagree.
Quick answer
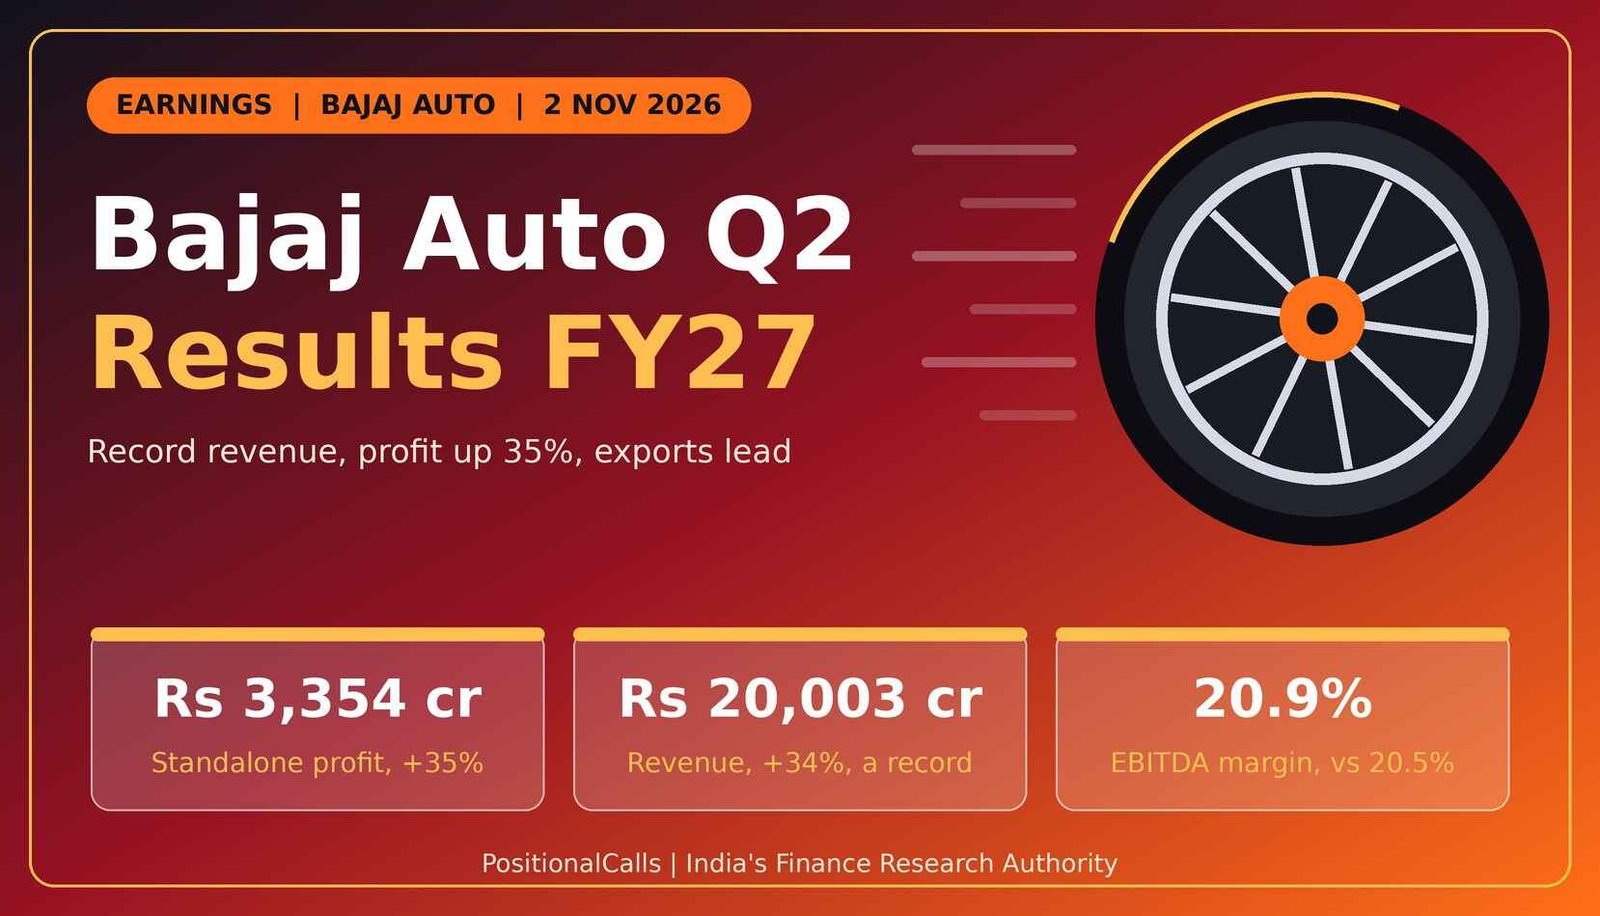
Bajaj Auto Q2 results FY27 show standalone net profit of Rs 3,353.76 crore, up 35.3%, on record revenue of Rs 20,003.43 crore, up 34.1%. Consolidated profit to owners rose about 62% to Rs 3,436.10 crore. EBITDA margin was 20.9%. Profit beat estimates by about 6%. The results came on 27 October 2026.
Latest update (2 November 2026, 2:00 PM IST): Bajaj Auto’s board approved the results on Tuesday, 27 October 2026 and the company held its results call at 7:15 PM IST that evening. Reports differ on EBITDA by up to Rs 10 crore and on year-ago margin by 0.1 point, and one page mixes in a figure that belongs to another company.
Key takeaways
- Standalone: revenue Rs 20,003.43 crore (+34.1%); net profit Rs 3,353.76 crore (+35.3%); EBITDA about Rs 4,171 crore (+37%).
- Consolidated: profit attributable to owners Rs 3,436.10 crore, up about 62% from Rs 2,122.03 crore.
- Versus estimates: profit about 6% above and revenue about 5% to 6% above two sets of estimates (my calculations).
- Volumes: 15.49 lakh vehicles (+20%); exports grew about 40%; revenue per vehicle rose about 12% (my calculation).
- Margin: EBITDA margin 20.9% against 20.5%; flat on Q1 FY27.
In plain words: Bajaj Auto makes motorcycles, three-wheelers and electric scooters, and exports about half of what it sells. “Standalone” is Bajaj Auto Limited alone; “consolidated” adds its finance arm and investments such as its stake in the European KTM group. EBITDA is operating profit before interest, tax, depreciation and amortisation.
Data note: as of 2 November 2026, 2:00 PM IST. Figures follow Bajaj Auto’s results as carried by AutoCar Pro, Free Press Journal, Zee Business, Angel One, IndMoney and InCred Money on 27 to 29 October 2026; I have not opened the exchange filing. Standalone and consolidated numbers are labelled. Derived numbers are marked “my calculation”.
What did Bajaj Auto report in the Q2 results FY27?
Bajaj Auto reported standalone revenue from operations of Rs 20,003.43 crore, up 34.1%, EBITDA of about Rs 4,171 crore, up 37%, and net profit of Rs 3,353.76 crore, up 35.3%, for the quarter ended 30 September 2026.
| Standalone, Rs crore | Q2 FY27 | Q2 FY26 | Change | Note |
|---|---|---|---|---|
| Revenue from operations | 20,003.43 | 14,922.05 | +34.1% | Record |
| EBITDA | 4,171 | 3,052 | +36.7% (my calculation) | Sources show 4,171 to 4,181 |
| EBITDA margin (my calculation) | 20.9% | 20.5% | +0.4 points | 4,171 / 20,003; 3,052 / 14,922 |
| Net profit | 3,353.76 | about 2,480 | +35.3% | Q2 FY26 shown as 2,479 or 2,480 |
| Vehicles sold (lakh units) | 15.49 | 12.94 | +20% | Exports led growth |
| Commercial vehicles (lakh units) | 2.65 | 2.23 | +18.8% (my calculation) | As reported |
Cite this table: PositionalCalls, “Bajaj Auto Q2 FY27 Results Table, as of 2 November 2026”.
Every standalone line grew by more than a third, except volumes, which grew about a fifth. That gap is the story of the quarter: revenue grew faster than units because each vehicle brought in more money. Reports describe the quarter as a record for revenue, EBITDA and profit. Revenue crossing Rs 20,000 crore for the first time is the company’s milestone, not an industry one.
Why did Bajaj Auto consolidated profit rise 62% when standalone rose 35%?
Because consolidated profit attributable to owners was Rs 3,436.10 crore against Rs 2,122.03 crore a year ago, and the year-ago group figure was about Rs 358 crore below standalone profit, while this quarter it is about Rs 82 crore above (my calculations).
| Rs crore | Q2 FY27 | Q2 FY26 | How derived |
|---|---|---|---|
| Standalone net profit | 3,353.76 | 2,480 | Reported |
| Consolidated profit to owners | 3,436.10 | 2,122.03 | Reported |
| Consolidated minus standalone (my calculation) | +82 | −358 | Subsidiaries, associates and other items |
| Swing (my calculation) | about +440 | 82 less (−358) | |
| Consolidated growth (my calculation) | +61.9% | 3,436.10 / 2,122.03 | |
| Standalone growth | +35.3% | Reported |
Cite this table: PositionalCalls, “Bajaj Auto Consolidated Versus Standalone Table, as of 2 November 2026”.
Consolidated profit includes the finance arm and Bajaj Auto’s share of its European mobility investments. A year ago those items pulled the group below the parent; this year they added to it. The swing of about Rs 440 crore (my calculation) accounts for the extra growth, but I could not confirm from the sources what drove it. Treat the 62% as a group figure with a low base and check the filing’s notes before reading it as operating strength.
Which Bajaj Auto numbers differ across reports? The definitions trap
EBITDA appears as Rs 4,171, 4,172 and 4,181 crore, the year-ago margin as 20.5% and 20.4%, and one page lists a figure for another company, so quote the line with its source.
| Item | Figures in circulation | What it likely means | What to do |
|---|---|---|---|
| Q2 FY27 EBITDA | Rs 4,171 crore; Rs 4,172 crore; about Rs 4,181 crore | Rounding and source differences | Use Rs 4,171 crore (Angel One) and say “about” |
| Q2 FY26 EBITDA margin | 20.5%; 20.4% | 3,052 / 14,922 is 20.45%; a source using 3,051 shows 20.4% | Use 20.5% and the +0.4 point change |
| Q2 FY26 profit | Rs 2,479 crore; Rs 2,480 crore | Rounding | Say about Rs 2,480 crore |
| Profit growth | +35.3%; +62% | Standalone; consolidated | Name the scope |
| Total vehicle estimate | Zee Business “25.49 lakh” | Looks like a typing slip for 15.49 lakh; the actual was 15.49 lakh | Do not use it |
| Group profit mentioned on one Zee page | Rs 6,296.67 crore | A financial-services group’s Q1 figure, not Bajaj Auto | Ignore |
Cite this table: PositionalCalls, “Bajaj Auto Definitions Table, as of 2 November 2026”.
One widely read page shows a consolidated profit figure of Rs 6,296.67 crore in a Bajaj Auto article. That number belongs to a different company’s first-quarter results and should not be used. Margin differences are small, but they are why a margin “improvement” can be quoted as 0.4 or 0.5 points. Where sources disagree by a few crore, I use the most commonly reported figure and say so.
Did Bajaj Auto beat estimates in Q2 FY27?
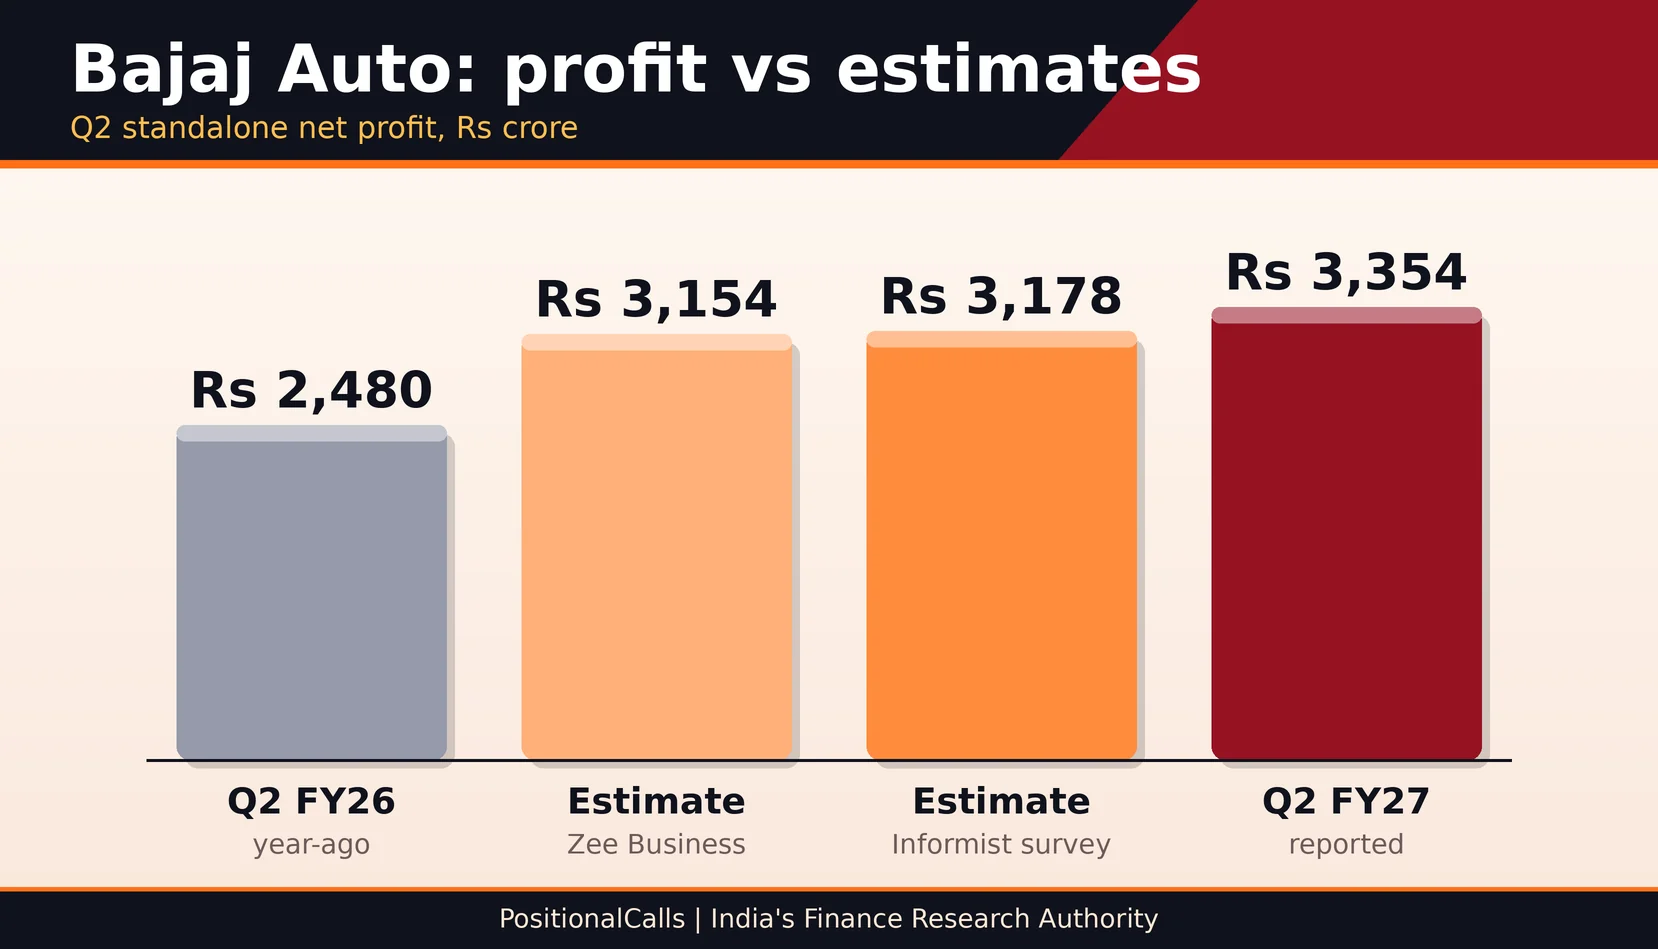
Yes: profit of Rs 3,353.76 crore was about 5.5% above the Rs 3,178 crore survey estimate and 6.3% above Rs 3,154 crore, and revenue was 4.8% to 6.1% above two estimates (my calculations).
| Item | Estimate | Reported | Gap (my calculation) |
|---|---|---|---|
| Revenue | Rs 19,085 crore (Informist survey, 20 analysts) | Rs 20,003.43 crore | +4.8% |
| Revenue, second estimate | Rs 18,850 crore (Zee Business) | Rs 20,003.43 crore | +6.1% |
| Net profit | Rs 3,178 crore (Informist survey) | Rs 3,353.76 crore | +5.5% |
| Net profit, second estimate | Rs 3,154 crore (Zee Business) | Rs 3,353.76 crore | +6.3% |
| EBITDA margin | About 20.5% (in line, per Zee Business) | 20.9% | In line to slightly above |
| Operating profit | One page: beat by about 7% | Rs 4,171 crore | Single source |
Cite this table: PositionalCalls, “Bajaj Auto Estimate Versus Actual Table, as of 2 November 2026”.
The beat came from volume and price, not from margin. One report says margin was in line with estimates while revenue and profit were ahead. Estimates here come from two sources and are not a verified consensus. The beat on profit is also about equal to the beat on revenue, which is consistent with a steady margin.
Was Bajaj Auto’s growth driven by volume or by price?
Both: units rose 19.7% to 15.49 lakh and revenue per vehicle rose about 12% to roughly Rs 1.29 lakh, so higher realisation added about as much to growth as an extra fifth in volume (my calculations).
| Per-vehicle view (my calculation) | Q2 FY27 | Q2 FY26 | Change |
|---|---|---|---|
| Vehicles sold (lakh units) | 15.49 | 12.94 | +19.7% |
| Revenue per vehicle (Rs) | about 1,29,100 | about 1,15,300 | +12.0% |
| Revenue (Rs crore) | 20,003.43 | 14,922.05 | +34.1% |
| Check: 1.197 × 1.120 | about 1.341 |
Cite this table: PositionalCalls, “Bajaj Auto Volume and Price Table, as of 2 November 2026”.
Revenue per vehicle is revenue divided by units, so it includes spares and other income and is an approximation. It still shows that the mix moved up. Exports contributed about 88% of the increase in vehicle sales and slightly exceeded domestic volumes, as reported by one page. September 2026 exports were about 2.43 lakh units, up 32%, and total September sales were 5.38 lakh units, up 5%, as reported. Electric scooter revenue from Chetak was reported at about Rs 2,000 crore in the quarter by one outlet; I could not confirm it from the filing.
What is the margin worth in rupees?
On Rs 20,003 crore of revenue, one point of EBITDA margin is worth about Rs 200 crore, so the 0.4-point gain from 20.5% to 20.9% is worth about Rs 80 crore of EBITDA (my calculations).
| EBITDA margin | EBITDA on Rs 20,003 crore revenue | Reading |
|---|---|---|
| 20.0% | Rs 4,001 crore | Illustrative lower case |
| 20.5% | Rs 4,101 crore | Q2 FY26 margin applied to Q2 FY27 revenue |
| 20.9% | Rs 4,181 crore | Reported margin; the company figure is about Rs 4,171 crore |
| 21.5% | Rs 4,301 crore | Illustrative upper case |
Cite this table: PositionalCalls, “Bajaj Auto Margin in Rupees Table, as of 2 November 2026”.
Bajaj Auto held a margin above 20% despite rising manufacturing costs, as one report puts it. The margin was flat against Q1 FY27, so the quarter shows resilience rather than a step up. The profit gain therefore came from revenue growth of about Rs 5,081 crore (my calculation: 20,003.43 less 14,922.05), not from a richer margin.
PositionalCalls WhatsApp channel
Auto results, decoded in plain words
- Bajaj Auto and peers side by side
- Standalone and consolidated kept apart
- Estimate beats and misses checked against the filing
What do the H1 FY27 numbers show?
H1 FY27 standalone revenue was Rs 37,247.15 crore, up 35.4%, net profit Rs 6,337 crore, up 38.5%, and EBITDA Rs 7,766 crore, up 40.3% (my calculations on reported figures).
| Standalone, Rs crore | H1 FY27 | H1 FY26 | Change |
|---|---|---|---|
| Revenue from operations | 37,247.15 | 27,506.50 | +35.4% |
| Net profit | 6,337 | 4,576 | +38.5% |
| EBITDA | 7,766 | 5,534 | +40.3% |
| Implied Q1 FY27 revenue (my calculation) | 17,244 | 37,247.15 less 20,003.43 | |
| Implied Q1 FY27 net profit (my calculation) | about 2,983 | 6,337 less 3,353.76 | |
| Implied Q1 FY27 EBITDA margin (my calculation) | about 20.8% | (7,766 less 4,171) / 17,244 |
Cite this table: PositionalCalls, “Bajaj Auto H1 FY27 Table, as of 2 November 2026”.
Q2 revenue was about 16.0% above the implied Q1 and net profit about 12.4% above (my calculations: 20,003.43 / 17,243.72 and 3,353.76 / 2,983). The implied Q1 margin of 20.8% matches the report that Q2’s 20.9% was flat on Q1. Quarter-on-quarter growth was therefore healthy but slower than year-on-year growth.
One report says the shares traded near Rs 10,522, up 1.27%, at 11:27 AM on 28 October 2026, and another shows Rs 10,391 at 10:38 AM on 29 October; I have not verified closing prices.
These are intraday prices carried by third-party reports, not exchange closing records. The results came during market hours on 27 October, with the call at 7:15 PM IST. A gain of about 1% after a profit beat of about 6% shows that good results do not always move a share price. Check the exchange for verified closes before drawing a conclusion.
How do Bajaj Auto’s results compare with other two-wheeler and auto makers?
TVS Motor posted the fastest year-on-year growth among TVS Motor, Bajaj Auto and Hero MotoCorp, while Bajaj Auto led in profit and margin, as reported.
| Company | Q2 FY27 headline | Our page |
|---|---|---|
| Bajaj Auto | Standalone profit Rs 3,353.76 crore, +35.3% | This page |
| TVS Motor | About 19 lakh two- and three-wheelers, +27%; fastest growth in revenue and profit among the three (one report) | Auto earnings |
| Hero MotoCorp | Reported; figures not captured here | Auto earnings |
| Maruti Suzuki | Consolidated revenue +26%; consolidated profit down 26.9% (one aggregator) | Maruti Suzuki Q2 results FY27 |
| Mahindra & Mahindra | Board meeting Thu, 5 Nov 2026 | M&M Q2 results FY27 |
| Eicher Motors | Earlier quarter | Eicher Motors Q3 results |
For more auto context see the auto category, Ashok Leyland Q3 results and M&M Q3 results. All dates are on the Q2 results calendar hub.
What should you check in the Bajaj Auto filing?
Read the standalone and consolidated notes first, then the exports split, then the Chetak and finance lines, then the margin basis, because reports are thin on each.
| What to read | Reported mark | Question to ask |
|---|---|---|
| Consolidated versus standalone profit | Rs 3,436.10 crore vs Rs 3,353.76 crore | What drove the Rs 440 crore swing? |
| Exports | +about 40% in the quarter | Volume or value, and which markets? |
| EBITDA margin | 20.9% vs 20.5% | Which items offset input costs? |
| Chetak and electric three-wheelers | About Rs 2,000 crore (one report) | What is the segment margin? |
| Other income and treasury | Not seen | How much of profit is non-operating? |
| Exceptional items | None seen | Any one-off in the notes? |
Cite this table: PositionalCalls, “Bajaj Auto Filing Checklist, as of 2 November 2026”.
What do most people miss about the Bajaj Auto Q2 results FY27?
Most miss that the 62% is a consolidated figure on a low base, that growth was export-led and price-driven, and that margin was flat on Q1.
- Name the scope, standalone or consolidated, with every number.
- Compare Q2 FY27 with Q2 FY26 first, then with Q1 FY27.
- Check the exports split and the Chetak line in the filing.
- Use the company EBITDA figure, about Rs 4,171 crore.
- Verify closing prices on the exchange before quoting a share-price move.
What do you need to know about costs, tax and safety?
Trading costs and your holding period matter more than one quarter’s headline; never pay anyone for results alerts or tips.
- What you need: a demat and trading account; settlement is T+1.
- Costs: check your broker’s current charge schedule for brokerage, securities transaction tax, GST and stamp duty on each trade.
- Tax angle: gains on shares are taxed by holding period; see capital gains tax on shares and ask a tax adviser if unsure.
- NRI note: see NRI investment in the Indian stock market.
- Scam warning: fake results alerts, paid “sure-shot” tips and KYC links on messaging apps are common. Never share an OTP.
Analyst’s note
- What stands out: in the Bajaj Auto Q2 results FY27, revenue grew 34% on 20% more vehicles, which means price and mix did about as much as volume.
- Easy to miss: the consolidated 62% rests on a swing of about Rs 440 crore outside the parent, so it is a different story from the 35% standalone.
- What would change the view: a margin below 20% with exports slowing would show the cost pressure biting.
- Caution: this is reasoning from reported numbers, not a forecast or advice. No outcome is assured.
- Reader action: read the consolidated note and quote scope with every number.
Bottom line
Bajaj Auto Q2 results FY27: standalone profit Rs 3,353.76 crore (+35.3%) on record revenue of Rs 20,003.43 crore (+34.1%), consolidated profit Rs 3,436.10 crore (+62%), EBITDA margin 20.9%, and a profit beat of about 6% on two estimates. Confirm the figures and the consolidated drivers in the filing.
Part of the Auto earnings series. See also the Maruti Suzuki Q2 results FY27 page.
PositionalCalls WhatsApp channel
Auto results, without the noise
- Bajaj Auto, M&M and Maruti side by side
- Plain-language summaries of each filing
- Corrections flagged the moment numbers change
Frequently asked questions
What are the Bajaj Auto Q2 results FY27?
Bajaj Auto reported standalone revenue of Rs 20,003.43 crore (+34.1%), EBITDA of about Rs 4,171 crore (+37%) and net profit of Rs 3,353.76 crore (+35.3%) for Q2 FY27, announced on 27 October 2026. Consolidated profit to owners was Rs 3,436.10 crore.
Why is Bajaj Auto consolidated profit growth 62% and standalone 35%?
Consolidated profit rose from Rs 2,122.03 crore to Rs 3,436.10 crore, while standalone rose from about Rs 2,480 crore to Rs 3,353.76 crore. A swing of about Rs 440 crore in subsidiaries and associates (my calculation) explains the gap.
Did Bajaj Auto beat Q2 estimates?
Yes. Profit of Rs 3,353.76 crore was about 5.5% above the Rs 3,178 crore survey estimate and 6.3% above Rs 3,154 crore (my calculations). Revenue was 4.8% to 6.1% above two estimates. The estimates are not a verified consensus.
What was Bajaj Auto EBITDA margin in Q2 FY27?
EBITDA margin was 20.9%, against 20.5% a year earlier, a gain of about 0.4 points, and flat on Q1 FY27. EBITDA appears as Rs 4,171 to 4,181 crore across reports because sources round differently.
How many vehicles did Bajaj Auto sell in Q2 FY27?
Bajaj Auto sold 15.49 lakh vehicles, up 20% from 12.94 lakh. Commercial vehicle volumes were 2.65 lakh against 2.23 lakh. Exports drove most of the growth, as reported. One page printing 25.49 lakh looks like a typing error.
How much did Bajaj Auto exports grow in Q2 FY27?
Reports put export growth at about 40% year on year, and September 2026 exports at about 2.43 lakh units, up 32%. Exports contributed about 88% of the rise in vehicle sales, per one page. Check units versus value in the filing.
What were Bajaj Auto H1 FY27 results?
H1 FY27 standalone revenue was Rs 37,247.15 crore (+35.4%), net profit Rs 6,337 crore (+38.5%) and EBITDA Rs 7,766 crore (+40.3%). Implied Q1 profit is about Rs 2,983 crore (my calculation).
One report shows the shares near Rs 10,522, up 1.27%, at 11:27 AM on 28 October 2026, and another Rs 10,391 on 29 October. These are intraday figures; check the exchange for verified closing prices.
Is the Rs 6,296.67 crore profit in some Bajaj Auto articles correct?
No. That figure belongs to a different company’s first-quarter results and was mixed into one article. Bajaj Auto’s consolidated profit to owners for Q2 FY27 was Rs 3,436.10 crore.
Where do I check the official Bajaj Auto results?
Open the NSE or BSE announcements for BAJAJ-AUTO or the investor page at bajajauto.com. Reports differ on EBITDA, margin and scope, so use the filing as the final source.
Sources
- Bajaj Auto Limited results announcement and board outcome, 27 October 2026 (NSE and BSE)
- AutoCar Pro, Free Press Journal, Zee Business, Angel One, IndMoney and InCred Money results reports, 27 to 29 October 2026 (secondary, not linked)
- Zeebiz comparison of TVS Motor, Bajaj Auto and Hero MotoCorp, 29 October 2026 (secondary, not linked)
Editorial disclosure. PositionalCalls.com is not a SEBI-registered research analyst or investment adviser. Investments in securities markets are subject to market risks. Read all related documents carefully before investing. Returns are never guaranteed. This page is educational, is independent and was written by Shubham Chaudhary, founder of PositionalCalls. How I researched this: I compared results reports of the company filing, reconciled the half-year and quarterly figures, recomputed every derived number and labelled conflicting figures. Corrections are published in the Data note.

Shubham Chaudhary is the founder of PositionalCalls, an independent Indian stock market research website. He writes company fundamentals, quarterly results analysis, IPO analysis and sector research for NSE and BSE listed companies, with a focus on banking stocks, insurance and long-term value investing. Every article is built from primary sources such as RBI, SEBI, NSE and BSE filings and company annual reports, and states its risks plainly in simple language for retail investors.
Coverage areas Our research standards- Numbers checked against NSE, BSE and SEBI filings
- Risks and limits stated in every article
- No paid promotions or broker tie-ups
- Articles updated when new filings arrive