
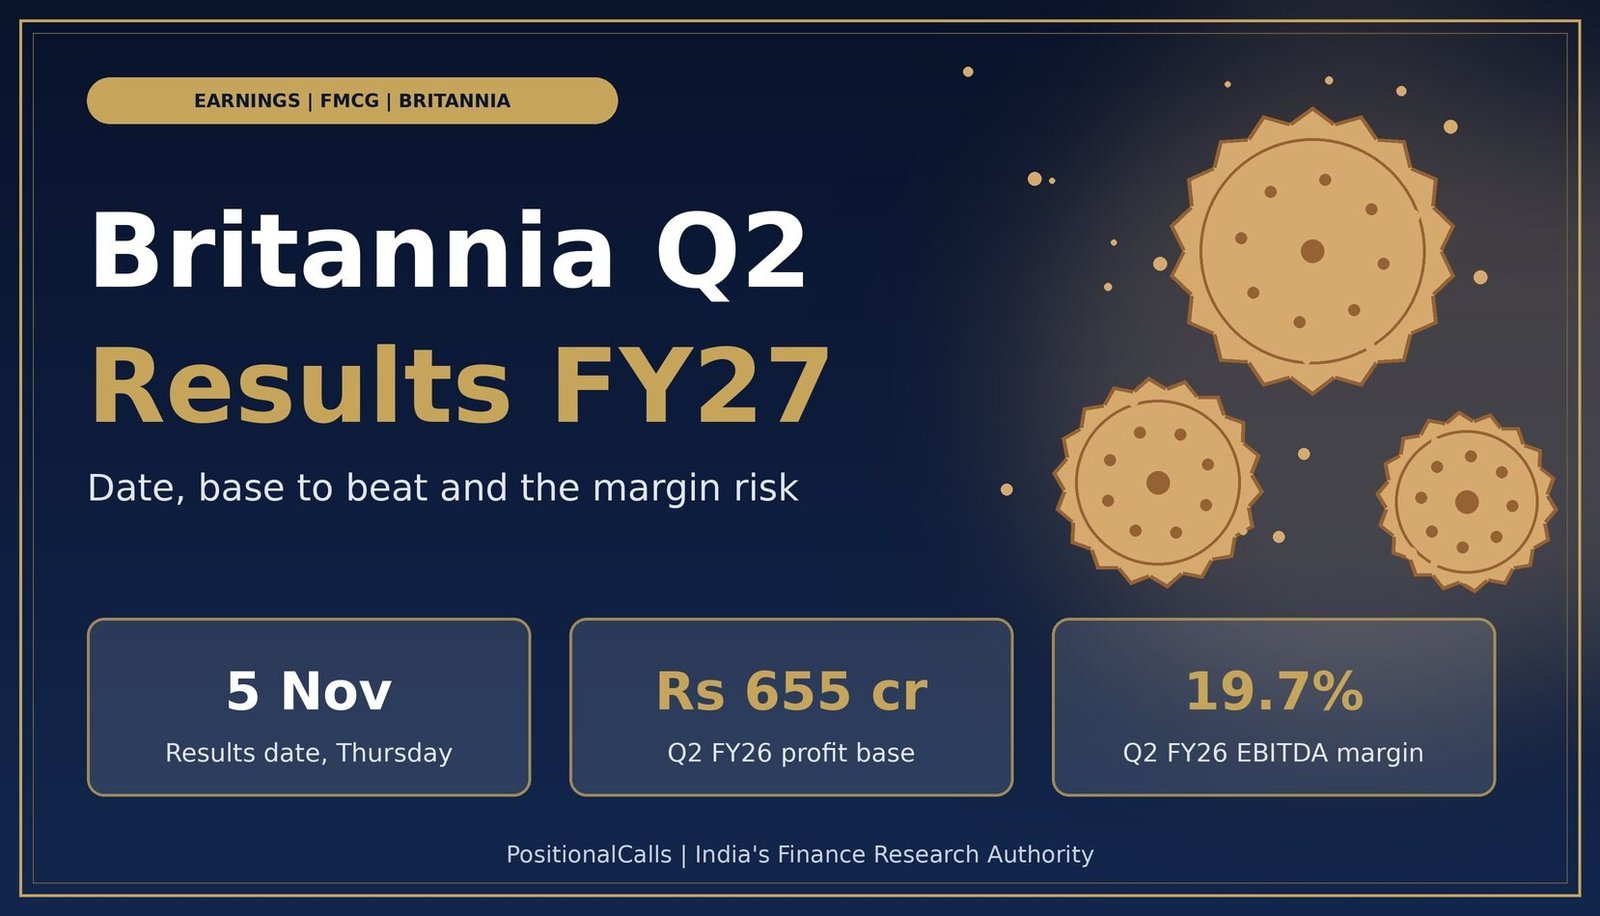
Earnings · FMCG · Britannia Industries
Britannia is scheduled to report its September-quarter results on Thursday, 5 November 2026. Last year’s margin jumped to a high base, and input costs are rising. Here are the date, the clean base, one street estimate and the lines to read first.
Quick answer
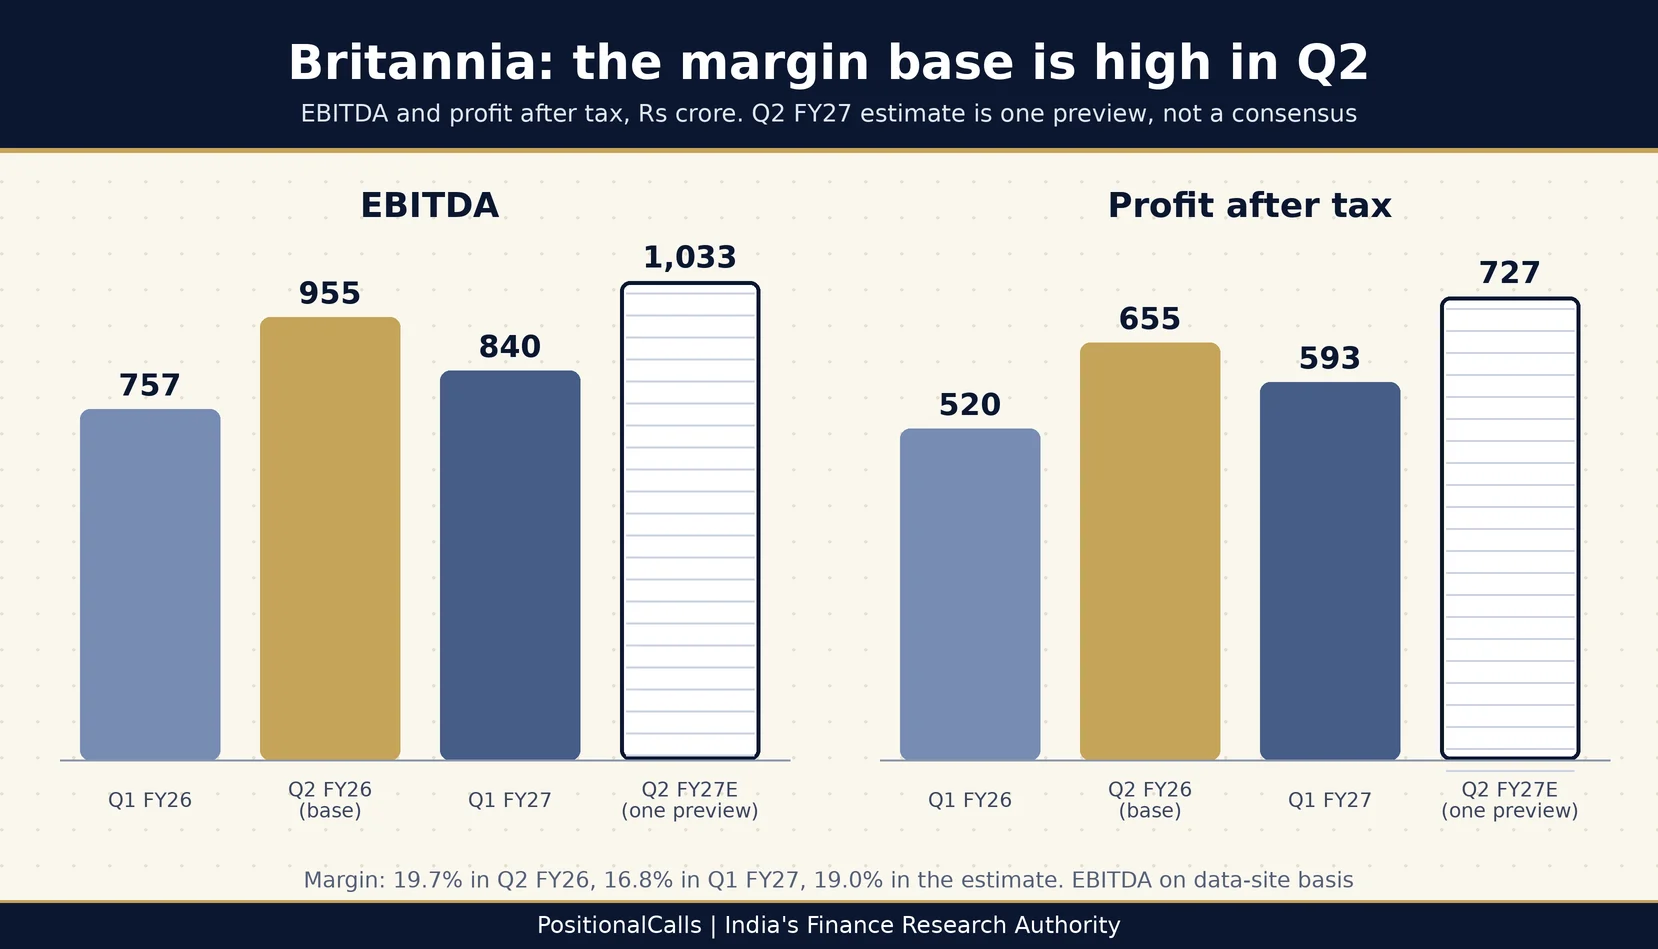
Britannia Q2 results FY27 are due on Thursday, 5 November 2026. The base to beat is Rs 4,841 crore revenue, EBITDA near Rs 955 crore at a 19.7% margin and Rs 655 crore profit from Q2 FY26. One preview expects Rs 5,432 crore revenue and Rs 727 crore profit, as of 1 November 2026.
Latest update (1 November 2026, 11:45 PM IST): A Zee Business preview and a results calendar list the board meeting for Thursday, 5 November 2026. I did not open the board notice. The only Q2 FY27 estimate I found is that one preview, not a confirmed consensus.
Key takeaways
- Date: board meeting scheduled for Thursday, 5 November 2026; last quarter results came after market hours.
- Base to beat: Q2 FY26 profit Rs 655 crore (+23.2%) on revenue of Rs 4,841 crore, with EBITDA margin of 19.7%.
- Tough margin base: Q1 FY27 margin was 16.8%; the Q2 FY26 base is 290 basis points above its prior year.
- One estimate: revenue Rs 5,432 crore, EBITDA margin 19%, profit Rs 727 crore (single source).
- Definitions: operating profit, EBITDA and profit each appear in two versions.
In plain words: Britannia sells biscuits, bread, cakes and dairy products. Its profit depends on how much wheat, palm oil, sugar and packaging cost against what it charges. This page shows last year’s numbers, why some of them are reported two ways, and what to read first.
Data note: as of Sunday, 1 November 2026, 11:45 PM IST. Q1 FY27 figures come from Britannia’s 6 August 2026 results as carried by Kotak Neo, Upstox, Investing.com and other sites. Q2 FY26 figures come from the company’s results coverage and a Sharekhan note. I did not open the exchange filings. Q2 FY27 results are not reported yet.
When are Britannia Q2 results FY27 due?
Thursday, 5 November 2026, according to a Zee Business preview and a results calendar; the filing time is not announced.
The board will consider unaudited standalone and consolidated results for the quarter and half-year ended 30 September 2026. Last quarter the board met on Thursday, 6 August 2026 and the results came after market hours. A results-data platform shows 6 November 2026, which I treat as a projection until a notice confirms it. I did not open the board notice.
Britannia Q2 results FY27: what changed and when
| Event | Date | Weekday | Status |
|---|---|---|---|
| Q2 FY26 results | 5 November 2025 | Wednesday | Filed; this is the year-ago base |
| Q1 FY27 results | 6 August 2026 | Thursday | Filed; EBITDA below the poll |
| Q2 FY27 results | 5 November 2026 | Thursday | Reported date; confirm in filing |
The legal deadline is 14 November 2026. Other consumer names report the same week; see Dabur, Titan and ITC. Track every date on the results calendar hub.
What numbers does Britannia have to beat?
Revenue of Rs 4,841 crore, EBITDA near Rs 955 crore at 19.7% and profit of Rs 655 crore, all from Q2 FY26, with Q1 FY27 as the current run-rate.
| Consolidated, Rs crore | Q2 FY26 (year-ago base) | Q1 FY27 | Gap (my calculation) | Why it matters |
|---|---|---|---|---|
| Revenue from operations | 4,841 | 5,000 | +159 (+3.3%) | Headline growth measure |
| Net sales | 4,752 | 4,964 | +212 (+4.5%) | Used in the company’s margins |
| EBITDA (data-site basis) | 955 | 840 | -115 (-12.0%) | Margin base is high |
| EBITDA margin | 19.7% | 16.8% | -2.9 points | Q2 FY26 was unusually high |
| Profit after tax | 655 | 593 | -62 (-9.4%) | Year-ago profit must be beaten |
Cite this table: PositionalCalls, “PositionalCalls Britannia Q2 FY27 Base-to-Beat Table, as of 1 November 2026”.
The gap column reads across two different quarters, so it is a guide, not a seasonal comparison. The year-on-year test for Britannia Q2 results FY27 uses the base column. The key point is that Q1 FY27 profit of Rs 593 crore sits 9.4% below the Q2 FY26 base, so Britannia needs a strong sequential step to show growth. Last year Q2 profit was 25.9% above Q1 (655.06 over 520.13, my calculation).
Which Britannia profit and margin figures are right?
Use consolidated profit after tax (Rs 655.06 crore in Q2 FY26 and Rs 593.38 crore in Q1 FY27) and say whether margins are on operating profit or EBITDA.
| Measure, Rs crore | Q2 FY26 | Q1 FY27 | Note |
|---|---|---|---|
| Consolidated profit after tax | 655.06 | 593.38 | Company filing figure |
| Same profit, other versions | 654.47 | 591.4 or 593 | Rounding or source differences |
| Standalone profit after tax | Not in sources | 576.38 | Parent only |
| Operating profit (company) | About 870 (18.3% of net sales) | 761 (15.3% of sales) | Excludes other operating income |
| EBITDA (data sites) | 955 (19.7%) | 840 (16.8%) | Includes other items |
Cite this table: PositionalCalls, “PositionalCalls Britannia Definitions Table, as of 1 November 2026”.
My calculation: the gap between EBITDA and company operating profit is about Rs 85 crore in Q2 FY26 (955 less 870) and Rs 79 crore in Q1 FY27 (840 less 761). Mixing a margin of 19.7% on one measure with 15.3% on the other would suggest a collapse that did not happen. Revenue also has two versions: Rs 4,841 crore is revenue from operations and Rs 4,752 crore is net sales; Q1 FY27 shows Rs 5,000 crore and Rs 4,964 crore.
Q1 FY27 EBITDA of Rs 840 crore was below the poll estimate of Rs 870 crore. Kotak Neo described the quarter as missing street estimates despite healthy sales, while the stock rose on the profit growth.
What does the one available estimate say?
One preview expects Q2 FY27 revenue of Rs 5,432 crore, EBITDA of Rs 1,033 crore and profit of Rs 727 crore; the estimate implies a smaller margin than a year ago.
| Item (Rs crore) | Q2 FY26 | Q2 FY27E | YoY | Source note |
|---|---|---|---|---|
| Revenue | 4,841 | 5,432 | +12.2% | Zee Business preview |
| EBITDA | 955 | 1,033 | +8.2% | 19.0% margin implied |
| EBITDA margin | 19.7% | 19.0% | -70 bps | Estimate |
| Profit after tax | 655 | 727 | +11.0% | Estimate |
| Volume growth | — | About 10% | — | Estimate |
Cite this table: PositionalCalls, “PositionalCalls Britannia Q2 FY27 Estimate Table, as of 1 November 2026”.
This is one source, not a consensus, and I could not confirm its basis. The preview also cites pricing growth of about 13%, which does not fit 10% volume growth and 12.2% revenue growth, so I have not used it. Check other estimates before treating these as the street view.
Does the estimate fit the seasonal pattern?
| Step, Q1 to Q2 | FY26 actual | FY27 (estimate) | Note |
|---|---|---|---|
| Revenue | 4,622 to 4,841 (+4.7%) | 5,000 to 5,432 (+8.6%) | GST cut hit last year’s Q2 |
| EBITDA | 757 to 955 (+26.2%) | 840 to 1,033 (+23.0%) | Margin gain 330 vs 220 bps |
| Profit after tax | 520.13 to 655.06 (+25.9%) | 593.38 to 727 (+22.5%) | Estimate |
Cite this table: PositionalCalls, “PositionalCalls Britannia Seasonality Check, as of 1 November 2026”.
My calculation: the estimate assumes revenue climbs faster from Q1 to Q2 than last year, helped by the lower GST-hit base, while EBITDA climbs a little less. Margin is the swing factor.
PositionalCalls WhatsApp channel
Get the Britannia Q2 result note on 5 November
- Alerts when Britannia files its Thursday results
- The margin, volume and profit lines we check first
- A link when this page is updated with the numbers
What drives the margin: costs, pricing and volume?
Gross margin was 41.5% in Q1 FY27, up 120 bps on the year but down 60 bps on the quarter, and price rises offset only about half of input cost inflation.
- Input costs: Q1 FY27 reports cite cost pressure linked to the West Asia conflict. Commodity prices were stable a year earlier.
- Pricing: the Q1 slides say price increases, mainly through lower pack weights, offset about half of the inflation, and more pricing is expected.
- Volume: growth was close to 9% in Q1 FY27; the non-biscuit portfolio (cakes, rusk, wafers, dairy) grew in double digits.
- Base effects: Q2 FY26 gross margin was 41.7% and employee costs fell because the ESOP provision was Rs 5 crore against Rs 50 crore a year earlier. A GST cut covering about 85% of the portfolio trimmed Q2 FY26 revenue by roughly 2% to 2.5%.
Reading it together: revenue growth in Q2 FY27 may look better because last year’s base was depressed by the GST change, while margin growth may look worse because last year’s margin was lifted by cost savings. That is why the estimate has revenue up 12.2% but EBITDA up only 8.2%. See how another packaged-food name set up its quarter in our Marico Q2 FY27 preview.
What could Q2 profit look like? A sensitivity table
Under my arithmetic, Britannia Q2 results FY27 could show profit between about Rs 655 crore and Rs 736 crore; this is a sensitivity, not a forecast.
Assumptions: Q2 FY26 revenue from operations of Rs 4,840.63 crore grows by the stated rate; EBITDA is revenue times the stated margin; profit is 69.6% of EBITDA, the average of Q2 FY26 (68.6%) and Q1 FY27 (70.6%).
| Scenario | Revenue (Rs crore) | EBITDA margin | EBITDA (Rs crore) | Profit (Rs crore) vs 655 |
|---|---|---|---|---|
| A: +8% revenue, margin 18% | 5,228 | 18% | 941 | 655 (-0.0%) |
| B: +12.2% revenue, margin 19% (estimate-like) | 5,431 | 19% | 1,032 | 718 (+9.6%) |
| C: +12.2% revenue, margin 20% | 5,431 | 20% | 1,086 | 756 (+15.4%) |
| D: +15% revenue, margin 19% | 5,567 | 19% | 1,058 | 736 (+12.4%) |
Cite this table: PositionalCalls, “PositionalCalls Britannia Q2 FY27 Sensitivity Table, as of 1 November 2026”.
These are not estimates. One percentage point of margin on Rs 5,432 crore of revenue is about Rs 54 crore of EBITDA, or about Rs 38 crore of profit (my calculation). Judge Britannia Q2 results FY27 on margin and volume, not only on profit growth.
Three worked examples
- Flat revenue growth of 8%: Rs 4,840.63 crore times 1.08 is Rs 5,228 crore, so even 8% growth needs an 18% margin to keep profit near Rs 655 crore.
- Estimate check: Rs 5,432 crore times 19% is Rs 1,032 crore of EBITDA, close to the Rs 1,033 crore in the preview.
- Profit step: Rs 727 crore over Rs 593.38 crore is 1.225, a 22.5% rise from Q1; last year’s step was 25.9%.
Results-day decoder: what to read first
For Britannia Q2 results FY27, read volume growth and gross margin first, then EBITDA margin on a stated basis, then profit.
| What to read | Mark to beat | Question to ask |
|---|---|---|
| Revenue from operations | Rs 4,841 crore (year-ago); Rs 5,000 crore (Q1) | Is growth near the 12.2% estimate? |
| Volume growth | About 9% (Q1) | Did it reach about 10%? |
| Gross margin | 41.7% (year-ago); 41.5% (Q1) | Did pricing offset costs? |
| EBITDA margin | 19.7% (year-ago); 16.8% (Q1) | Which basis, and above 19%? |
| Profit after tax | Rs 655 crore (year-ago) | Above Rs 727 crore estimate? |
| Non-biscuit growth | Double digits (Q1) | Did cakes, rusk and dairy hold? |
Cite this table: PositionalCalls, “PositionalCalls Britannia Results-Day Decoder, as of 1 November 2026”.
How to read the result and what to avoid
To read Britannia Q2 results FY27, use the exchange filing and the company press release, and ignore any message that offers the result early.
- Open the BSE or NSE announcements page for Britannia and find the results filing.
- Read the consolidated statement, then the standalone one.
- Check the margin basis: operating profit or EBITDA.
- Compare revenue, volume and gross margin with the decoder.
- Note any exceptional items and employee-cost changes.
- Check the press release for pricing and cost commentary.
What it costs and what to avoid
Reading the result costs nothing. Dealing costs depend on your broker, so check the current charges schedule. Tax on dividends and gains follows the current rules, so see our capital gains tax on shares guide. Fake result alerts, “sure-shot” tips and KYC or OTP links circulate around FMCG results. Never share an OTP.
What most people miss
Analyst’s note
- What stands out: profit must climb about 22% from Q1 to Q2 to reach the Rs 727 crore estimate, in line with last year’s seasonal step of 26%.
- Easy to miss: the same GST change that lowered last year’s revenue makes this year’s revenue growth look stronger.
- What would change the view: an EBITDA margin below 18% on the data-site basis, or volume growth below 8%.
- Caution: the sensitivity table is my own arithmetic, not a forecast or target. This note is reasoning from reported figures.
- Reader action: on 5 November, match each headline to the margin and profit definitions above.
Bottom line
Britannia Q2 results FY27 are due on Thursday, 5 November 2026. The base is Rs 655 crore profit on a 19.7% margin, which was lifted by cost savings. One preview expects Rs 727 crore, but margins and the GST base effect cut in opposite directions, so read volume, gross margin and the margin basis first.
Next read: see all Q2 result dates on the calendar hub.
Part of the Earnings series.
PositionalCalls WhatsApp channel
Follow FMCG and consumer results on WhatsApp
- Results calendar changes across consumer companies
- Base-to-beat tables for packaged food and FMCG
- A link to each analysis when it is updated
FAQs on Britannia Q2 results FY27
When are Britannia Q2 results FY27 due?
Britannia’s board is scheduled to meet on Thursday, 5 November 2026 to approve standalone and consolidated results for the quarter and half-year ended 30 September 2026, per a Zee Business preview and a results calendar. One data platform shows 6 November, which is a projection. Confirm on the exchange page.
What is the base to beat for Britannia Q2 results FY27?
From Q2 FY26 the company reported consolidated revenue from operations of Rs 4,841 crore (net sales Rs 4,752 crore), operating profit of Rs 870 crore, EBITDA of about Rs 955 crore at a 19.7% margin and profit after tax of Rs 655 crore, up 23.2%.
What were Britannia’s Q1 FY27 results?
For the June 2026 quarter Britannia reported revenue from operations of Rs 5,000 crore (up 8.2%), net sales of Rs 4,964 crore (up 9.5%), EBITDA of about Rs 840 crore at 16.8% and profit after tax of Rs 593.38 crore, up 14.1%, on volume growth near 9%.
What do analysts expect from Britannia in Q2 FY27?
One preview, from Zee Business, expects revenue of Rs 5,432 crore (up 12.2%), EBITDA of Rs 1,033 crore at a 19% margin and profit of Rs 727 crore (up 11%). That is a single source, not a confirmed consensus, so check other estimates before relying on it.
Why do Britannia’s EBITDA and operating profit figures differ?
The company reports “profit from operations” (Rs 761 crore in Q1 FY27, 15.3% of sales), while data sites show EBITDA (Rs 840 crore, 16.8% of revenue). The gap is about Rs 79 crore, my calculation. Quote one measure with its margin basis.
Why was Britannia’s Q2 FY26 margin so high?
The company credited stable commodity prices and cost optimisation, and lower employee costs from a Rs 5 crore ESOP provision against Rs 50 crore a year earlier. Margin rose about 290 basis points to 19.7%, which makes Q2 FY27 a tough comparison.
Did the GST cut affect Britannia’s Q2 FY26 revenue base?
Yes. A broker note said the GST rate cut covered about 85% of Britannia’s portfolio and trimmed Q2 FY26 revenue by about 2% to 2.5%. Revenue grew just 3.7%, so Q2 FY27 growth is measured against a lower base.
Will Britannia declare a dividend with Q2 FY27 results?
I did not find a Q2 FY27 dividend notice, and the Q2 results are for the quarter and half-year. Only a board announcement can confirm one, so check the filing on 5 November.
Where can I read the official Britannia Q2 results?
Read the filing on the BSE and NSE corporate announcement pages and the press release on Britannia’s investor page. Compare the consolidated table with the base on this page, and ignore unofficial messages or screenshots that claim an early result.
Does this page give a Britannia Q2 results FY27 buy or sell call?
No. This is research and education, not advice. PositionalCalls.com is not a SEBI-registered research analyst or investment adviser. Use the numbers to frame questions and speak to a registered adviser before investing.
Sources
- Britannia Industries investor information, company website: results and press releases.
- NSE corporate announcements and BSE corporate announcements: the exchange filing.
- Kotak Neo, Upstox, Investing.com, Sahi and Ventura, Britannia Q1 FY27 results (6 to 7 August 2026)
- Zee Business, Britannia Q2 FY27 preview (30 October 2026)
- Sharekhan, Britannia Q2 FY26 note (13 November 2025); Business Standard and Zee Business, Q2 FY26 results (6 November 2025)
Editorial disclosure: PositionalCalls.com is not a SEBI-registered research analyst or investment adviser. Investments in securities markets are subject to market risks. Read all related documents carefully before investing. Returns are never guaranteed. PositionalCalls.com is an independent research and education site founded by Shubham Chaudhary. This page is not investment advice, a recommendation or a price target. How I researched this: I cross-checked Britannia’s Q1 FY27 and Q2 FY26 results across several news and research summaries and recalculated every derived figure. I did not open the exchange filings; own calculations are labelled.

Shubham Chaudhary is the founder of PositionalCalls, an independent Indian stock market research website. He writes company fundamentals, quarterly results analysis, IPO analysis and sector research for NSE and BSE listed companies, with a focus on banking stocks, insurance and long-term value investing. Every article is built from primary sources such as RBI, SEBI, NSE and BSE filings and company annual reports, and states its risks plainly in simple language for retail investors.
Coverage areas Our research standards- Numbers checked against NSE, BSE and SEBI filings
- Risks and limits stated in every article
- No paid promotions or broker tie-ups
- Articles updated when new filings arrive