
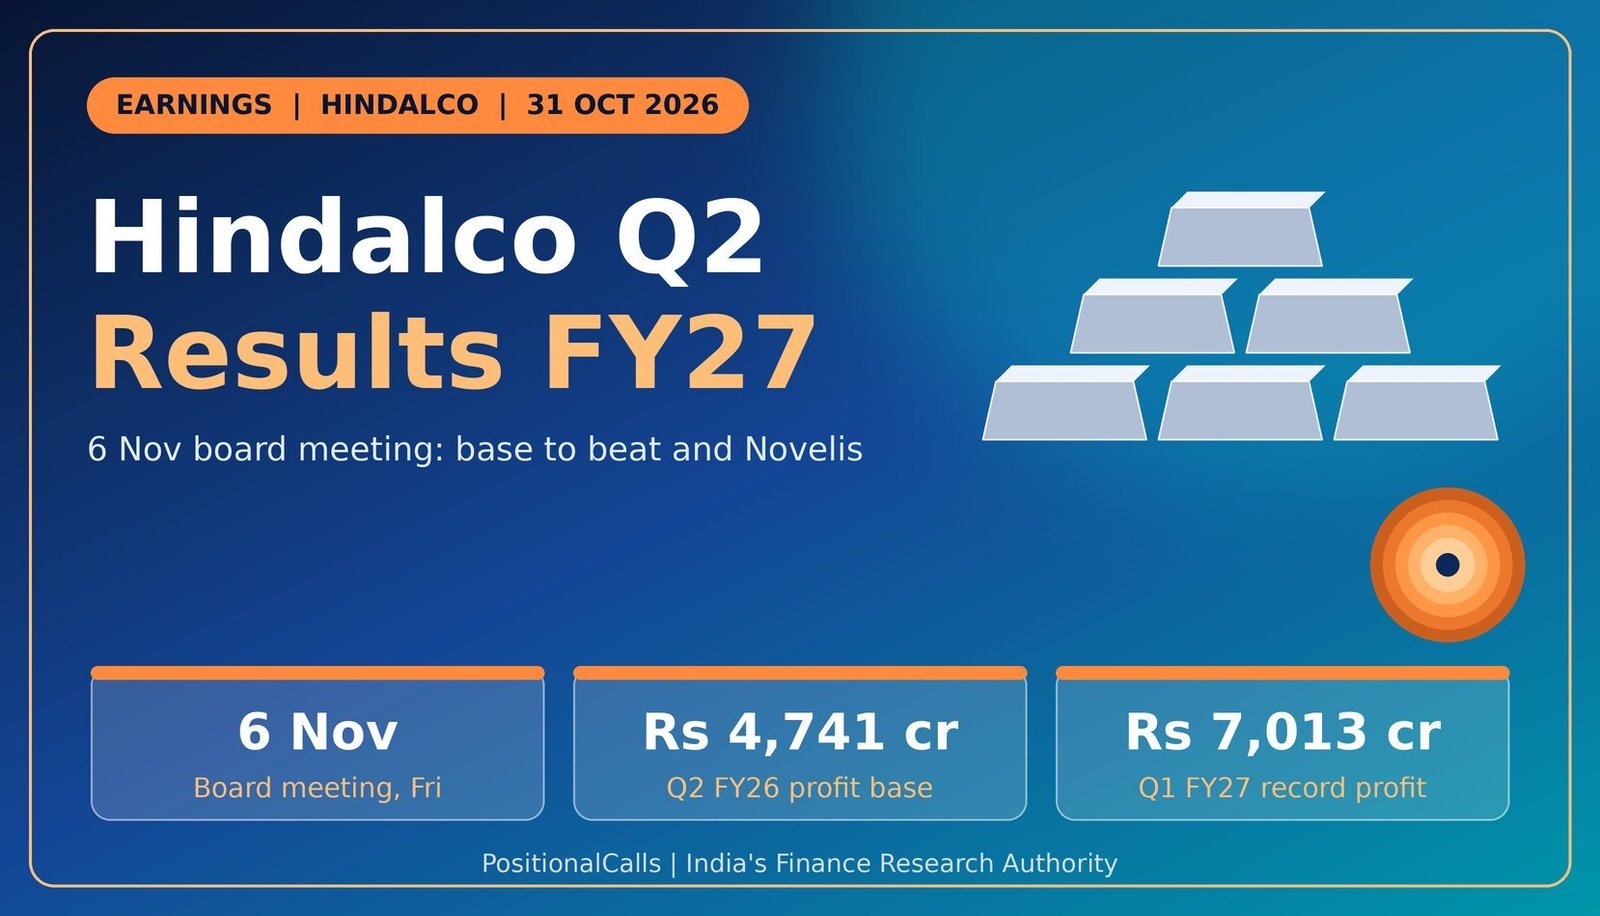
Earnings · Hindalco
Hindalco reports its September quarter on 6 November 2026, a day after its US unit Novelis is reported to share its own numbers. Here is the base, the Q1 record it must follow, three EBITDA figures that confuse readers and a checklist for the filing.
Quick answer
Hindalco Q2 results FY27 are due on Friday, 6 November 2026, when the board meets on September-quarter numbers. The base to beat is Rs 4,741 crore profit on Rs 66,058 crore revenue in Q2 FY26. Q1 FY27 set a record at Rs 7,013 crore. No analyst estimate for Q2 was found as of 31 October 2026.
Latest update (31 October 2026, 12:30 PM IST): Hindalco has told the exchanges its Q2 FY27 earnings call is on Friday, 6 November 2026 at 4:30 PM IST, in line with the board meeting date set on 25 September 2026. No Q2 FY27 numbers are out. This page converts into the results analysis on the day.
Key takeaways
- Date: board meeting and earnings call on Friday, 6 November 2026.
- Base (Q2 FY26): revenue Rs 66,058 crore (+13%), EBITDA Rs 9,684 crore, profit Rs 4,741 crore (+21%).
- Bar set by Q1 FY27: revenue Rs 84,825 crore (+32%), EBITDA Rs 14,989 crore (+73%), profit Rs 7,013 crore (+75%).
- Trap: three EBITDA figures (Rs 9,684, Rs 9,104 and Rs 8,966 crore) are quoted for Q2 FY26.
- Estimates: none found for Q2 FY27; for Q1 the street expected Rs 5,817 crore and the result was Rs 7,013 crore.
In plain words: Hindalco makes aluminium and copper in India and owns Novelis, a large US maker of rolled aluminium. A “base to beat” is last year’s same quarter. EBITDA is operating profit before interest, tax, depreciation and amortisation, and each source builds it a little differently.
Data note: as of 31 October 2026, 12:30 PM IST. Figures follow Hindalco’s press releases for Q2 FY26 (7 November 2025) and Q1 FY27 (7 August 2026) as carried in search results and reports; I have not opened the full releases or the exchange filings. Novelis reports under US GAAP. The estimate for Q1 FY27 is from one report. Derived numbers are labelled “my calculation”.
When will Hindalco announce its Q2 FY27 results?
Hindalco’s board meets on Friday, 6 November 2026 to approve results for the quarter and half year ended 30 September 2026, with an earnings call at 4:30 PM IST the same day.
The board date was set on 25 September 2026 and the call was confirmed in a filing on 30 October 2026, as reported. One weekly list shows Hindalco under 2 November, but the company’s own notice and the call intimation both say 6 November, so treat the list as an error and confirm in the exchange filing. Results usually reach the exchanges in the afternoon or evening, before the call.
Novelis usually reports a few days before Hindalco. Last year its call was on Tuesday, 4 November 2025, three days ahead of Hindalco. Because Novelis is the larger part of Hindalco’s revenue, its numbers are the best early read on the Hindalco print. Other results in the same window are tracked on the Q2 results calendar hub, including Tata Steel Q2 results FY27, whose date is reported for Saturday, 7 November 2026.
What is the base to beat in the Hindalco Q2 results FY27?
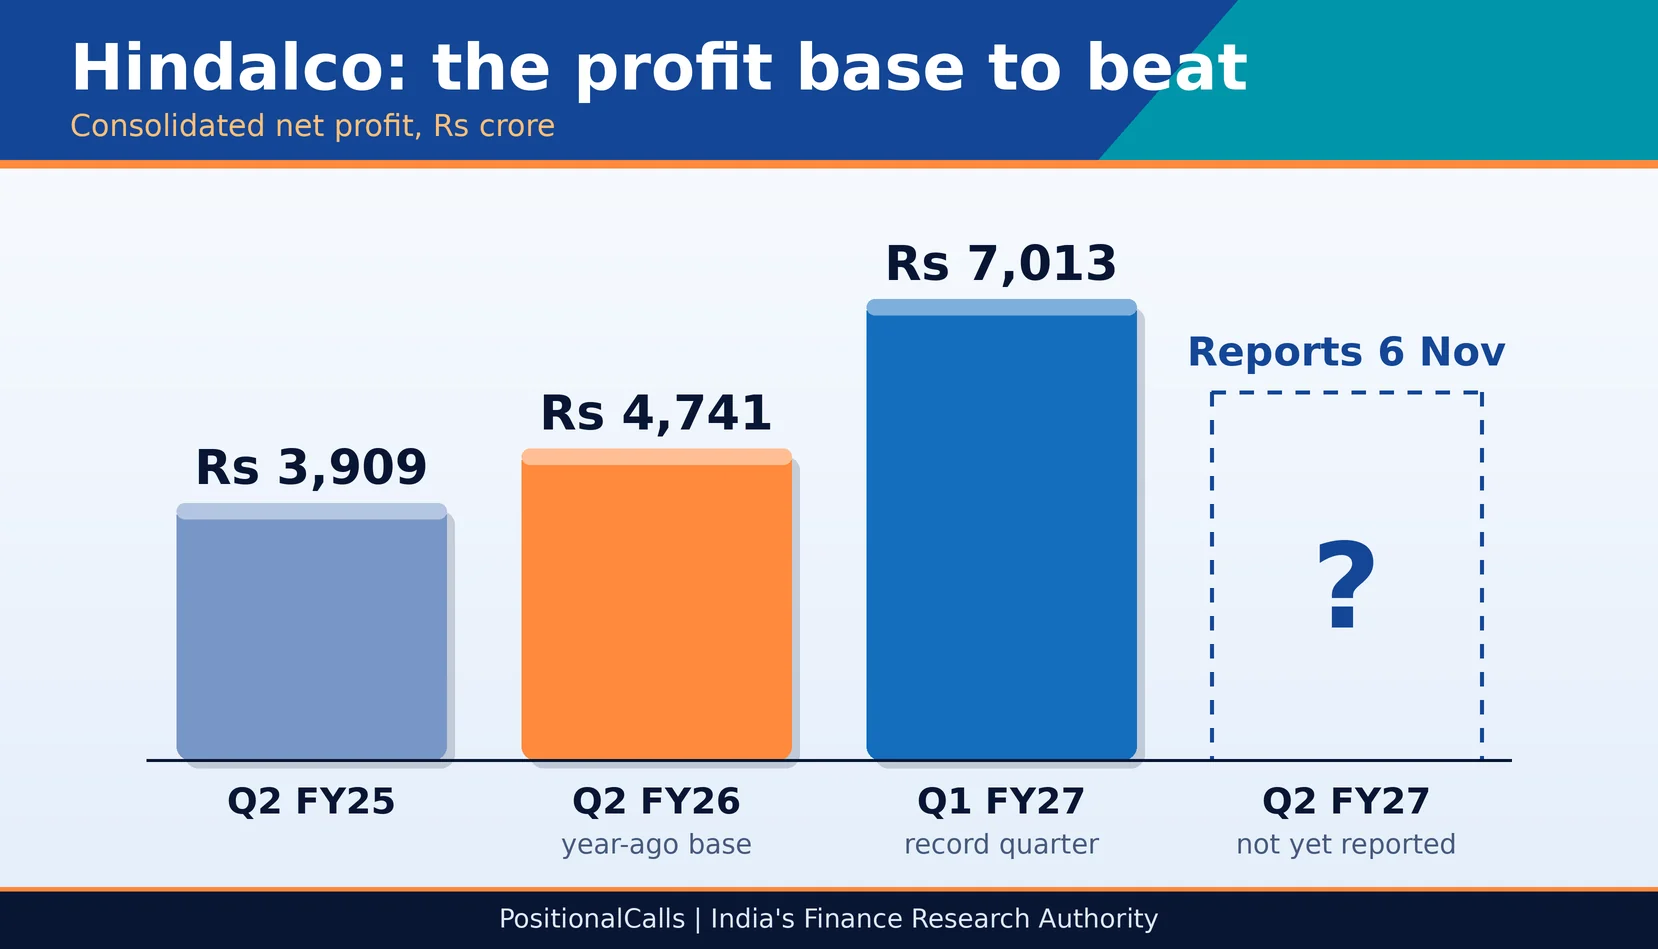
The Q2 FY26 base is consolidated revenue from operations of Rs 66,058 crore, EBITDA of Rs 9,684 crore and net profit of Rs 4,741 crore, up 21% from Rs 3,909 crore a year before.
| Consolidated, Rs crore | Q2 FY25 | Q2 FY26 (base) | Change | Why it matters |
|---|---|---|---|---|
| Revenue from operations | 58,203 | 66,058 | +13% | Headline sales line |
| EBITDA | 9,100 | 9,684 | +6% | Company headline; sources differ |
| Net profit | 3,909 | 4,741 | +21% | The number growth is measured against |
| EBITDA margin (my calculation) | 15.6% | 14.7% | −0.9 points | Margin slipped as revenue rose |
| Aluminium upstream EBITDA | 3,709 | 4,524 | +22% | India’s strongest segment |
| Aluminium downstream EBITDA | 154 (derived) | 261 | +69% | Record at the time |
| Copper EBITDA | about 834 (derived) | 634 | −24% | Weak refining charges |
Cite this table: PositionalCalls, “Hindalco Q2 FY26 Base-to-Beat Table, as of 31 October 2026”.
Two derived rows need a note. The Q2 FY25 downstream and copper figures are backed out from the reported growth rates (261 / 1.69 and 634 / 0.76) and are rounded; treat them as approximate. The margin row divides EBITDA by revenue from operations, which is my own calculation: 9,100 / 58,203 and 9,684 / 66,058.
Which Hindalco EBITDA figure is right? The definitions trap
Compare like with like: Q2 FY26 consolidated EBITDA appears as Rs 9,684 crore, Rs 9,104 crore and Rs 8,966 crore, and Novelis adjusted EBITDA as $422 million and $476 million, so name the line before you call a beat.
| Line | Figures in circulation | What it likely means | What to do |
|---|---|---|---|
| Q2 FY26 consolidated EBITDA | Rs 9,684 crore; Rs 9,104 crore; Rs 8,966 crore | Company headline; a business-segment total; an aggregator’s operating profit excluding other income (my reading, not confirmed) | Use Rs 9,684 crore with the company release |
| Q2 FY26 Novelis adjusted EBITDA | $422 million ($448 a tonne); $476 million ($506 a tonne) | Release figure versus a figure excluding tariff impact, per one call summary | Match the basis on both sides |
| Net debt to EBITDA, 30 Sep 2025 | 1.23x; 1.02x | Press release versus one call summary; Q1 FY27 compares 1.95x with 1.02x for 30 Jun 2025 | Quote the date with the ratio |
| Q1 FY27 EBITDA | Rs 14,989 crore; Rs 13,932 crore; Rs 12,690 crore | Company release; aggregator operating profit; a results page that looks wrong | Use the company release |
| Q1 FY27 revenue | Rs 84,825 crore; Rs 85,882 crore | Revenue from operations versus total income | Use revenue from operations |
Cite this table: PositionalCalls, “Hindalco EBITDA Definitions Table, as of 31 October 2026”.
This is why results-night headlines disagree. A line that adds other income will always sit above one that does not. Novelis also reports under US GAAP in dollars, while Hindalco converts it into Ind AS rupees, so a dollar growth rate and a rupee growth rate for the same unit can differ. Read the filing note that reconciles the two before comparing.
What bar did Q1 FY27 set for Hindalco?
Q1 FY27 was a record: revenue of Rs 84,825 crore (+32%), EBITDA of Rs 14,989 crore (+73%) and net profit of Rs 7,013 crore (+75%), well above the Rs 5,817 crore the street expected.
| Consolidated, Rs crore | Q1 FY26 | Q1 FY27 | Change | Note |
|---|---|---|---|---|
| Revenue from operations | 64,232 | 84,825 | +32% | Record quarter |
| EBITDA | 8,673 | 14,989 | +73% | All-time high |
| PBDT | 7,919 | 14,023 | +77% | Before depreciation, after interest and tax |
| Net profit | 4,004 | 7,013 | +75% | Record; one estimate was Rs 5,817 crore |
| EBITDA margin (my calculation) | 13.5% | 17.7% | +4.2 points | Large step up |
| Net debt to EBITDA | 1.02x | 1.95x | Higher | Capex and Novelis investment |
| Standalone net profit | 1,862 | 4,784 | +157% (my calculation) | Hindalco India alone |
Cite this table: PositionalCalls, “Hindalco Q1 FY27 Table, as of 31 October 2026”.
The Q1 profit beat the one reported estimate by about 20.6% (my calculation: 7,013 / 5,817). Leverage nearly doubled to 1.95x, which matters because Hindalco is spending heavily on new capacity. Q2 will be read against two bars: last year’s Rs 4,741 crore and the Rs 7,013 crore it just delivered. The Q1 figures come from company releases as carried by reports; exceptional costs tied to the Oswego plant fires were mentioned alongside them.
Why does Novelis decide the Hindalco print?
Novelis accounted for about 63% of Hindalco’s segment revenue in Q1 FY27 against 61% a year earlier, so Novelis shipments, margin per tonne and aluminium prices move the group number most.
| Novelis (US GAAP) | Q2 FY26 | Q1 FY27 | Reading |
|---|---|---|---|
| Net sales | $4.7 billion | $5.8 billion (+23% YoY) | Higher aluminium prices |
| Adjusted EBITDA | $422 million | $516 million (+24% YoY) | Release basis |
| Adjusted EBITDA per tonne | $448 (release); $506 excluding tariffs | $563 | Management targeted about $500 for FY27 |
| Shipments | 941 thousand tonnes | Lower, due to the Oswego fires | Volume is the open question |
| Net income | not captured | $164 million (+71% YoY) | Strong Q1 |
Cite this table: PositionalCalls, “Novelis Read-Across Table, as of 31 October 2026”.
Management said in May 2026 that it expected Novelis to earn about $500 a tonne in fiscal 2027 and that “the worst is over” for the unit. Q1 delivered $563 a tonne, already above that mark. If Novelis’ Q2 number lands near or above $563, the rupee EBITDA for Hindalco will be driven by a stronger rupee value of that dollar profit as well. Check the dollar-rupee rate in the filing note.
How is Hindalco’s India business placed for Q2 FY27?
The India business earned EBITDA of Rs 5,419 crore in Q2 FY26 (+15%) and profit of Rs 3,059 crore (+7%), with upstream aluminium the engine and copper the weak spot.
| India business, Q2 FY26 | Figure | Change | What to watch |
|---|---|---|---|
| India business EBITDA | Rs 5,419 crore | +15% | Compare on the same definition |
| India business net profit | Rs 3,059 crore | +7% | Smaller rise than EBITDA |
| Aluminium upstream revenue | Rs 10,078 crore (341 KT) | +10% (my calculation) | LME aluminium price and costs |
| Aluminium upstream EBITDA | Rs 4,524 crore | +22% | Coal and power costs |
| Aluminium downstream EBITDA | Rs 261 crore | +69% | New rolling capacity ramp-up |
| Copper EBITDA | Rs 634 crore | −24% | Refining charges; management guided Rs 600 to 700 crore a quarter |
Q1 FY27 standalone profit rose to Rs 4,784 crore from Rs 1,862 crore, so India also stepped up. One risk flagged in reports is higher raw-material cost such as coal. The detail by segment for Q1 FY27 was not in the sources I saw, so I have not tabulated it.
PositionalCalls WhatsApp channel
Hindalco and Novelis results, decoded fast
- Novelis read-across before the Hindalco filing
- EBITDA and profit shown on the right definition
- Corrections flagged openly if numbers change
What does the H1 FY27 arithmetic look like for Hindalco?
Q1 FY27 already gives H1 revenue of Rs 84,825 crore, so even a flat Q2 revenue of Rs 66,058 crore would put H1 revenue up 15.8%, while H1 profit would be up 34.4% if Q2 profit only equals the base (my calculations).
| Q2 FY27 revenue case | Q2 revenue (Rs crore) | H1 FY27 revenue (Rs crore) | H1 growth vs Rs 1,30,290 crore |
|---|---|---|---|
| Flat on Q2 FY26 | 66,058 | 1,50,883 | +15.8% |
| +15% | 75,967 | 1,60,792 | +23.4% |
| +25% | 82,573 | 1,67,398 | +28.5% |
| +32% (Q1 growth rate) | 87,197 | 1,72,022 | +32.0% |
| Q2 FY27 profit case | Q2 vs Rs 4,741 cr | H1 FY27 profit (Rs crore) | H1 growth vs Rs 8,745 cr |
|---|---|---|---|
| Rs 4,741 crore (flat) | 0% | 11,754 | +34.4% |
| Rs 5,500 crore | +16.0% | 12,513 | +43.1% |
| Rs 6,000 crore | +26.6% | 13,013 | +48.8% |
| Rs 7,013 crore (equal to Q1) | +47.9% | 14,026 | +60.4% |
Cite this table: PositionalCalls, “Hindalco H1 FY27 Scenario Tables, as of 31 October 2026”.
Assumptions: H1 FY26 revenue of Rs 1,30,290 crore and H1 FY26 profit of Rs 8,745 crore, which adds Q1 FY26 profit of Rs 4,004 crore to Q2 FY26 profit of Rs 4,741 crore (my calculation). These tables show arithmetic, not forecasts; none of the cases is a prediction.
What is each point of Hindalco margin worth in rupees?
On Rs 84,825 crore of revenue, one point of EBITDA margin is worth about Rs 848 crore, so moving from the Q2 FY26 margin of 14.7% to Q1 FY27’s 17.7% is worth about Rs 2,545 crore of EBITDA (my calculations).
| EBITDA margin | EBITDA on Rs 84,825 crore revenue | Reading |
|---|---|---|
| 14.7% | Rs 12,469 crore | Q2 FY26 margin |
| 16.0% | Rs 13,572 crore | Mid case |
| 17.7% | Rs 15,014 crore | Q1 FY27 margin |
Cite this table: PositionalCalls, “Hindalco Margin in Rupees Table, as of 31 October 2026”.
The revenue figure is Q1 FY27’s, used only to size the margin effect. Actual Q2 revenue will differ. The point is that a swing of a few points in margin moves EBITDA by thousands of crores, so margin, not revenue, will decide how the quarter reads.
Is there an analyst estimate for Hindalco Q2 FY27?
No Q2 FY27 profit or EBITDA estimate was found as of 31 October 2026, so compare the result with the base and with Q1, not with a consensus.
I searched for a preview from brokerages and found none for Q2 FY27, so I have not quoted one. For Q1 FY27 the reported street estimate of Rs 5,817 crore was about 17% below the Rs 7,013 crore result (my calculation: 5,817 / 7,013 = 0.83). A single estimate can be far from the print in either direction. When a preview appears this page will show its source, date and base, and say whether it uses the owners’ profit or profit including minority interest.
How should you read the Hindalco filing on results day?
Read revenue, EBITDA and profit on the company’s own definition first, then Novelis in dollars and rupees, then leverage and the notes on exceptional items.
| What to read | Mark to compare | Question to ask |
|---|---|---|
| Consolidated revenue from operations | Rs 66,058 crore (Q2 FY26); Rs 84,825 crore (Q1 FY27) | Is growth price-led or volume-led? |
| Consolidated EBITDA | Rs 9,684 crore; Rs 14,989 crore | Which definition does the release use? |
| Net profit | Rs 4,741 crore; Rs 7,013 crore | Any exceptional items in the notes? |
| Novelis adjusted EBITDA per tonne | $448 / $506; $563 in Q1 FY27 | Above the $500 target? |
| India business EBITDA | Rs 5,419 crore (Q2 FY26) | Did upstream aluminium hold up? |
| Copper EBITDA | Rs 634 crore; guided Rs 600 to 700 crore | Did refining charges hurt? |
| Net debt to EBITDA | 1.95x at 30 Jun 2026 | Did leverage rise or ease? |
Cite this table: PositionalCalls, “Hindalco Results-Day Decoder, as of 31 October 2026”.
What do most people miss about Hindalco’s Q2 numbers?
Most miss that the base is Q2 FY26 and not Q1 FY27’s record, that EBITDA has three versions and that Novelis, reported first, will tell you most of the story.
- Compare Q2 FY27 with Q2 FY26 first, then with Q1 FY27.
- Note which EBITDA definition the release uses.
- Read Novelis in dollars before reading Hindalco in rupees.
- Check the notes for exceptional items such as Oswego costs.
- Confirm the date and call time in the exchange filing.
What do you need to know about costs, tax and safety?
Hindalco shares are traded like any listed stock, so brokerage, taxes and your holding period matter more than the quarterly headline; never pay anyone for results alerts.
- What you need: a demat and trading account; the results do not change the settlement cycle, which is T+1.
- Costs: check your broker’s current charge schedule for brokerage, STT, GST and stamp duty on each trade.
- Tax angle: gains on shares are taxed by holding period; see capital gains tax on shares for the current rates and worked examples. Check the rules or ask a tax adviser.
- NRI note: non-residents invest through specific accounts and limits; see NRI investment in the Indian stock market.
- Scam warning: fake results alerts, paid “sure-shot” tips and KYC links on messaging apps are common. Never share an OTP.
Other large names report in the same window; see ITC Q2 results FY27 and Coal India Q2 results FY27. For metals context read our Tata Steel Q3 results, JSW Steel Q3 results and the Hindalco Q3 results FY26 pages. Muhurat trading falls on Sunday, 8 November 2026; see Muhurat trading 2026.
Analyst’s note
- What stands out: in the Hindalco Q2 results FY27, the base is moderate (Rs 4,741 crore) but the bar is high, because Q1 FY27 delivered Rs 7,013 crore.
- Easy to miss: H1 profit growth is already large on any Q2 outcome, so the half-year headline will look strong even if Q2 falls from Q1.
- What would change the view: a Novelis margin per tonne below $500 or a sharp rise in net debt would point to pressure beneath the headline.
- Caution: this is reasoning from reported numbers, not a forecast. No outcome is assured.
- Reader action: read Novelis first, then the Hindalco filing, and match the EBITDA definition.
Bottom line
Hindalco Q2 results FY27 are due on 6 November 2026. The base is Rs 4,741 crore profit on Rs 66,058 crore revenue; Q1 FY27 set a record at Rs 7,013 crore; and EBITDA appears in three versions for Q2 FY26. No analyst estimate was found. Confirm the date and definitions in the filing.
Next read: Tata Steel Q2 results FY27: date, base and what to read
Part of the Earnings series. The earlier quarter is covered on the Hindalco Q3 results page.
PositionalCalls WhatsApp channel
Metals results, without the noise
- Novelis and Hindalco numbers side by side
- Plain-language summaries of each filing
- Dates and corrections flagged the moment they change
Frequently asked questions
When are the Hindalco Q2 results FY27?
Hindalco’s board meets on Friday, 6 November 2026 to approve results for the quarter ended 30 September 2026, with an earnings call at 4:30 PM IST. The date was set on 25 September 2026. Confirm in the exchange filing.
What is the Hindalco Q2 results FY27 profit base?
The Q2 FY26 base is consolidated net profit of Rs 4,741 crore, up 21% from Rs 3,909 crore, on revenue of Rs 66,058 crore. EBITDA was Rs 9,684 crore on the company headline, though other sources show lower figures.
What did Hindalco report in Q1 FY27?
Hindalco reported record Q1 FY27 numbers: revenue of Rs 84,825 crore (+32%), EBITDA of Rs 14,989 crore (+73%) and net profit of Rs 7,013 crore (+75%), per its 7 August 2026 release. Net debt to EBITDA was 1.95x.
Is there an analyst estimate for Hindalco Q2 profit?
No Q2 FY27 profit estimate was found as of 31 October 2026. For Q1 FY27 one report put the street estimate at Rs 5,817 crore against an actual of Rs 7,013 crore. Compare with the base instead.
Why do Hindalco EBITDA figures differ across reports?
Q2 FY26 EBITDA appears as Rs 9,684, Rs 9,104 and Rs 8,966 crore because sources use different lines, such as including or excluding other income. Use the company release and match the definition on both sides.
When will Novelis report Q2 FY27 results?
One site reports Novelis’ Q2 FY27 earnings call for Thursday, 5 November 2026. Hindalco filed an intimation on 29 October 2026. Last year Novelis reported on 4 November 2025, three days before Hindalco.
How much of Hindalco comes from Novelis?
Novelis was about 63% of segment revenue in Q1 FY27 against 61% a year earlier, as reported. Its dollar results, under US GAAP, therefore drive the group result, along with the exchange rate.
What is Hindalco’s net debt to EBITDA?
It was 1.95x at 30 June 2026 against 1.02x a year earlier, per the Q1 FY27 release. For 30 September 2025 the Q2 FY26 release showed 1.23x. Always check the date attached to the ratio.
How did Hindalco’s India business perform in Q2 FY26?
India business EBITDA rose 15% to Rs 5,419 crore and profit rose 7% to Rs 3,059 crore. Aluminium upstream EBITDA was Rs 4,524 crore, downstream Rs 261 crore and copper Rs 634 crore.
Where do I check the official Hindalco results?
Open the NSE or BSE announcements for HINDALCO or the company’s press-release page at hindalco.com. News reports differ on EBITDA definitions, so use the filing and press release as the final source.
Sources
- Hindalco press release, Q2 FY26 results, 7 November 2025
- Hindalco press release, Q1 FY27 results, 7 August 2026
- Novelis press release, Q2 FY26 results
- Novelis Form 10-Q, quarter ended 30 June 2026 (SEC)
- Business Standard, FilingReader, Kotak Neo, Upstox, Kalkine and Screener (secondary and aggregator, not linked)
Editorial disclosure. PositionalCalls.com is not a SEBI-registered research analyst or investment adviser. Investments in securities markets are subject to market risks. Read all related documents carefully before investing. Returns are never guaranteed. This page is educational, is independent and was written by Shubham Chaudhary, founder of PositionalCalls. How I researched this: I compared company press releases as carried in search results with news reports, recomputed every derived number and labelled conflicting figures. Corrections are published in the Data note.

Shubham Chaudhary is the founder of PositionalCalls, an independent Indian stock market research website. He writes company fundamentals, quarterly results analysis, IPO analysis and sector research for NSE and BSE listed companies, with a focus on banking stocks, insurance and long-term value investing. Every article is built from primary sources such as RBI, SEBI, NSE and BSE filings and company annual reports, and states its risks plainly in simple language for retail investors.
Coverage areas Our research standards- Numbers checked against NSE, BSE and SEBI filings
- Risks and limits stated in every article
- No paid promotions or broker tie-ups
- Articles updated when new filings arrive