
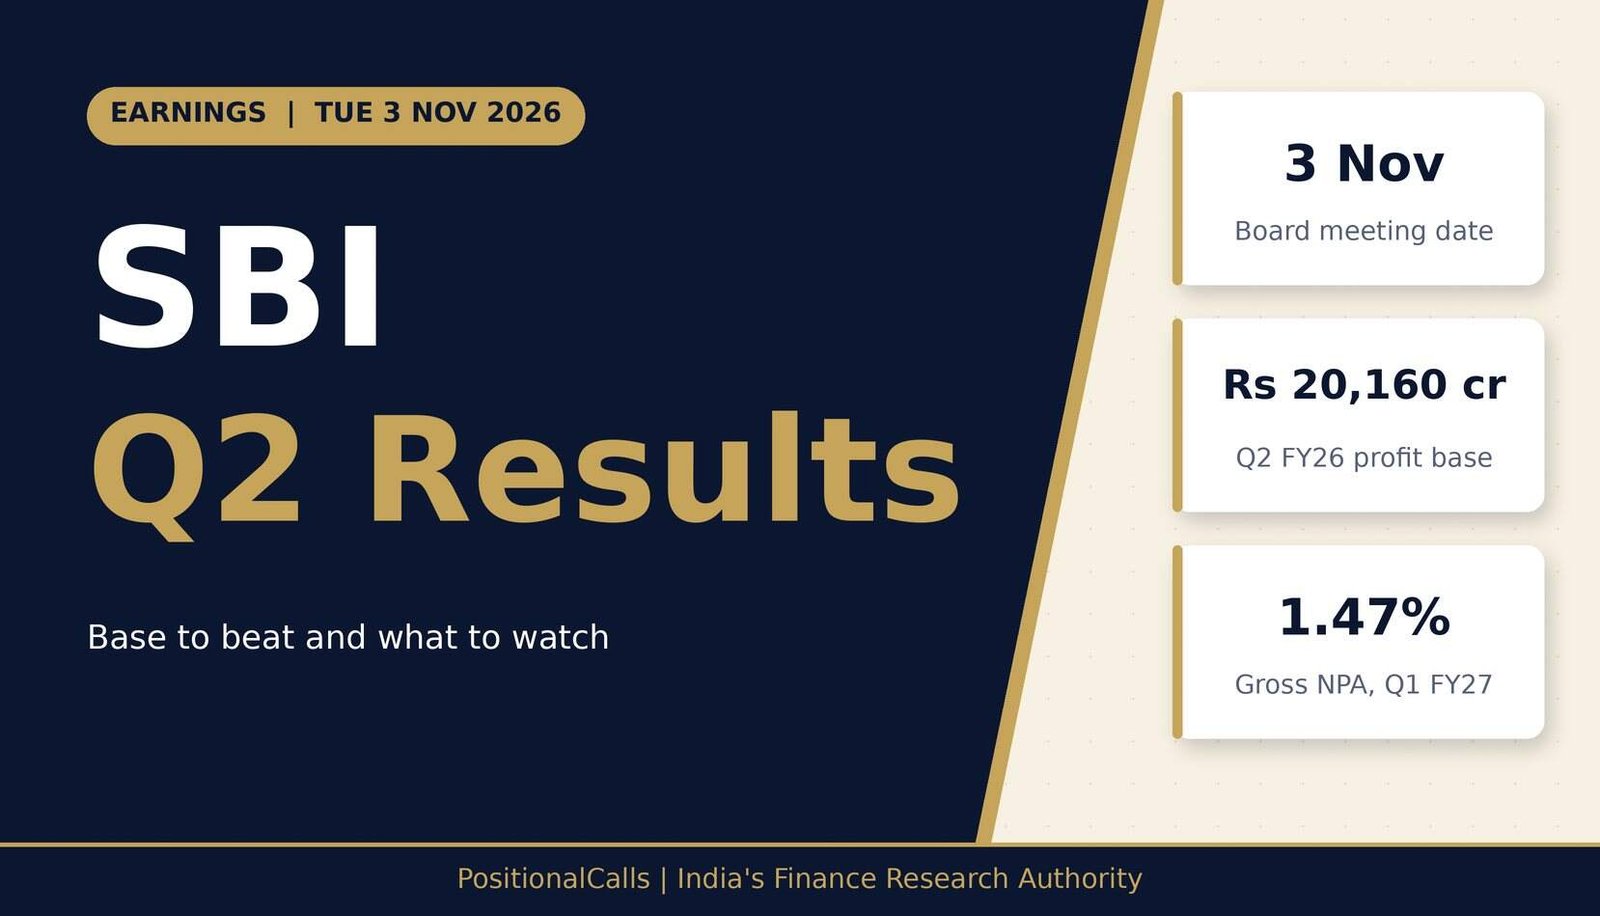
Earnings · State Bank of India
State Bank of India reports its September-quarter numbers on 3 November 2026. Here are the date, the base to beat with its one-off gain, the margin and asset-quality marks, and the figures to read first.
Quick answer
SBI Q2 results are due on Tuesday, 3 November 2026. The base to beat is Rs 20,160 crore standalone net profit in Q2 FY26, which included a Rs 4,593 crore Yes Bank stake-sale gain, and a record Rs 21,121 crore in Q1 FY27. Domestic NIM was 3.00% in Q1.
Latest update (Friday, 30 October 2026, 3:45 PM IST): The results are not out. PSU Connect reported that the SBI board meets on 3 November with an analyst meet at 5:15 PM; the filing time is not announced. This page becomes the live analysis after the filing.
Earlier entries:
- Monday, 26 October 2026, 7:19 PM IST: PSU Connect reported that SBI told the exchanges of the 3 November board meeting.
- Friday, 7 August 2026: SBI reported record Q1 FY27 profit of Rs 21,121 crore, as carried by ANI.
Key takeaways
- Date: board meeting on Tuesday, 3 November 2026, analyst meet at 5:15 PM, as reported from the exchange intimation.
- High base: Q2 FY26 profit of Rs 20,160 crore included a Rs 4,593 crore Yes Bank stake-sale gain.
- Flat quarter: Q1 FY27 profit of Rs 21,121 crore is already 4.8% above that base (my calculation).
- Margin and asset quality: domestic NIM 3.00%, gross NPA 1.47%, net NPA 0.38% in Q1 FY27.
- Estimates: no SBI-specific estimate found; two sector previews expect margins to ease.
In plain words: A results preview is a checklist made before the numbers arrive. For a bank it means four marks: profit, margin, bad loans and loan growth. Knowing last year’s marks lets you judge the new figures in minutes.
Data note: Figures are as of Friday, 30 October 2026, 3:45 PM IST. The results date comes from one secondary report of the exchange intimation; the filing itself was not opened for this page. Base figures are company results as reported by ANI, Business Today and Multibagg. Estimates are sector-level, not SBI-specific. Derived numbers are my calculation.
When are the SBI Q2 results?
The SBI Q2 results date is Tuesday, 3 November 2026. The Central Board meets in Mumbai to consider results for the quarter and half-year ended 30 September 2026, and an analyst meet follows at 5:15 PM.
PSU Connect reported at 7:19 PM IST on Monday, 26 October 2026 that SBI had informed the exchanges under Regulations 29 and 50 of the SEBI listing rules. The report gives no filing reference and does not say whether the board will take up standalone or consolidated results, so confirm the date on the BSE or NSE announcement page. The trading window for insiders has been closed since 1 October and reopens 48 hours after the results.
The filing time is not announced. Last year Business Today carried the Q2 FY26 numbers at 2:32 PM IST on Tuesday, 4 November 2025, so an afternoon release is possible. It is not confirmed for this year.
What will the board approve?
The board will consider the results for the quarter and half-year ended 30 September 2026. SBI files standalone and consolidated statements, and its headline profit has been the standalone figure. SEBI’s listing regulations give 45 days after quarter-end, which is 14 November 2026 for this quarter (my calculation), so 3 November is well inside the limit.
Is the date confirmed?
| Fact | Source | Status | What to do |
|---|---|---|---|
| Board meeting on Tuesday, 3 November 2026 | PSU Connect (26 Oct 2026, 7:19 PM IST) | Single secondary report of the intimation | Open the BSE or NSE filing to confirm |
| Analyst meet at 5:15 PM, State Bank Bhavan, Mumbai | PSU Connect | Single source | Watch the SBI investor page |
| Trading window reopens 48 hours after results | PSU Connect | Single source | Not needed for readers |
Cite this table: PositionalCalls, “SBI Q2 FY27 Date Check, as of 30 October 2026”.
Treat any article that gives another date as unreliable until you see the filing. Subsidiaries such as SBI Life and SBI Cards publish their own results on their own dates, and those dates do not move SBI’s.
What is the base to beat for the SBI Q2 results?
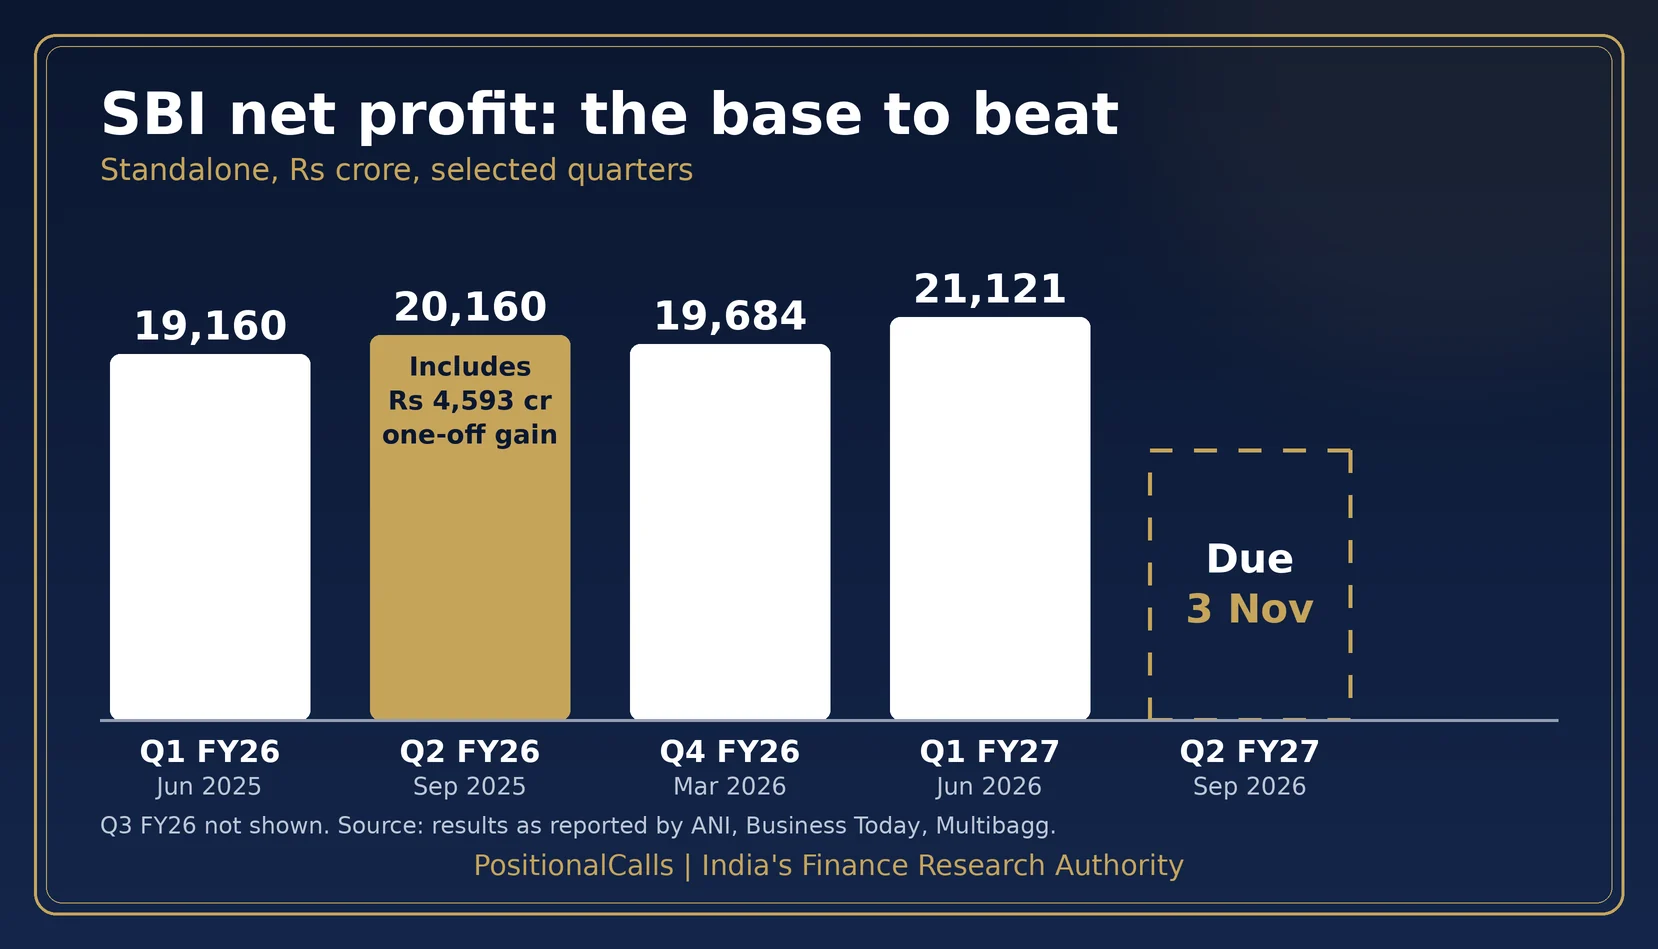
The base to beat is Q2 FY26 standalone net profit of Rs 20,160 crore, which included a Rs 4,593 crore Yes Bank stake-sale gain, and last quarter’s record Rs 21,121 crore.
| Measure (standalone) | Q1 FY26 (Jun 2025) | Q2 FY26 (Sep 2025) | Q1 FY27 (Jun 2026) |
|---|---|---|---|
| Net profit, Rs crore | 19,160 | 20,160 | 21,121 |
| Net interest income, Rs crore | 40,907 | 42,984 | 46,992 |
| Domestic NIM | 3.01% | 3.09% | 3.00% |
| Gross NPA ratio | 1.83% | 1.73% | 1.47% |
| Net NPA ratio | 0.47% | 0.42% | 0.38% |
| Deposit growth, year on year | Not in sources | 9.27% | 9.73% |
| CASA ratio | Not in sources | 39.63% | 39.24% |
Cite this table: PositionalCalls, “SBI Base-to-Beat Table, as of 30 October 2026”.
Here is the first useful sum. Q1 FY27 profit of Rs 21,121 crore is already +4.8% above Q2 FY26’s Rs 20,160 crore (21,121 divided by 20,160, my calculation). A flat quarter therefore shows about 5% growth, and the base contains a one-off. Q4 FY26 profit was Rs 19,684 crore, so Q1 FY27 rose 7.3% on the quarter.
How big is the one-off in the Q2 FY26 base?
Business Today reported a gain of Rs 4,593.22 crore from the sale of a 13.18% stake in Yes Bank in Q2 FY26. It does not say whether the amount is before or after tax. The table shows what a flat Q2 FY27 profit would mean against three versions of the base. The tax rate is my assumption, not SBI’s disclosed treatment.
| Version of the Q2 FY26 base | Base profit, Rs crore | Flat Q2 FY27 profit (Rs 21,121 crore) vs base |
|---|---|---|
| As reported | 20,160 | +4.8% |
| Full gain removed, no tax effect (illustration) | 15,567 | +35.7% |
| Gain removed after an assumed 25.17% tax (illustration) | 16,723 | +26.3% |
Cite this table: PositionalCalls, “SBI Q2 FY26 One-Off Base Illustration, as of 30 October 2026”.
Do not treat the second and third rows as SBI’s adjusted profit. Other items in the quarter are not removed, and the filing notes carry the exact one-off effect. The point is the size: the reported YoY growth for Q2 FY27 will look modest next to the underlying trend.
What does net interest income show?
Net interest income, or NII, is interest earned minus interest paid. Q1 FY27 NII of Rs 46,992 crore is already +9.3% above Q2 FY26’s Rs 42,984 crore (my calculation). NII is the cleaner line, because it carries no stake-sale gain.
SBI Q2 results preview: what do analysts expect?
No SBI-specific Q2 FY27 estimate was found for this page. JM Financial (11 October 2026) expects margins to fall sequentially at most banks, and Systematix (6 October 2026) expects its bank coverage profit to rise 14.9% on the year, excluding IndusInd Bank.
| Item | Reported sector view | Source and date | Note |
|---|---|---|---|
| Profit growth | +14.9% year on year for the coverage, excluding IndusInd Bank | Systematix via ANI, 6 Oct 2026 | Not an SBI figure |
| NIM | About 7 bps lower on average; falling at most banks | Systematix, 6 Oct; JM Financial, 11 Oct 2026 | Liquidity, deposit costs, slow CASA growth |
| Operating profit and costs | Operating profit about +8%, costs about +7% on the year | JM Financial, 11 Oct 2026 | Sector estimate |
| Asset quality | Stable; slippages flat or lower; collection efficiency about 99% | Systematix; JM Financial | Credit costs broadly stable |
| SBI-specific estimate | None found | Not applicable | Do not read sector numbers as SBI’s |
Cite this table: PositionalCalls, “SBI Q2 FY27 Reported Sector Views, as of 30 October 2026”.
SBI NIM Q2 FY27: what to expect
Net interest margin, or NIM, is NII as a share of earning assets. SBI’s domestic NIM was 3.00% in Q1 FY27, up 7 basis points on the quarter on lower deposit costs, and global NIM was 2.86%. Management reaffirmed about 3% for FY27 on the August call. If SBI follows the sector average of a 7 bps fall, domestic NIM would be about 2.93%, which is 16 bps below Q2 FY26’s 3.09% (my calculation).
What does deposit growth say?
SBI’s deposits grew 9.73% year on year in Q1 FY27 but only 0.5% on the quarter, and management said it avoided expensive bulk deposits. Gross advances grew 18.63%, so credit is growing about 8.9 percentage points faster than deposits. Gross advances of Rs 50.47 lakh crore against deposits of Rs 60.06 lakh crore is about 84% (my calculation, mixing two bases).
JM Financial puts PSU bank deposit growth at 13.1% year on year in Q2 FY27, against SBI’s 9.73% in the earlier quarter. The periods differ, so read the gap with care. Funding cost and deposit mix are the lines most likely to move SBI’s margin from here.
SBI net profit Q2 FY27: what could it look like?
These are arithmetic scenarios, not forecasts. A flat profit of Rs 21,121 crore would be +4.8% on Q2 FY26 and the half-year would be +7.4% on Rs 39,320 crore.
Assumptions: standalone net profit; start point Rs 21,121 crore (Q1 FY27); Q2 FY26 profit Rs 20,160 crore; first-half FY26 profit Rs 39,320 crore (Rs 19,160 crore plus Rs 20,160 crore).
| Change over Q1 FY27 | Q2 FY27 profit, Rs crore | Growth on Q2 FY26 | H1 FY27, Rs crore | H1 growth |
|---|---|---|---|---|
| -5% | 20,065 | -0.5% | 41,186 | +4.7% |
| 0% | 21,121 | +4.8% | 42,242 | +7.4% |
| +3% | 21,755 | +7.9% | 42,876 | +9.0% |
| +5% | 22,177 | +10.0% | 43,298 | +10.1% |
Cite this table: PositionalCalls, “SBI Q2 FY27 Profit and Half-Year Scenarios, as of 30 October 2026”.
Assumptions for NII: start point Rs 46,992 crore (Q1 FY27); Q2 FY26 NII Rs 42,984 crore.
| Change over Q1 FY27 | Q2 FY27 NII, Rs crore | Growth on Q2 FY26 |
|---|---|---|
| -1% | 46,522 | +8.2% |
| 0% | 46,992 | +9.3% |
| +2% | 47,932 | +11.5% |
| +3% | 48,402 | +12.6% |
Cite this table: PositionalCalls, “SBI Q2 FY27 NII Scenarios, as of 30 October 2026”.
Three worked examples
- Flat profit: 21,121 divided by 20,160 gives +4.8% on the year. The half-year would be 21,121 plus 21,121, or Rs 42,242 crore, which is +7.4% on Rs 39,320 crore.
- Profit that beats the base by 10%: 20,160 times 1.10 is Rs 22,176 crore, which needs about 5% growth on Q1 FY27 (22,176 divided by 21,121).
- Bad loans: a 5 bps rise in the gross NPA ratio on gross advances of Rs 50.47 lakh crore adds about Rs 2,524 crore of gross NPAs (0.05% of 50,47,000 crore, my calculation).
The scenarios hold other lines constant. In practice treasury income, provisions and tax move too. JM Financial notes that rising yields may hurt treasury income, so a profit miss can come from a line other than NII.
Which SBI profit and margin figure should you compare?
Compare standalone profit with standalone profit and domestic NIM with domestic NIM. SBI publishes several figures that look alike but differ by thousands of crore or tens of basis points.
| Figure | Q2 FY26 | Q1 FY27 | The trap |
|---|---|---|---|
| Standalone net profit, Rs crore | 20,160 | 21,121 | The headline; the bank-only account |
| Consolidated net profit, Rs crore | Not in sources | 24,113 or 24,579 (sources conflict) | Includes subsidiaries; confirm in the filing |
| Domestic NIM | 3.09% | 3.00% | The headline margin |
| Global NIM | Not in sources | 2.86% | Includes overseas; lower than domestic |
| Net interest income, Rs crore | 42,984 | 46,992 | Prior-year NII appears as 41,072 and 40,907 in sources |
| Operating profit, Rs crore | Not in sources | 33,529 | One report labels Rs 30,544 crore as PPOP; that matches the prior-year figure |
Cite this table: PositionalCalls, “SBI Definition-Trap Table, as of 30 October 2026”.
Operating profit of Rs 33,529 crore grew 9.77% on the year, which implies prior-year operating profit of about Rs 30,544 crore (33,529 divided by 1.0977, my calculation). A page that quotes the prior-year number as the current quarter’s is wrong by about Rs 3,000 crore.
Gross versus net NPA
Gross NPA is loans where the borrower has stopped paying, before provisions. Net NPA deducts the money SBI has set aside. In Q1 FY27 gross NPAs were Rs 74,272 crore (1.47%) and net NPAs Rs 19,158 crore (0.38%). The difference, about 74% of gross NPAs, is a rough cover figure (my calculation); it is not the bank’s reported provision coverage ratio.
The estimate base trap
A sector estimate such as +14.9% profit growth is measured on that brokerage’s own coverage and base. It says nothing about SBI’s one-off-affected Q2 FY26 profit. Ask which base and which banks any estimate covers before you compare it with the table above.
PositionalCalls WhatsApp channel
Get the SBI Q2 numbers and bank results on WhatsApp
- The SBI filing time and headline numbers, stamped
- Base-to-beat tables for the next bank results
- Links to updated Q2 FY27 pages
What do SBI’s asset quality and loan growth need to show?
Gross NPA of 1.47% and net NPA of 0.38% in Q1 FY27 are described as the lowest in over two decades. The Q2 question is whether they hold while advances grow 13% to 15% for the year.
| Measure | Q2 FY26 | Q1 FY27 | Guidance or note |
|---|---|---|---|
| Gross NPA ratio | 1.73% | 1.47% | Lowest in over two decades, per management |
| Net NPA ratio | 0.42% | 0.38% | Rupee amount Rs 19,158 crore |
| Advances growth, year on year | 12.73% (total advances) | 18.63% (gross advances) | Different bases; management cites base effects |
| FY27 loan growth guidance | Not applicable | 13% to 15% | Raised from 12% to 14% on the Q1 call |
| Deposit growth, year on year | 9.27% | 9.73% | Only 0.5% on the quarter in Q1 |
| CASA ratio | 39.63% | 39.24% | Muted CASA growth is a sector concern |
Cite this table: PositionalCalls, “SBI Asset Quality and Growth Marks, as of 30 October 2026”.
Provisions (excluding tax) were Rs 5,400 crore in Q2 FY26, up from Rs 4,759 crore in Q1 FY26 and Rs 4,506 crore in Q2 FY25, as reported by Business Today. Credit cost and slippage figures were not in the Q1 FY27 reports found for this page, so read them from the filing.
Loan growth of 18.63% against a full-year guide of 13% to 15% means growth must slow in the coming quarters, or the guide rises again. Management said growth should moderate in line with nominal GDP. Watch whether the guide moves on 3 November.
Which other banks report around the SBI Q2 results?
Bank of Baroda is listed among the companies reporting on Friday, 30 October 2026, according to Upstox, and other large banks follow in the same season.
For the format of a bank results read, see our earlier posts on Bank of Baroda Q3 FY26 results, HDFC Bank Q3 FY26 results, ICICI Bank Q3 FY26 results and Axis Bank Q3 FY26 results. They carry last quarter’s numbers, not Q2 FY27, so do not compare them directly. The Q2 results calendar lists the companies that have reported.
NRI deposits matter for this season. JM Financial and Systematix both link margin pressure to FCNR(B) inflows, which banks must deploy at lower yields. Our guide to NRI investment in the Indian stock market covers the account types.
How to read the SBI Q2 results in 10 minutes
Read seven lines in order: standalone profit, NII, domestic NIM, gross and net NPA, advances growth, deposit growth and the one-off note.
| What to read | Mark to compare | Question to ask |
|---|---|---|
| Standalone net profit | Rs 20,160 crore (Q2 FY26); Rs 21,121 crore (Q1 FY27) | Is growth above 4.8%, the flat-quarter level? |
| Net interest income | Rs 42,984 crore; Rs 46,992 crore | Did NII hold above Q1’s level? |
| Domestic NIM | 3.09%; 3.00% | Did it fall about 7 bps, as the sector expects? |
| Gross and net NPA | 1.47% and 0.38% | Did both ratios stay at or below Q1? |
| Advances growth | 18.63% in Q1; guide 13% to 15% | Did management move the guide? |
| Deposit growth and CASA | 9.73%; 39.24% | Is funding keeping pace with loans? |
| Notes on one-off items | Yes Bank gain Rs 4,593 crore in Q2 FY26 | Does the filing show any one-off in Q2 FY27? |
Cite this table: PositionalCalls, “SBI Results-Day Decoder, as of 30 October 2026”.
How to read the SBI filing on NSE or BSE
Open the exchange announcement, find the standalone statement and compare each line with the base table above, same measure, same basis.
- Open the BSE corporate announcements page or the NSE corporate filings page and search for State Bank of India.
- Choose the financial results announcement for the quarter and half-year ended 30 September 2026.
- Find the standalone statement first, then the consolidated one.
- Check the unit. SBI reports in Rs crore in its presentation; some filings use Rs lakh.
- Read net profit, NII, operating profit and provisions.
- Open the notes for exceptional items and the one-off effect.
- Check the analyst presentation for NIM, NPA ratios and guidance.
- Compare every figure with the base table.
What it costs: reading a filing is free. If you trade the stock, brokerage, securities transaction tax and other charges apply, so check your broker’s current schedule. Tax angle: dividends and gains follow the current tax rules, so see our guide to capital gains tax on shares or ask a tax adviser. Scam warning: on results day, fake “result alert” groups and sure-shot tips circulate. Nobody can guarantee a gain, and official filings are free.
What is the results-day checklist for SBI?
- Confirm the board meeting date on the BSE or NSE announcement page.
- Note the filing time and stamp what you read with it.
- Open the standalone statement before any headline.
- Compare net profit with Rs 20,160 crore and Rs 21,121 crore.
- Check the notes for the Yes Bank gain and any new one-off.
- Read domestic NIM against 3.09% and 3.00%.
- Compare gross and net NPA with 1.47% and 0.38%.
- Check whether the FY27 loan growth guide moved.
- Write your own plan before the price moves.
What are the risks around the SBI Q2 results?
How to grade SBI’s September-quarter numbers: a reading guide
Use the table as a reading aid, not a forecast. The cut-offs are my illustration, built from the Q1 FY27 marks and the sector views above.
Assumptions: Q1 FY27 is the reference quarter; a 7 bps NIM fall is the sector average; Q2 FY26 profit is Rs 20,160 crore.
| Mark | Stronger | In line | Weaker |
|---|---|---|---|
| Domestic NIM | 3.00% or higher | 2.93% to 2.99% | Below 2.93% |
| Net interest income | Above Rs 47,932 crore (+2% on Q1) | Rs 46,522 to 47,932 crore | Below Rs 46,522 crore (-1%) |
| Gross NPA ratio | 1.47% or lower | 1.48% to 1.52% | Above 1.52% |
| Standalone net profit | Above Rs 21,755 crore (+7.9% on Q2 FY26) | Rs 20,160 to 21,755 crore | Below Rs 20,160 crore (a fall on the year) |
| FY27 loan growth guide | Raised above 13% to 15% | Unchanged | Cut |
Cite this table: PositionalCalls, “SBI Q2 FY27 Reading Guide, as of 30 October 2026”.
Worked example: suppose domestic NIM is 2.95%, NII rises 1% on Q1, gross NPA is 1.45% and profit is Rs 21,300 crore. NII would be about Rs 47,462 crore, up 10.4% on Q2 FY26 (47,462 divided by 42,984), and profit would be up 5.7% (21,300 divided by 20,160). Three marks read in line or stronger. The headline growth is lower than NII growth because of the one-off in the base.
A strong reading describes the quarter only. It is not a signal to buy, sell or hold, and a weak one is not a signal either. Prices react to many things, including what the market already expected.
What do most people miss on SBI results day?
- The base has a one-off. Rs 4,593 crore from the Yes Bank stake sale sits inside Rs 20,160 crore.
- A flat quarter already shows about 5%. Growth starts from Rs 20,160 crore.
- Domestic NIM is not global NIM. They were 3.00% and 2.86% in Q1 FY27.
- Sector estimates are not SBI estimates. Check which banks a forecast covers.
- Sector margin calls came before the filing. JM Financial and Systematix wrote in early October, so check whether SBI matched them.
- Growth optics differ from trend. The one-off can make a strong quarter look ordinary on the year.
- The filing time is unknown. Avoid acting on an unconfirmed screenshot.
Analyst’s note: how to think about this quarter
- What stands out (reasoning): a record Q1 profit meets a high Q2 base, so growth optics and underlying trend will differ.
- Easy to miss: NII, not profit, is the clean read on the franchise, because it carries no stake-sale gain.
- What would change the view: domestic NIM below 2.90%, or gross NPA above 1.55%.
- Caution: one quarter does not fix a long-term value. This page gives no target or recommendation.
- Reader action: read standalone figures first and match each to the base table.
Bottom line
Known: the board meets on 3 November 2026; the base is Rs 20,160 crore profit with a Rs 4,593 crore one-off, and Q1 FY27 was Rs 21,121 crore with domestic NIM of 3.00%.
Not known yet: the filing time, the actual figures and any SBI-specific estimate.
Your move: use the decoder table and compare same-basis figures.
Next read: the Q2 results calendar, which lists the companies reporting next.
Part of the banking results series.
PositionalCalls WhatsApp channel
Bank results day, in one WhatsApp channel
- Filing alerts for SBI and other large banks
- The three profit and margin figures explained
- The next company on the results calendar
SBI Q2 results: frequently asked questions
When are the SBI Q2 results?
The SBI Q2 results are due on Tuesday, 3 November 2026. The Central Board meets in Mumbai to consider results for the quarter and half-year ended 30 September 2026, and an analyst meet follows at 5:15 PM. The filing time is not announced; confirm on the BSE or NSE announcement page.
What was SBI net profit in Q2 FY26?
SBI reported standalone net profit of Rs 20,160 crore in Q2 FY26, up 9.97% year on year, as reported by Business Today. That figure included a gain of Rs 4,593.22 crore from selling a stake in Yes Bank, so it is a high base.
What did SBI report in Q1 FY27?
For the June 2026 quarter, ANI reported net profit of Rs 21,121 crore (up 10.23%), net interest income of Rs 46,992 crore (up 14.88%), domestic NIM of 3.00%, gross NPA of 1.47% and net NPA of 0.38%.
What do analysts expect in the SBI Q2 results preview?
No SBI-specific Q2 FY27 estimate was found for this page. JM Financial (11 October 2026) expects margins to fall sequentially at most banks, and Systematix (6 October 2026) expects its bank coverage profit to rise 14.9% on the year, excluding IndusInd Bank.
Why may SBI net profit growth look low in Q2 FY27?
Because the Q2 FY26 base includes the Yes Bank stake-sale gain of Rs 4,593 crore. A flat profit of Rs 21,121 crore would be only 4.8% above Rs 20,160 crore (my calculation). Check the filing notes for one-off items.
What is SBI NIM guidance for FY27?
On the Q1 FY27 call, management reaffirmed full-year domestic net interest margin guidance of about 3%, as reported by Multibagg on 13 August 2026. Domestic NIM was 3.00% in Q1 and global NIM was 2.86%.
What is SBI loan growth guidance for FY27?
Management raised FY27 loan growth guidance to 13% to 15% from 12% to 14%, as reported on 13 August 2026. Gross advances grew 18.63% year on year in Q1, which management linked to base effects.
Where can I read the SBI Q2 results filing?
Use the BSE corporate announcements page or the NSE corporate filings page and search for State Bank of India. Open the financial results PDF. Ignore forwarded “result alert” images and any message that promises sure-shot calls.
Is standalone or consolidated profit the SBI headline?
SBI’s headline profit has been the standalone figure. Consolidated profit, which includes subsidiaries, is higher, and sources conflict for Q1 FY27 at Rs 24,113 crore and Rs 24,579 crore. Confirm the consolidated figure in the filing.
By when must SBI publish its Q2 results?
SEBI’s listing regulations give listed companies 45 days after quarter-end for quarterly results. For the quarter ended 30 September 2026 that is 14 November 2026 (my calculation), so the 3 November board meeting is well inside the limit.
Sources
- BSE corporate announcements: where the SBI filing appears.
- NSE corporate filings: financial results: the same filing on NSE.
- SBI analyst presentation, Q1 FY27: base-quarter reference.
- PSU Connect, 26 October 2026, 7:19 PM IST: board meeting date and analyst meet.
- ANI via The Tribune, 7 August 2026: Q1 FY27 figures.
- Multibagg, 7 and 13 August 2026: Q1 FY27 margins, NPAs and guidance.
- Business Today, 4 November 2025: Q2 FY26 figures and the Yes Bank stake-sale gain.
- Systematix Research via ANI, 6 October 2026, and JM Financial via ANI, 11 October 2026: sector previews.
- Upstox, 30 October 2026: results calendar.
Disclosure: PositionalCalls.com is not a SEBI-registered research analyst or investment adviser. Investments in securities markets are subject to market risks. Read all related documents carefully before investing. Returns are never guaranteed. PositionalCalls is an independent research and education site founded by Shubham Chaudhary. Nothing here is a recommendation, target or investment advice. How I researched this: I checked the results date in the exchange-intimation report, took base figures from company results as reported by ANI, Business Today and Multibagg, and marked every derived number as my calculation. Figures are as of Friday, 30 October 2026, 3:45 PM IST.

Shubham Chaudhary is the founder of PositionalCalls, an independent Indian stock market research website. He writes company fundamentals, quarterly results analysis, IPO analysis and sector research for NSE and BSE listed companies, with a focus on banking stocks, insurance and long-term value investing. Every article is built from primary sources such as RBI, SEBI, NSE and BSE filings and company annual reports, and states its risks plainly in simple language for retail investors.
Coverage areas Our research standards- Numbers checked against NSE, BSE and SEBI filings
- Risks and limits stated in every article
- No paid promotions or broker tie-ups
- Articles updated when new filings arrive