
Earnings · Paytm Q2 FY27 Preview
The date is still open and the year-ago profit base is distorted. Here is how to read the Paytm Q2 results FY27 when they arrive, then see the three cases where the headline growth rate misleads.
Quick answer
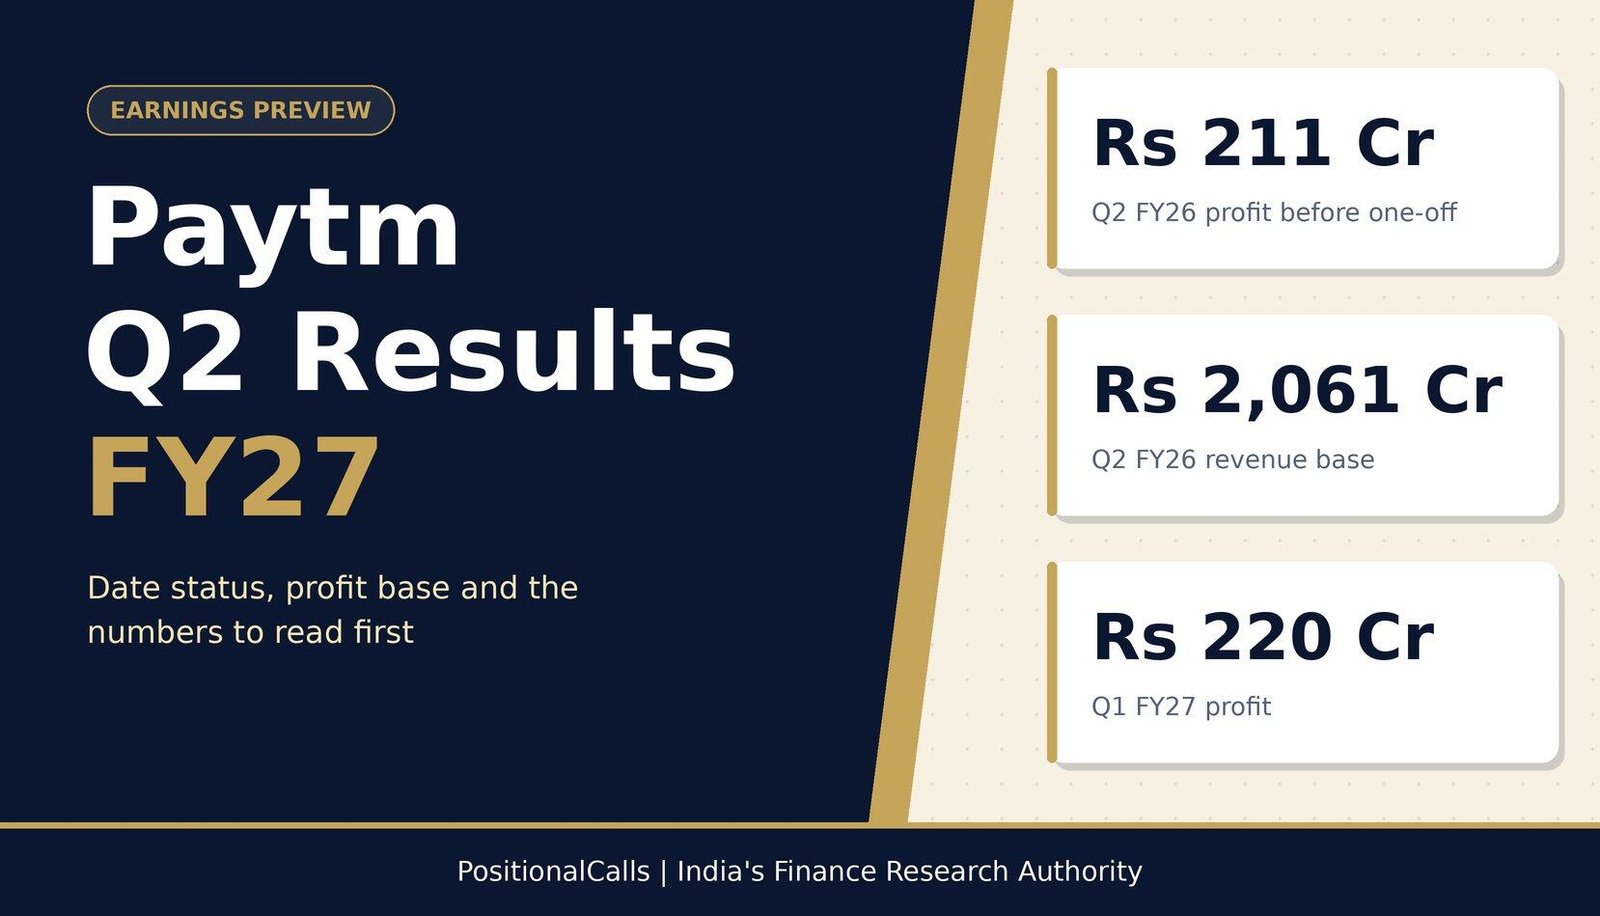
The Paytm Q2 results FY27 cover July to September 2026, and the board-meeting date was not confirmed in sources checked as of 26 October 2026. The base is distorted: Q2 FY26 profit was Rs 21 crore reported, but Rs 211 crore before a one-off Rs 190 crore charge. Q1 FY27 profit was Rs 220 crore.
Latest update (Monday, 26 October 2026, 6:30 PM IST): Published using Paytm’s Q1 FY27 results (20 July 2026) and the Q2 FY26 base. No Q2 FY27 board-meeting intimation was seen in the sources checked. Next: this page is updated the moment the date is filed.
Key takeaways
- Date: not confirmed as of 26 October 2026; Q2 FY26 results came on 4 November 2025.
- Base: Rs 21 crore reported, Rs 211 crore before the one-off charge.
- Q1 FY27: Q1 FY27 profit Rs 220 crore, revenue from operations Rs 2,448 crore (+28%).
- Watch: PIDF-adjusted numbers, other income and the 31 December 2026 UPI cap timeline.
In plain words: Paytm earns fees on payments and by selling partners’ loans. Profit after tax is the final profit; EBITDA is operating profit before interest, tax and depreciation. A one-off charge can make profit look worse than the business was.
Data note: Q1 FY27 figures are from a Kotak Neo report of 21 July 2026 that I opened. Q2 FY26 and Q4 FY26 figures are cross-read across several news reports. Board-meeting timings are from Paytm’s NSE filings of 28 April and 6 May 2026. I did not open Paytm’s own earnings release; confirm each figure on NSE or BSE.
When are the Paytm Q2 results FY27 due?
As of 26 October 2026 the Paytm Q2 results FY27 date was not confirmed, and the past pattern points to the first half of November.
Paytm files a board-meeting intimation with the exchanges before results. Its May 2026 filing shows intimation on 28 April for a 6 May meeting, eight days ahead. Results come after market hours, so the share reaction shows on the next session.
| Quarter | Board meeting | Notice and timing |
|---|---|---|
| Q2 FY26 | Tuesday, 4 November 2025 | Announced post market; earnings call 5 November 2025 |
| Q4 FY26 | Wednesday, 6 May 2026 | Intimation 28 April 2026; meeting 6:37 pm to 8:04 pm IST |
| Q1 FY27 | Monday, 20 July 2026 | Trading window for designated persons closed until 22 July 2026 |
| Q2 FY27 | Not confirmed as of 26 Oct 2026 | Check NSE, BSE and ir.paytm.com |
If your search says “Paytm Q2 results 2027”, it is the same quarter: FY27 runs from April 2026 to March 2027, so Q2 FY27 is July to September 2026.
What is the Q2 FY26 base, and why is it distorted?
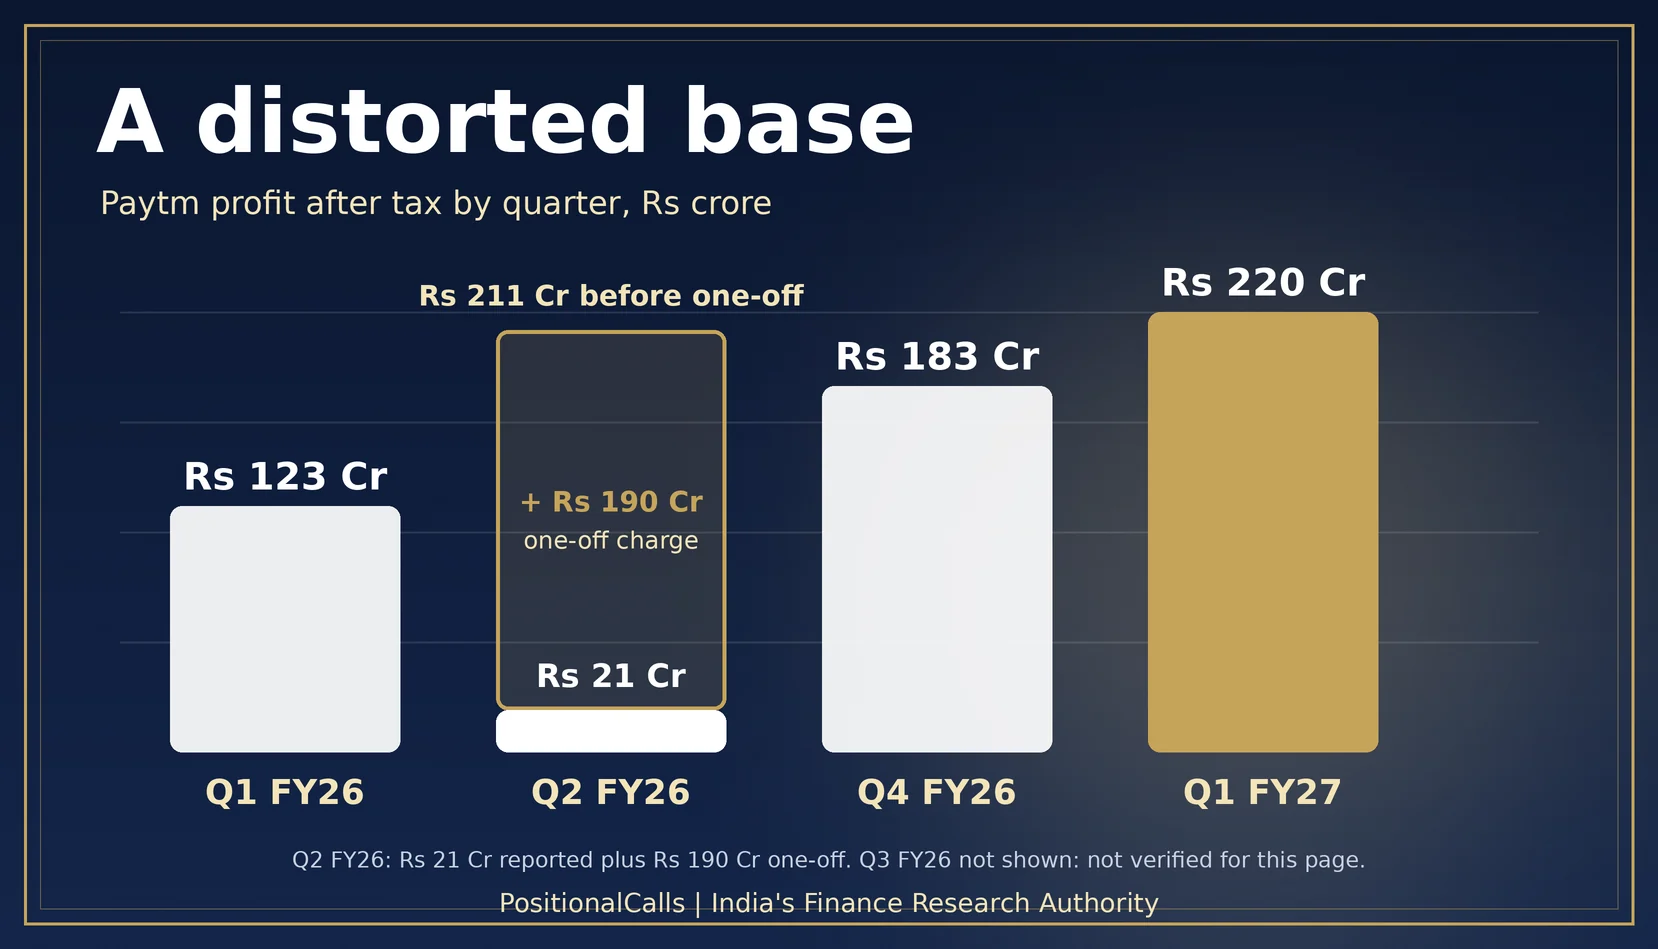
The base to beat is Q2 FY26: revenue from operations of Rs 2,061 crore and profit of Rs 21 crore, or Rs 211 crore before a one-off charge.
The charge was Rs 190 crore, a full impairment of a loan to its gaming joint venture, First Games Technology, after the Online Gaming Act, 2025. Judge year-on-year growth against the Rs 211 crore figure, not Rs 21 crore.
PositionalCalls Paytm Base-to-Beat Table (as of 26 October 2026)
| Metric | Q2 FY26 (Sep 2025) | Q4 FY26 (Mar 2026) | Q1 FY27 (Jun 2026) |
|---|---|---|---|
| Revenue from operations | Rs 2,061 crore (+24%) | Rs 2,264 crore (+18%) | Rs 2,448 crore (+28%) |
| Profit after tax | Rs 21 crore; Rs 211 crore before one-off | Rs 183 crore | Rs 220 crore (Rs 123 crore a year earlier) |
| EBITDA and margin | Rs 142 crore, 7% | Rs 132 crore, 6% | Rs 203 crore, 8% |
| Payment services revenue | Rs 1,223 crore | — | Rs 1,384 crore (+33%) |
| Financial services distribution | Rs 611 crore (+63%) | — | Rs 814 crore (+45%) |
| Marketing services | Rs 228 crore (-15%) | — | Rs 239 crore (stable) |
| GMV growth, year on year | 27% | 27% | 31% |
| Contribution profit and margin | Rs 1,207 crore, 59% | Rs 1,254 crore, 55% | — |
A dash means the figure was not verified for this page.
Cite this table: PositionalCalls Paytm Base-to-Beat Table, 26 October 2026, positionalcalls.com/paytm-q2-results-fy27/
Worked checks (my calculation):
- Segments add up: Q2 FY26 payments, financial services and marketing sum to Rs 1,223 crore + Rs 611 crore + Rs 228 crore = Rs 2,062 crore, against reported Rs 2,061 crore. Q1 FY27 gives Rs 1,384 crore + Rs 814 crore + Rs 239 crore = Rs 2,437 crore, against Rs 2,448 crore.
- Growth rates: Rs 2,448 crore against Rs 1,918 crore is +27.6%, and against Rs 2,264 crore is +8.1%.
- Margin: Rs 203 crore divided by Rs 2,448 crore is 8.3%.
What changed and when?
Six dated events explain why Paytm’s reported numbers are harder to compare than they look.
| Date | What changed | Why it matters |
|---|---|---|
| 26 Aug 2025 | First Games stopped real-money gaming; Paytm took a Rs 190 crore impairment at 30 Sep 2025 | Cut Q2 FY26 profit to Rs 21 crore |
| 4 Nov 2025 | Q2 FY26 results: revenue +24%, EBITDA Rs 142 crore | Sets the year-ago base |
| 6 May 2026 | Q4 FY26 and first full-year profit: Rs 552 crore on revenue of Rs 8,437 crore (+22%) | Profit trend before Q1 FY27 |
| FY26 filings | PIDF scheme discontinued; comparable figures shown | Reported and comparable numbers differ |
| 20 Jul 2026 | Q1 FY27: Rs 220 crore profit; bonus proposal dropped; up to Rs 100 crore for Paytm Money | Capital allocation signals |
| 31 Dec 2026 | Current UPI market-share cap timeline (May 2026 report) | Rule risk for UPI-linked revenue |
At the same Q1 FY27 meeting, the board sought approval to change how the remaining Rs 1,686 crore of IPO proceeds is used and to extend the timeline to 31 March 2029.
PositionalCalls WhatsApp channel
Paytm results date and numbers, the day they land
- A dated note when the board meeting is filed
- The five numbers read against the Rs 211 crore base
- Plain-English explainers on PIDF and UPI rules
Which five numbers should I read first?
Read revenue, payment services, financial services, EBITDA and profit first, each against the table above.
- Revenue from operations: compare with Rs 2,061 crore (year on year) and Rs 2,448 crore (quarter on quarter).
- Payment services and GMV: Q1 FY27 was Rs 1,384 crore with GMV up 31%. See whether the pace holds.
- Financial services distribution: Rs 814 crore in Q1 FY27 (+45%). Check partner credit quality and any default-loss guarantee disclosures.
- EBITDA: Rs 203 crore reported and Rs 195 crore excluding PIDF in Q1 FY27. Use the comparable figure for trend.
- Profit after tax: compare with Rs 211 crore, then check how much came from other income.
Other income matters here. Q2 FY26 total income was Rs 2,283 crore against Rs 2,061 crore from operations, so other income was about Rs 222 crore. For Q1 FY27, total income of Rs 2,630 crore less Rs 2,448 crore implies about Rs 182 crore (my calculation). Read how much of profit rests on it.
How does Paytm make money?
Paytm earns fees on payments, commissions on loans it distributes for partners, and marketing income.
- Payment services: merchant payments, QR, soundbox and card machines, and processing fees. It added 2.7 million soundboxes in the year to Q1 FY27 and holds an online payment aggregator licence.
- Financial services distribution: merchant loans, personal loans and other products offered with lending partners.
- Marketing and other services: advertising and cloud-type revenue.
The mix matters. Payment processing margins and loan distribution fees lift contribution profit, which was 59% of revenue in Q2 FY26 and 55% in Q4 FY26.
What are the risks, and what do most people miss?
The biggest risks are a distorted base, changing incentives and rule timelines, and reliance on other income.
PositionalCalls Paytm Distortion Guide (as of 26 October 2026)
| Item | What it is | Effect on comparison |
|---|---|---|
| One-off impairment | Rs 190 crore charge in Q2 FY26 | Reported profit Rs 21 crore vs Rs 211 crore underlying |
| PIDF incentive | Scheme discontinued; Paytm shows comparable figures | Q1 FY27 EBITDA Rs 203 crore vs Rs 195 crore comparable; profit Rs 220 crore vs Rs 212 crore |
| Other income | Total income less revenue from operations | About Rs 222 crore (Q2 FY26) and Rs 182 crore (Q1 FY27) |
| UPI cap timeline | NPCI cap; current date 31 Dec 2026 | Rule risk; dates have moved before |
Cite this table: PositionalCalls Paytm Distortion Guide, 26 October 2026, positionalcalls.com/paytm-q2-results-fy27/
What most people miss:
- The PIDF effect was small in Q1 FY27: Rs 203 crore less Rs 195 crore is Rs 8 crore (my calculation).
- Top-three UPI apps held 87% in May 2026 and PhonePe plus Google Pay 79%, so Paytm was roughly 8% (my calculation from rounded figures).
- RBI restrictions on Paytm Payments Bank in early 2024 hurt UPI share; the recovery to about 7.7% by November 2025 was gradual.
How could the quarter read? Stated assumptions
Three stated-assumption views show what different revenue and profit levels would imply; they are arithmetic, not forecasts.
PositionalCalls Paytm Revenue and Profit Threshold Table (as of 26 October 2026)
| Assumed Q2 FY27 revenue from operations | Year on year vs Rs 2,061 crore | Quarter on quarter vs Rs 2,448 crore |
|---|---|---|
| Rs 2,448 crore (flat) | +18.8% | 0.0% |
| Rs 2,550 crore | +23.7% | +4.2% |
| Rs 2,638 crore | +28.0% | +7.8% |
| Rs 2,700 crore | +31.0% | +10.3% |
| Assumed reported profit after tax | Vs Rs 21 crore reported base | Vs Rs 211 crore underlying base | Vs Rs 220 crore in Q1 FY27 |
|---|---|---|---|
| Rs 200 crore | +852% | -5.2% | -9.1% |
| Rs 220 crore | +948% | +4.3% | 0.0% |
| Rs 250 crore | +1,090% | +18.5% | +13.6% |
Cite this table: PositionalCalls Paytm Revenue and Profit Threshold Table, 26 October 2026, positionalcalls.com/paytm-q2-results-fy27/
| View | Assumption stated | How to read the filing |
|---|---|---|
| Payments-led | Payment services growth stays near Q1’s 33% and GMV growth near 31% | Check net payment margin and soundbox economics |
| Lending-led | Distribution revenue growth stays near Q1’s 45% | Check partner credit quality and guarantee disclosures |
| Margin squeeze | EBITDA margin falls below Q1’s 8% or profit leans on other income | Read cost lines and the other income note |
What is the results-day checklist?
- Confirm the board-meeting date and download the consolidated results from NSE or BSE.
- Compare revenue from operations with Rs 2,061 crore and Rs 2,448 crore.
- Compare profit with Rs 211 crore, not only Rs 21 crore.
- Use the comparable (ex-PIDF) EBITDA and profit for trend.
- Check payment services, financial services and marketing lines.
- Read the other income and exceptional items notes.
- Check any update on UPI cap timing and the IPO proceeds plan.
- Read management commentary on lending partners and credit costs.
You need a demat and trading account with a SEBI-registered broker; charges and tax depend on your broker and current rules.
- What you need: PAN, bank account and completed KYC.
- What it costs: brokerage, demat and transaction charges vary; check your broker’s current schedule.
- Tax angle: see capital gains tax on shares, and check current rules or ask a tax adviser.
- App vs shares: using the Paytm app is different from owning shares of One 97 Communications.
- NRIs: see NRI investment in the Indian stock market.
- Scam warning: fake allotment or KYC pages and OTP requests are common; never share an OTP.
Analyst’s note
- What stands out: reported profit growth will look dramatic whatever the business did, because the base includes a Rs 190 crore charge.
- Easy to miss: other income was about Rs 182 crore in Q1 FY27, close to the Rs 203 crore EBITDA.
- What would change the picture: a confirmed results date, the comparable numbers and the UPI cap outcome.
- Reader action: compare each line with the Base-to-Beat Table above and use the Rs 211 crore base.
Reasoning from the data above.
Bottom line
Wait for the date, read the filing, and measure growth against the Rs 211 crore underlying base. The comparable numbers and other income decide how the quarter reads.
Next read: Eternal Q2 results FY27
Part of the Earnings series by Shubham Chaudhary.
PositionalCalls WhatsApp channel
Follow Paytm and other results in one place
- Dated alerts when results are filed
- Base-to-beat notes for big earnings
- Calendars for results and market holidays
Frequently asked questions
When are the Paytm Q2 results FY27 expected?
As of 26 October 2026 the board-meeting date was not confirmed in the sources checked. Paytm’s May 2026 filing shows it gave eight days’ notice, so watch NSE, BSE and the company investor page for the intimation.
Is it Paytm Q2 results 2026 or 2027?
Both labels point to the same quarter. FY27 is April 2026 to March 2027, so Q2 FY27 covers July to September 2026. Results for it are filed in the weeks after the quarter ends, so searches often say 2027.
What was Paytm’s profit in Q2 FY26?
Rs 21 crore as reported for July to September 2025. That included a one-time Rs 190 crore charge on a loan to its gaming joint venture. Before the charge, profit was Rs 211 crore, which is the fairer base.
What did Paytm report in Q1 FY27?
For April to June 2026, profit was Rs 220 crore against Rs 123 crore a year earlier. Revenue from operations rose 28% to Rs 2,448 crore, and EBITDA was Rs 203 crore, an 8% margin.
What time does Paytm usually announce results?
After market hours. Its 6 May 2026 board meeting began at 6:37 pm IST and ended at 8:04 pm, per its NSE filing. Results and the earnings release followed that evening.
Why will Paytm’s profit growth look huge in Q2 FY27?
Because the year-ago profit of Rs 21 crore was cut by a Rs 190 crore one-off. A Rs 220 crore profit would be about 10.5 times that base, but only 4.3% above the Rs 211 crore underlying figure.
What is PIDF and why does Paytm show comparable numbers?
PIDF is the Payments Infrastructure Development Fund incentive. Paytm said the scheme was discontinued, so it shows comparable figures excluding PIDF. In Q1 FY27, comparable EBITDA was Rs 195 crore against Rs 203 crore reported.
NPCI has proposed capping any one UPI app’s volume share. A May 2026 report put the current implementation timeline at 31 December 2026. Deadlines have moved before, so check NPCI circulars for any change.
How does Paytm earn money?
Mainly from payment services (merchant payments, devices and processing), financial services distribution (loans and other products from partners) and marketing services. In Q1 FY27 they brought in Rs 1,384 crore, Rs 814 crore and Rs 239 crore.
Where can I check Paytm’s numbers?
Use the unaudited consolidated results filed on NSE and BSE, plus the earnings release and investor presentation on Paytm’s investor relations site. News summaries can differ in rounding and definitions.
Sources
- One 97 Communications NSE integrated filing, board meeting 6 May 2026
- One 97 Communications NSE prior intimation, 28 April 2026
- Paytm investor relations
- NSE India and BSE India
- Secondary, not linked: Kotak Neo (Q1 FY27 report, 21 July 2026), Inc42, Business Standard, Entrackr, DSIJ, Outlook Business, Torus Digital, Angel One
PositionalCalls.com is an independent Indian stock market research and education site founded by Shubham Chaudhary. PositionalCalls.com is not a SEBI-registered research analyst or investment adviser. Investments in securities markets are subject to market risks. Read all related documents carefully before investing. Returns are never guaranteed. Content is for information and education and is not personal advice. How I researched this: I opened Paytm’s NSE filing references and a Kotak Neo report of Q1 FY27 results; other figures are cross-read from news reports and should be checked against Paytm’s own filings. See the research methodology.

Shubham Chaudhary is the founder of PositionalCalls, an independent Indian stock market research website. He writes company fundamentals, quarterly results analysis, IPO analysis and sector research for NSE and BSE listed companies, with a focus on banking stocks, insurance and long-term value investing. Every article is built from primary sources such as RBI, SEBI, NSE and BSE filings and company annual reports, and states its risks plainly in simple language for retail investors.
Coverage areas Our research standards- Numbers checked against NSE, BSE and SEBI filings
- Risks and limits stated in every article
- No paid promotions or broker tie-ups
- Articles updated when new filings arrive