
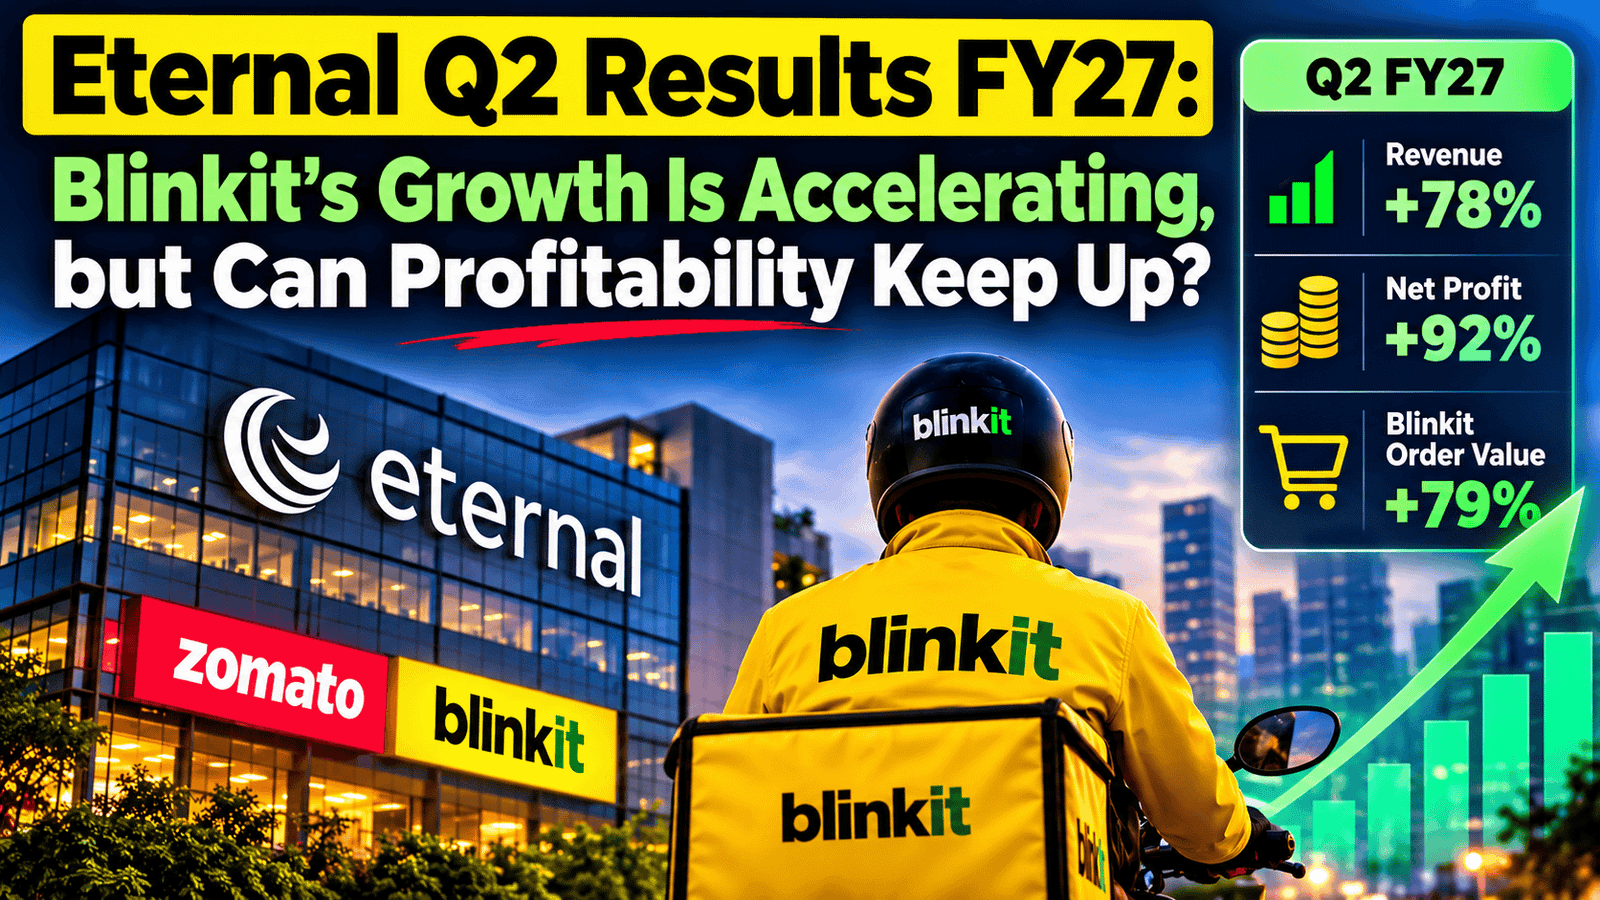
PositionalCalls • Quarterly Results • FY27
Eternal Q2 Results FY27: Blinkit’s Growth Is Accelerating, but Can Profitability Keep Up?
Revenue rose sharply and Blinkit continued to expand. The investment question is whether rapid quick-commerce growth can translate into durable operating profits and cash generation.
Editorial verification note: The figures in this draft were carried forward from the supplied article material and have not been independently verified here against the relevant exchange filing. Before publishing, reconcile all numbers, metric definitions and management targets with Eternal’s official disclosures. This article is for education and information, not personalised investment advice.
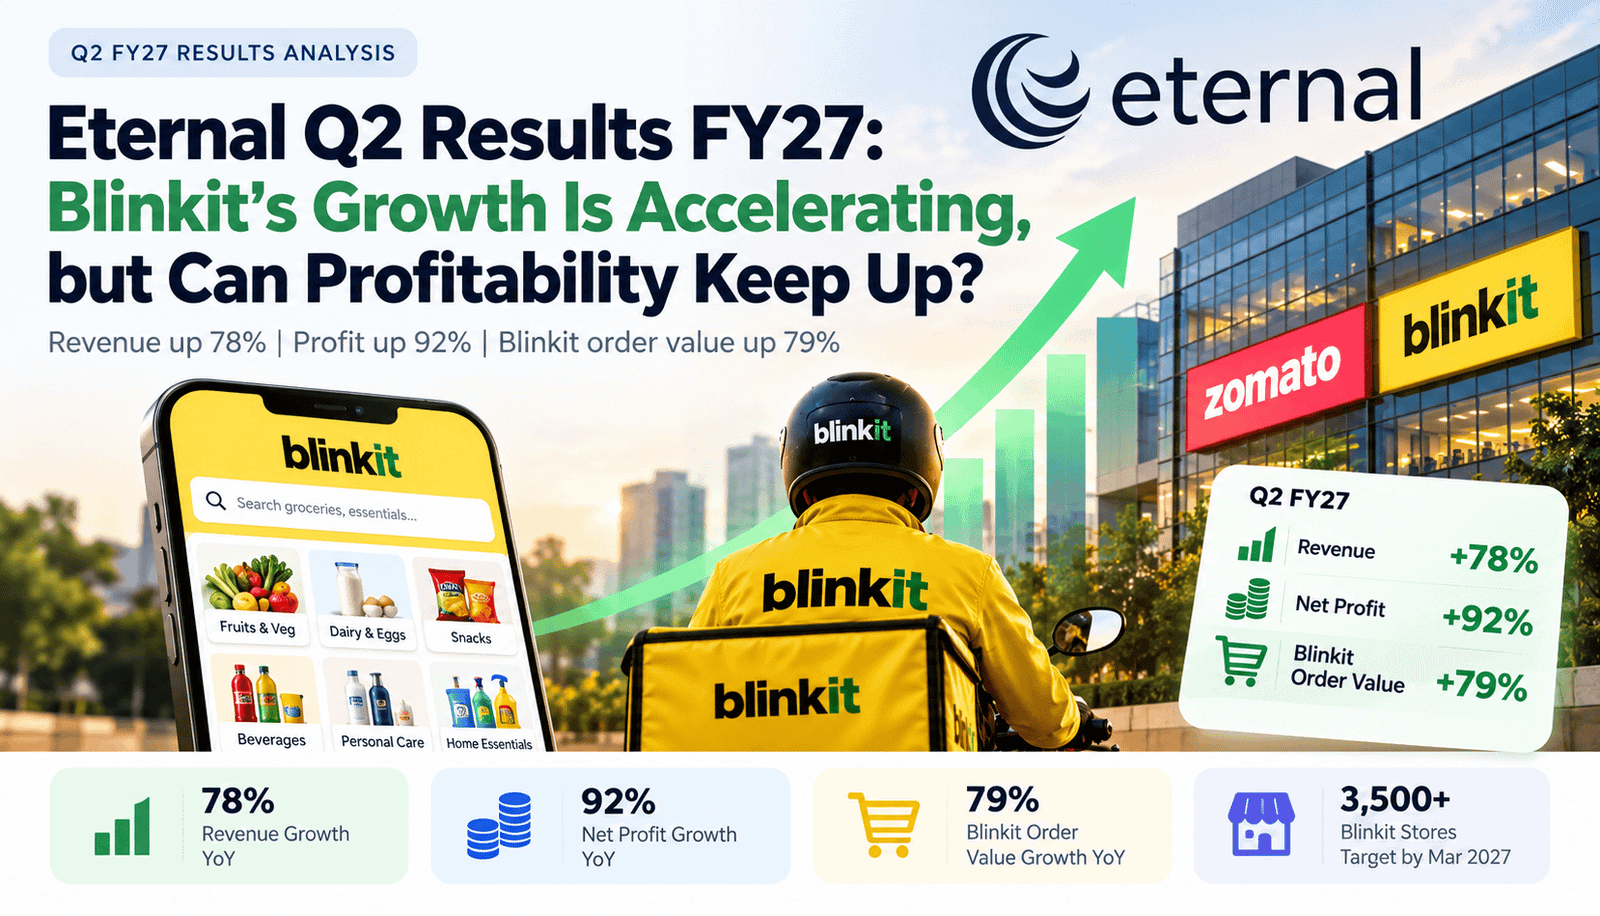
Eternal Q2 Results FY27: Key Numbers at a Glance
| Metric | Figure in supplied draft | What investors should assess |
|---|---|---|
| Revenue from operations | ₹24,138 crore; +77.6% YoY | Growth rate, business mix and the effect of accounting/model changes |
| Consolidated net profit | ₹125 crore versus ₹65 crore | Profit conversion and performance relative to analyst expectations |
| Consolidated adjusted EBITDA | ₹666 crore; +197% YoY | Operating performance, adjustments and reconciliation to reported profit |
| Blinkit reported revenue | ₹19,152 crore; +93.6% YoY | Revenue recognition, net order value and contribution economics |
| Blinkit store network | 2,751 after 308 net additions | Store maturity, order density, capital needs and payback periods |
| Food-delivery net order value | ₹11,445 crore; +21.5% YoY | Customer activity, frequency, incentives and segment margins |
| Cash balance | ₹16,475 crore versus ₹18,288 crore in Q1 FY27 | Cash-flow drivers, investment outlays and working-capital movements |
Important: revenue, net order value, adjusted EBITDA, EBITDA and net profit are different measures. They are not interchangeable. Verify the company’s definitions and reported periods before relying on this comparison.
1. Revenue growth is powerful—but comparability matters
The supplied draft puts revenue from operations at ₹24,138 crore, compared with ₹13,590 crore in the corresponding quarter a year earlier. That represents a substantial reported increase. However, headline revenue growth should not automatically be interpreted as an equivalent increase in underlying customer demand.
Reported coverage in the source draft discussed the impact of Blinkit’s move toward inventory ownership on how transactions are recorded. In a marketplace or platform model, a company may recognise a commission or service fee. In an inventory-led model, it may recognise the sale value of goods alongside associated costs. The accounting presentation can therefore change reported revenue even when the underlying order activity grows at a different rate.
For that reason, investors should evaluate reported revenue alongside net order value, segment-level profitability, customer activity and the relevant accounting notes. The objective is to separate growth in the economic activity of the business from changes in presentation or business mix.
2. Net profit nearly doubled, but expectations still matter
The supplied figures show consolidated net profit of ₹125 crore, versus ₹65 crore in Q2 FY26 and ₹92 crore in Q1 FY27. That is a clear year-on-year increase, but contemporary coverage cited in the draft reported that the result fell short of analyst expectations. Consensus estimates differ by analyst and data provider, so any comparison should name the estimate source and timestamp.
This helps explain why a company can report strong growth and still see a muted market reaction. Investors compare results not only with last year, but also with what was already priced into the share price, the quality of earnings, management’s forward signals and the investment needed to sustain growth.
Adjusted EBITDA is not the same as net profit. EBITDA-based measures exclude certain costs and adjustments; depreciation, financing costs, taxes and other items can affect the bottom line. A rising adjusted EBITDA figure may be constructive, but it does not alone prove that earnings quality or cash generation has improved to the same degree.
The next test is consistency: can Eternal improve operating performance over multiple quarters while funding expansion and maintaining service quality? One quarter is a data point, not proof of a durable trend.
3. Blinkit is both the growth engine and the execution test
The draft reports Blinkit net order value of ₹20,940 crore, up 79.3% year-on-year, and reported revenue of ₹19,152 crore, up 93.6%. It also records 308 net store additions in the quarter, taking the network to 2,751 stores. These figures, once verified, would underline the scale and pace of the quick-commerce expansion.
Quick commerce depends on a network of local fulfilment locations that keep products close to customers. Greater network density can improve delivery convenience, expand assortment and potentially increase order frequency. A stronger network can also make the service more useful to customers across more neighbourhoods.
But every new location brings operating commitments: premises, inventory, equipment, staffing, replenishment and local demand generation. New stores can take time to reach the order volumes and productivity of mature locations. During that ramp-up, costs may arrive before a location reaches its full potential.
That is why store count alone is an incomplete performance measure. Investors should monitor order density, average order value, fulfilment costs, customer retention, assortment availability, contribution margins and the time required for new stores to mature. These indicators help establish whether expansion is creating economic value or simply increasing the footprint.
4. Higher store targets raise the execution bar
The supplied draft says management raised Blinkit’s target to more than 3,500 stores by March 2027, from an earlier target of 3,000, and has discussed approximately 5,000 stores by March 2028. These targets must be checked against the latest official management commentary before publication; targets are ambitions, not completed outcomes.
A larger footprint could extend coverage into additional markets and improve convenience for customers. However, new markets can differ in order density, customer behaviour, product mix and operating costs. Store-opening pace is therefore only one part of the investment case.
The economics depend on opening costs, local demand, inventory turns, average order value, delivery efficiency, competitive intensity and the maturity profile of the network. Investors should distinguish stores that are established and productive from those still building demand.
The central question is whether mature locations can generate sufficient contribution while the company funds new stores. If productivity remains resilient, expansion could reinforce the network. If margins deteriorate, the company may need to slow rollout or accept a longer payback period.
5. Adjusted EBITDA improved—but margin quality matters
The draft reports Blinkit adjusted EBITDA of ₹184 crore in Q2 FY27, compared with ₹102 crore in Q1 FY27, and cites an adjusted EBITDA margin of approximately 0.9% of net order value. Confirm both figures and the precise metric definition from the company’s official disclosures before publishing.
At thin margins, relatively small changes in delivery expense, promotional intensity, inventory losses, product mix or new-store ramp-up can have a material effect on operating performance. Higher order density and better fulfilment efficiency may support operating leverage; aggressive competition or higher service costs can offset those gains.
Adjusted EBITDA is not free cash flow. It does not capture every cash requirement, including capital expenditure, working capital and lease-related outflows. Investors should read adjusted EBITDA alongside cash-flow statements, capital investment and the company’s reconciliation of adjusted metrics.
The strongest evidence of a scalable model would be sustained margin improvement alongside rapid store additions, without a deterioration in customer retention or service quality. A multi-quarter trend is more informative than a single quarter’s result.
6. Food delivery provides a second growth engine
The source draft reports food-delivery net order value of ₹11,445 crore, up 21.5% year-on-year, and reported adjusted revenue of ₹3,879 crore, up 35.5%. It also cites 28 million monthly transacting customers, compared with 27.2 million in the preceding quarter. Verify these metrics and definitions against the official results material.
Food delivery has different economics from quick commerce. Performance depends on customer frequency, average order value, restaurant participation, delivery efficiency, incentives and the balance between demand and merchant supply. Higher order value is constructive, but profitability depends on how much value is retained after the costs of serving each order.
The segment can diversify Eternal’s growth, but growth does not automatically produce margin expansion. Promotional spending, competitive intensity and changes in order mix may affect profitability even when order value rises. Management’s stated outlook should be assessed against actual customer activity and reported segment performance over time.
7. Going-out and Hyperpure broaden the portfolio
Eternal also operates businesses beyond food delivery and quick commerce. The going-out business has exposure to dining, events and related experiences, while Hyperpure supplies restaurants. Their operating models and economics differ, so they should be assessed separately rather than combined into a single growth narrative.
The supplied draft reports going-out net order value of ₹3,259 crore, up 58% year-on-year. It also reports Hyperpure revenue of ₹1,154 crore, up 12.8%, and adjusted EBITDA of ₹10 crore compared with a loss of ₹5 crore a year earlier. These figures require primary-source confirmation.
For going-out, relevant variables include discretionary spending, event demand, merchant participation and user-acquisition costs. For Hyperpure, procurement, logistics, product availability, customer retention and distribution efficiency are key drivers. Investors should look for evidence that each business can grow while improving its own unit economics.
The draft records a cash balance of ₹16,475 crore, compared with ₹18,288 crore in Q1 FY27. A lower balance does not, by itself, identify the cause or establish financial stress. The movement must be reconciled with operating cash flow, investment spending, working capital, acquisitions and other financing or non-cash items disclosed by the company.
For a fast-expanding business, cash matters because store rollout, inventory and operational infrastructure can require funding before new locations reach maturity. Investors should check whether operating cash generation supports the expansion plan and whether management explains material changes in the cash balance.
It is useful to distinguish three questions: Is the core operation profitable on the company’s chosen adjusted metric? Does that operating performance convert into cash after investment needs? And do those cash returns justify the valuation investors are paying? These are related, but they are not the same question.
9. Key risks investors should monitor
Quarterly investor checklist
- ☐ Verify consolidated revenue and net profit against the exchange filing.
- ☐ Review net order value and revenue definitions by segment.
- ☐ Track mature-store productivity and the ramp-up of new stores.
- ☐ Compare adjusted EBITDA with reported profit and cash flow.
- ☐ Review capital expenditure, working capital and cash-balance movements.
- ☐ Reassess valuation using current market data, not historical headlines alone.
Eternal Q2 Results FY27: Verdict on Growth and Profitability
The figures in the supplied draft describe strong year-on-year growth in revenue and net profit, rapid expansion at Blinkit and an improvement in reported adjusted operating earnings. Food delivery also appears to have recorded healthy order-value growth, while the draft reports improved Hyperpure adjusted EBITDA.
The harder test is whether those developments translate into durable earnings and cash generation. A larger network can improve convenience and coverage, but it also requires capital, operational discipline and enough demand for new locations to mature. Investors need evidence that store additions generate attractive returns and that growth is not dependent on persistently elevated spending.
Get research-led market updates on WhatsApp
Follow the Positional Calls WhatsApp Channel for company results, market developments and research-focused financial insights. Channel updates are informational; verify time-sensitive claims against official disclosures.
Frequently asked questions
What was Eternal’s Q2 FY27 revenue?
The supplied draft states revenue from operations of ₹24,138 crore, up 77.6% year-on-year. Verify the figure against Eternal’s official exchange filing before publication.
What was Eternal’s Q2 FY27 net profit?
The draft states consolidated net profit of ₹125 crore, compared with ₹65 crore in Q2 FY26. The figure has not been independently verified in this article draft.
How did Blinkit perform in Q2 FY27?
The draft reports Blinkit net order value of ₹20,940 crore, up 79.3% year-on-year, and reported revenue of ₹19,152 crore, up 93.6%. Confirm the metrics and definitions in the official results materials.
How many Blinkit stores were reported at quarter-end?
The supplied draft says 2,751 stores after 308 net additions during the quarter. Verify this number against the company’s official disclosure.
What store expansion targets were reported?
The draft cites a target of more than 3,500 stores by March 2027 and approximately 5,000 by March 2028. These are management targets reported in the source material, not guaranteed outcomes; check the latest official commentary.
Does positive adjusted EBITDA mean Blinkit generates free cash flow?
No. Adjusted EBITDA is an operating measure and does not include every cash requirement, such as capital expenditure, working capital or lease-related outflows. Read it alongside cash-flow disclosures.
Is Eternal stock a buy after these results?
This article does not make a buy or sell recommendation. Investors should assess the current share price, valuation, segment economics, cash generation, risks and their own financial circumstances.
What is the main risk to Eternal’s growth strategy?
A key risk is that rapid Blinkit expansion does not generate sufficient incremental profitability and cash returns to justify the investment, particularly if competition or fulfilment costs intensify.
Sources and verification
Use the company’s official results materials as the primary verification point. Secondary reports can help explain market expectations and context, but should not replace the exchange filing.
- Eternal Investor Relations — official results and shareholder materials
- Business Standard — Eternal Q2 FY27 results coverage
- Reuters — Eternal quarterly profit and Blinkit expansion coverage
- Moneycontrol — Eternal Q2 results coverage
Editorial disclosure: This article is for informational and educational purposes only. It is not investment advice, a recommendation, or a guarantee of returns. Figures and management targets reproduced from the supplied draft must be reconciled with official filings before publication.

Shubham Chaudhary is the founder of PositionalCalls, an independent Indian stock market research website. He writes company fundamentals, quarterly results analysis, IPO analysis and sector research for NSE and BSE listed companies, with a focus on banking stocks, insurance and long-term value investing. Every article is built from primary sources such as RBI, SEBI, NSE and BSE filings and company annual reports, and states its risks plainly in simple language for retail investors.
Coverage areas Our research standards- Numbers checked against NSE, BSE and SEBI filings
- Risks and limits stated in every article
- No paid promotions or broker tie-ups
- Articles updated when new filings arrive