
Sector Outlook · FMCG
This FMCG sector outlook 2026 page tests Q2 FY27 company results, October inflation and input-cost data against dated sources, records where numbers disagree and gives no stock picks.
Quick answer
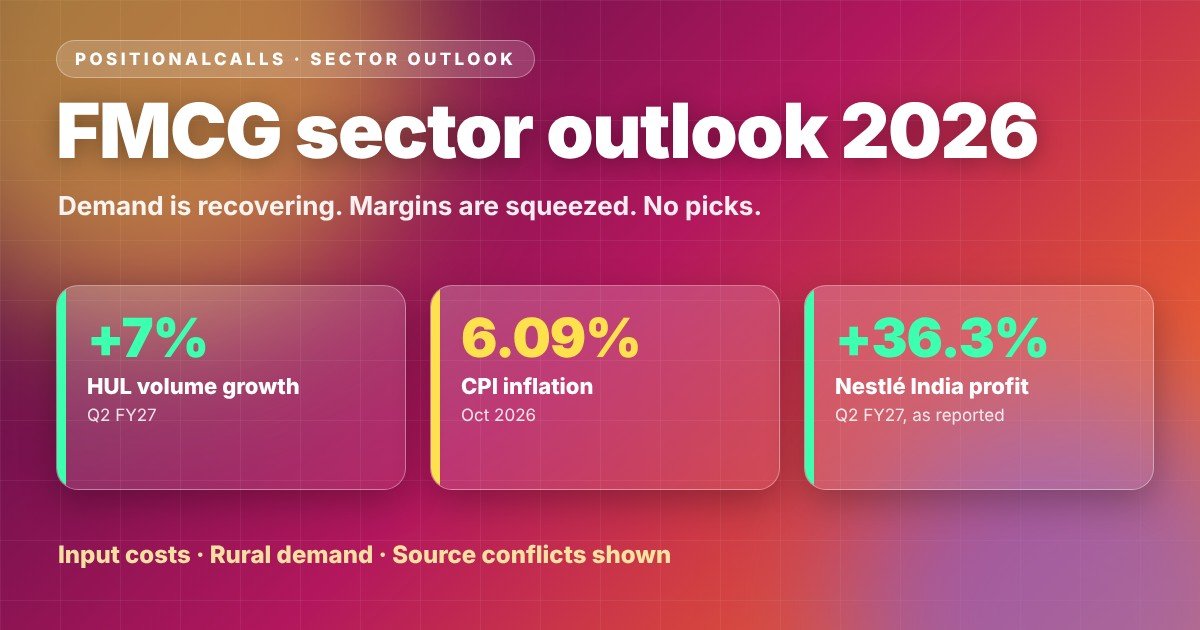
The FMCG sector outlook 2026 is recovering demand with squeezed margins. Hindustan Unilever reported 7% underlying volume growth and Nestlé India 20.5% sales growth in Q2 FY27, but inflation reached 6.09% in October, palm oil ran about 21% higher, and margins fell at several companies. Profit growth is uneven.
Key takeaways on the FMCG sector outlook 2026
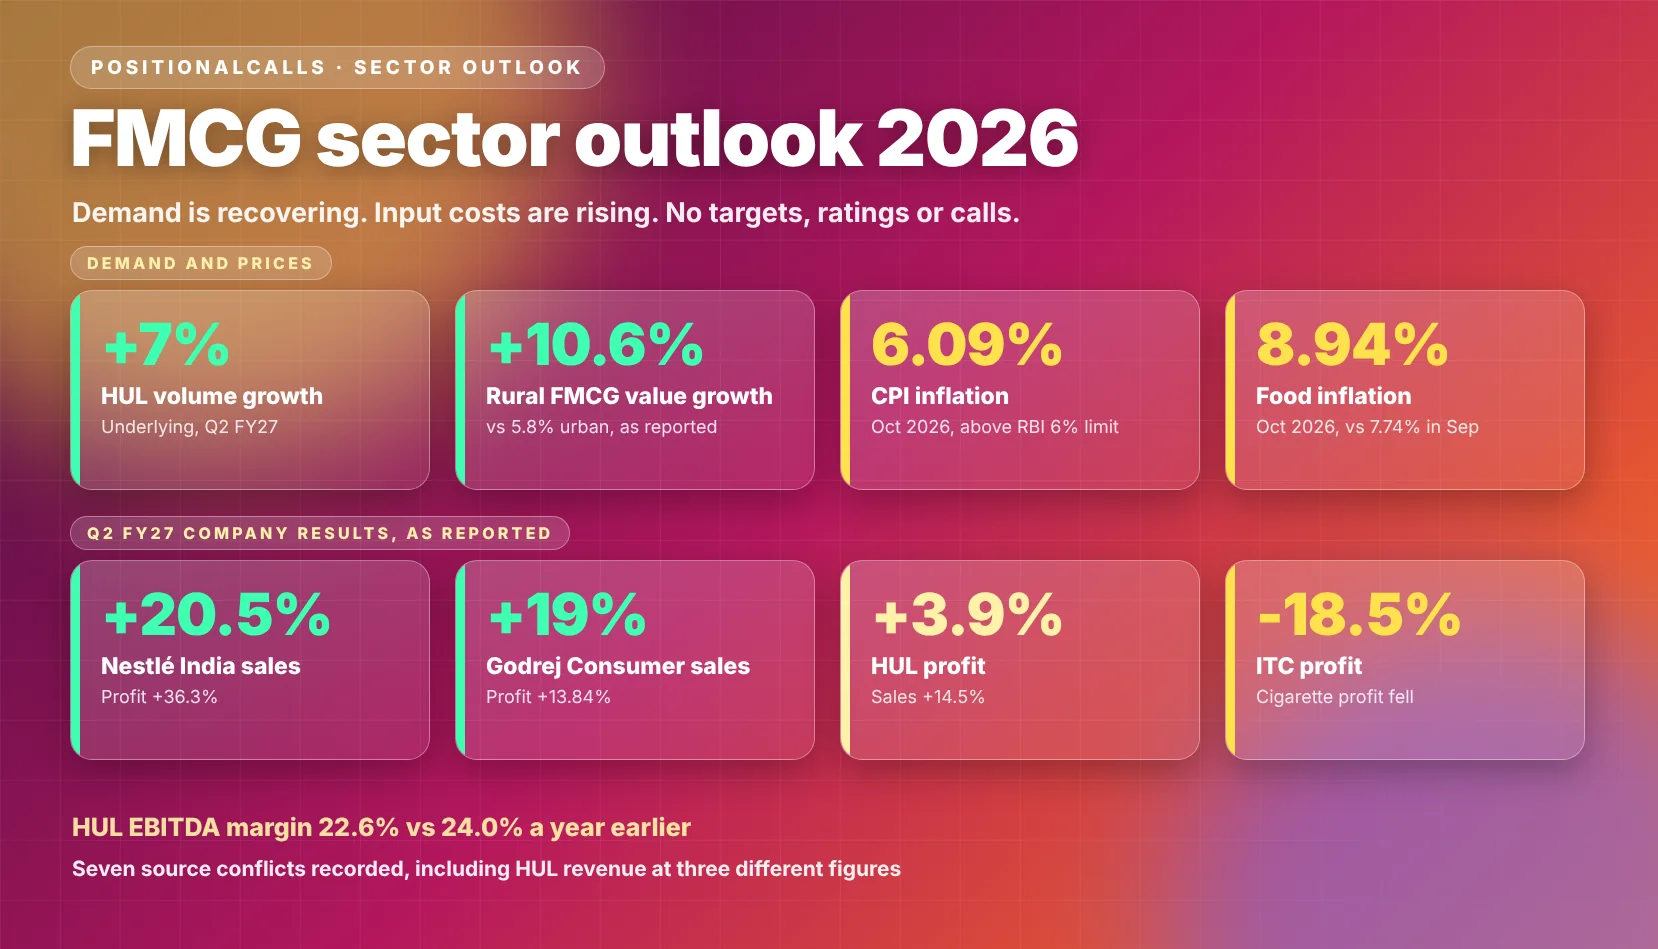
- Demand: volumes grew 7% to 8% at the two companies that reported a comparable figure, and rural markets led growth.
- Prices: inflation reached 6.09% in October 2026, and food inflation 8.94%.
- Margins: HUL’s EBITDA margin fell 140 basis points and Godrej Consumer’s 120 basis points.
- Profit: Q2 FY27 profit ranged from down 18.5% at ITC to up 36.3% at Nestlé India.
- Doubt: seven source conflicts are recorded, including the sector value growth figure.
In plain words: people are buying more soap, biscuits and packaged food, especially in villages. Companies have raised prices, but their raw materials, such as palm oil and packaging, cost more, so profit is not growing as fast as sales.
Data note: as of Saturday, 21 November 2026, 12:30 PM IST. Inflation figures are from the Ministry of Statistics and Programme Implementation release for October 2026 and news reports on it. Company figures are from Q2 FY27 results for the quarter ended 30 September 2026, as relayed by the sources named. I did not open the exchange filings, and lines marked as my arithmetic are my own calculation.
FMCG sector outlook 2026: where does the sector stand in November 2026?
The FMCG sector outlook 2026 shows demand that has recovered, with a cost problem that has not gone away. Fast-moving consumer goods, which cover soaps, detergents, packaged food, beverages and personal care, are bought often and in small amounts, so sales and costs show up in company results every quarter. The table collects the latest dated figures this page uses.
| Measure | Latest figure | Period | Source named |
|---|---|---|---|
| FMCG value growth | 8.6%, up from 6.8% in the previous quarter; provider not named in the report | Q2 FY27, July to September 2026 | Sahi, Whalesbook |
| Rural against urban FMCG growth | 10.6% rural against 5.8% urban | Q2 FY27 | Sahi |
| HUL underlying volume growth | 7%, with underlying sales growth of 15% | Q2 FY27 | Business Standard, 5paisa |
| India CPI inflation | 6.09%, against 5.54% in September | October 2026 | MoSPI, ThePrint |
| Food inflation | 8.94%, against 7.74% in September | October 2026 | MoSPI via Policy Edge |
| Policy repo rate | 5.50% after a 25 basis point increase | 7 October 2026 | RBI Monetary Policy Committee |
Cite this table: FMCG sector snapshot, PositionalCalls, Saturday, 21 November 2026, 12:30 PM IST, figures as reported by the sources named.
Two readings of this table are worth keeping apart. The first is demand: volumes are growing, rural markets are leading, and quick commerce is taking a larger share of urban sales. The second is cost: palm oil, sugar, packaging and crude-linked inputs cost more than a year ago, and inflation has crossed the RBI’s upper limit. This page treats demand as supported by company data and cost as the open question.
The sector value figure needs a caution. The 8.6% growth number comes from secondary reports that do not name the data provider, and it sits awkwardly beside NielsenIQ’s own figure of 12.9% value growth for the same quarter a year earlier. The conflicts section sets the two side by side, because a value figure and a volume figure measure different things in any FMCG sector outlook 2026 article.
What do the data show about demand in the FMCG sector outlook 2026?
Demand is growing in volume at the larger companies, and rural India is growing faster than urban India. The table puts the sector figures from the quarters available next to each other. Measures differ by source, so read each row as its own data point.
| Quarter | Value growth | Volume growth | Rural and urban | Source named |
|---|---|---|---|---|
| July to September 2025 | 12.9% | 5.4%, with prices up 7.1% | Rural volume 7.7%, urban 3.7% | NielsenIQ, 17 November 2025 |
| October to December 2025 | 7.8% | Not stated in the excerpt | Rural volume 2.9%, urban 2.3% | NIQ, 2026 release |
| July to September 2026 | 8.6%, up from 6.8% in the prior quarter | Not stated | Rural value 10.6%, urban value 5.8% | Sahi, Whalesbook; provider not named |
Cite this table: FMCG sector growth by quarter, PositionalCalls, Saturday, 21 November 2026, 12:30 PM IST, as reported; the rows use different measures and are not a clean series.
The rural lead is a pattern, not a one-quarter fact. NielsenIQ reported rural volume growth ahead of urban for seven consecutive quarters to September 2025, and the 2026 data say the same direction held, with rural value growth almost double urban. The same report on September 2026 says urban growth recovered late in the quarter, narrowing the gap to about 2 percentage points in the final month, which is derived from monthly figures of 10.3% rural and 8.2% urban.
How is quick commerce changing the FMCG sector outlook 2026?
Quick commerce, meaning delivery within minutes from local dark stores, was reported at 21% of total FMCG sales in the top 52 metros in Q2 FY27. NIQ had put e-commerce at an 18% share in the top eight metros for the October to December 2025 quarter, and it noted that small manufacturers were growing faster than larger players in volume. Whalesbook reported that quick commerce is capturing urban sales, which raises the question of who keeps the margin when a platform sits between the shelf and the buyer.
For company-level volume evidence, Hindustan Unilever reported underlying volume growth of 7% in Q2 FY27, Godrej Consumer 8%, and Nestlé India double-digit volume growth across its product groups. The sector-wide volume figure for the quarter was not stated in the sources found, so this page does not state one.
How do inflation and input costs shape the FMCG sector outlook 2026?
Retail inflation rose to 6.09% in October 2026, and company input costs rose faster than that in several categories. Two kinds of cost matter: what households pay for food, and what companies pay for palm oil, sugar, crude derivatives and packaging. The first table is the household side.
| Measure | September 2026 | October 2026 | Note |
|---|---|---|---|
| Headline CPI inflation | 5.54% | 6.09% | Highest of 2026; January was 2.74% |
| Consumer Food Price Index | 7.74% | 8.94% | Onion up 116.22% and garlic up 60.74% year on year |
| Rural headline CPI | 6.08% | 6.63% | Rural prices rose faster than urban |
| Urban headline CPI | 4.88% | 5.41% | Below the 6% limit |
Cite this table: India inflation, September and October 2026, PositionalCalls, Saturday, 21 November 2026, 12:30 PM IST, MoSPI data as reported by Policy Edge, ThePrint and DSIJ; new CPI series with base year 2024.
The new series has base year 2024, so comparisons with older data need care. The point for FMCG is direction: rural inflation of 6.63% cuts into the purchasing power that is driving the rural volume lead, and the RBI Governor has flagged a weak monsoon and stronger El Niño as risks to rural demand. For the full release, see India CPI inflation October 2026.
Which input costs are rising in the FMCG sector outlook 2026?
| Input | Reported change | Period | Source named |
|---|---|---|---|
| Palm oil, in rupee terms | About 21% higher year on year | September 2026 | Grant Thornton Bharat, via YourStory |
| Sugar | About 18% higher year on year, after an 8% monthly correction | September 2026 | Grant Thornton Bharat, via YourStory |
| Crude derivatives and packaging | Higher since the Middle East conflict began at the end of February 2026 | Q1 and Q2 FY27 | Reuters, via the Malaysian Palm Oil Board |
| Pre-results margin estimates | About 45 basis points of operating-margin compression across major staples; up to 150 basis points for some | Q2 FY27 | Analyst estimates, via YourStory |
Cite this table: FMCG input costs, PositionalCalls, Saturday, 21 November 2026, 12:30 PM IST, as reported; estimates are analysts’, not this page’s.
Companies answer cost pressure with price increases, smaller packs, or both. Britannia said it would add 1.5% to 2% in pricing through lower grammage on its Rs 5 and Rs 10 biscuit packs, and Godrej Consumer said it had held back larger price rises because of crude oil volatility. Upstox reported on 11 November 2026 that HUL had raised prices and that Dabur signalled an increase. The RBI’s repo rate decision matters here too; see RBI repo rate.
What did FMCG companies report for Q2 FY27 in the FMCG sector outlook 2026?
Six companies reported revenue growth of 5% to 20.5%, but profit ranged from down 18.5% at ITC to up 36.3% at Nestlé India. The table lists each result as reported, with the period and the source. Figures are for the quarter ended 30 September 2026.
| Company | Q2 FY27 revenue | Q2 FY27 profit | Source named |
|---|---|---|---|
| Hindustan Unilever | Rs 18,226 crore, up 14.5%; underlying sales up 15%, volume up 7% | Rs 2,790 crore, up 3.9% | Lakshmishree, Finology, InCred |
| ITC | Consolidated net revenue Rs 20,454 crore, up 5% | Consolidated Rs 4,229 crore, down 18.5% | Multibagg, Nifty Trader |
| Britannia | Standalone Rs 5,542 crore, up 16.6%; consolidated Rs 5,597.79 crore, up 15.6% | Standalone Rs 721 crore, up 10.2%; consolidated Rs 726 crore, up 10.8% | HDFC Sky, Multibagg |
| Nestlé India | Total sales Rs 6,782.2 crore, up 20.5% | Standalone Rs 1,026.77 crore, up 36.3% | Free Press Journal, Multibagg |
| Godrej Consumer Products | Rs 4,413.09 crore, up 19%; underlying volume up 8% | Rs 522.92 crore, up 13.84% | Multibagg, Kotak Neo |
| Dabur India | Consolidated Rs 3,563.07 crore, up 11.7% | Not stated in the source used | InCred |
Cite this table: FMCG Q2 FY27 results, PositionalCalls, Saturday, 21 November 2026, 12:30 PM IST, as reported; this page does not rank the companies.
Profit grew faster than sales only at Nestlé India, where cost of materials fell to 43.1% of sales from 45.5% a year earlier, per Multibagg. At Hindustan Unilever, sales growth of 14.5% turned into profit growth of 3.9%. At Godrej Consumer, revenue grew 19% and profit 13.84%, and at Britannia, revenue grew 16.6% and profit 10.2%. That gap between the top line and the bottom line is the central fact of the FMCG sector outlook 2026.
What drove each company’s result?
| Company | Growth driver reported | Pressure reported |
|---|---|---|
| Hindustan Unilever | Home care underlying sales up 22%; beauty and wellbeing up 16%; interim dividend Rs 19 declared | EBITDA margin 22.6% against 24.0%; personal care underlying volume flat |
| ITC | FMCG-others revenue up 19%, a 14-quarter high; paper and packaging revenue up 35.9% | Cigarette segment profit fell after what the source calls an unprecedented tax increase |
| Britannia | Broader channel participation and a 3.5% price increase | Input-cost inflation; no numeric margin guidance |
| Nestlé India | Volume-led growth in all product groups; confectionery gains | Food inflation; advertising and marketing spend up 46% |
| Godrej Consumer Products | Home care revenue up 19% to Rs 1,329 crore | EBITDA margin down 120 basis points; input inflation expected to intensify in Q3 |
| Dabur India | Growth across consumer care and food | Operating margin 17.75% against 18.43% a year earlier |
Cite this table: Drivers and pressures by company, PositionalCalls, Saturday, 21 November 2026, 12:30 PM IST, as relayed by the sources named; guidance is management’s, not this page’s.
Company pages are on the site: HUL Q2 results, ITC Q2 results, Britannia Q2 results, Dabur Q2 results and Marico Q2 results. The all-results view is the Q2 FY27 results scorecard.
How are margins and pricing changing in the FMCG sector outlook 2026?
Margins fell at four of the five companies that reported a comparable figure, and companies are weighing price rises against volume. The table puts the reported margin figures side by side. Definitions differ, so compare each company with its own earlier figure, not with other rows.
| Company | Margin reported | Earlier comparison | Source named |
|---|---|---|---|
| Hindustan Unilever | EBITDA margin 22.6% | 24.0% a year earlier, down 140 basis points | Lapaas Voice, citing Business Standard |
| Britannia | Operating margin 17.0% standalone; consolidated EBITDA margin 18.2% | 15.3% in Q1 FY27; consolidated 19.7% a year earlier | Business Today, Multibagg |
| Nestlé India | EBITDA margin 23.8% | About 1.9 points higher year on year | Craytheon, JM Financial |
| Godrej Consumer Products | EBITDA margin down 120 basis points | Year earlier | Ventura Securities |
| Dabur India | Operating margin 17.75% | 18.43% a year earlier | InCred |
Cite this table: FMCG margins, Q2 FY27, PositionalCalls, Saturday, 21 November 2026, 12:30 PM IST, as reported by the sources named; margin definitions differ by company.
Nestlé India is the exception, and its cost of materials fell as a share of sales. Everywhere else the pattern is the same: sales grow on price and volume, but input costs take back part of the gain. Britannia’s margin improved from the first quarter to 17.0%, which the company’s presentation attributed to strategic commodity covers, yet it is below the year-earlier level on the consolidated measure.
PositionalCalls WhatsApp channel
Follow sector pages in one place
- New sector outlooks as they are posted
- Results summaries without tips
- A message when a page is updated
Do price rises hurt volumes?
The evidence so far is that volumes have held. Companies took price rises of about 3% to 5%, according to Outlook Business, and still reported volume growth of 7% to 8% at Hindustan Unilever and Godrej Consumer. The risk is the next round. Post-Diwali price rises were being weighed against the danger of hurting demand, according to YourStory, and Godrej Consumer’s management expects input cost inflation to intensify in Q3, which would add to price pressure.
Anti-profiteering rules after last year’s GST cuts had limited price rises for a time, according to Angel One in February 2026. Price action has since returned. A sector outlook for FMCG therefore depends on one test: whether volume growth survives a second round of increases.
Where do sources disagree on the FMCG sector outlook 2026?
Seven conflicts appear in the Q2 FY27 data, and each changes how strong a number looks. The table shows both versions and the one this page uses.
| Item | Version A | Version B | How this page handles it |
|---|---|---|---|
| Sector value growth, Q2 FY27 | 8.6%, called a six-quarter high (Sahi, Whalesbook; provider not named) | NIQ reported 12.9% value growth for July to September 2025 | Shows both; the 8.6% figure is unconfirmed by a named provider |
| HUL Q2 revenue | Rs 18,226 crore, up 14.5% (Lakshmishree, Finology) | Rs 18,071 crore (5paisa) and Rs 18,037 crore (InCred) | Uses Rs 18,226 crore; did not open the filing |
| HUL Q2 profit | Rs 2,790 crore, up 3.9% (Business Standard headline, InCred) | Rs 2,796 crore reported profit after tax (5paisa) | Uses Rs 2,790 crore, owners’ share |
| ITC Q2 profit | Consolidated Rs 4,229 crore, down 18.5% (Multibagg, Nifty Trader) | Rs 4,137 crore, down 20.1%, which Upstox labels standalone and one report labels consolidated | Uses consolidated Rs 4,229 crore |
| ITC cigarette profit | Rs 3,813 crore, down 27.2% (Multibagg) | Rs 4,044.49 crore, down 26% (Multibagg, consolidated segment table) | Shows both; segment basis not confirmed |
| Britannia margin | 17.0% operating margin (standalone, Business Today) | 18.2% to 18.3% EBITDA margin (consolidated, Multibagg, Arthneeti) | Uses each with its basis stated |
| GCPL share price fall after results | About 7% (Business Standard) | Nearly 4% (Ventura Securities) | Not used as evidence; intraday timing differs |
Cite this table: Source conflicts in FMCG data, PositionalCalls, Saturday, 21 November 2026, 12:30 PM IST, as recorded from the sources named.
Most of these are definition gaps: standalone against consolidated, owners’ share against total, or a segment table with a different boundary. The one that changes the reading is the sector value figure. A six-quarter high of 8.6% sits oddly beside 12.9% a year earlier, and I could not open the original release to settle it, so the FMCG sector outlook 2026 on this page leans on company results.
What are the risks to the FMCG sector outlook 2026?
Six risks could make the FMCG sector outlook 2026 wrong, and two are visible in reported numbers. Red marks risks that already show in results, amber marks measures to watch, and blue marks risks that depend on future events.
How do the six risks connect?
The risks feed each other. Dearer palm oil and crude derivatives push companies to raise prices, higher food inflation squeezes the household budget those prices are charged to, and a weak monsoon would hit the rural buyers who have been driving growth. That chain is why this page treats a single quarter of volume growth as a signal to check, not a conclusion.
Bottom line
The FMCG sector outlook 2026 is strong on demand and uncertain on margins. Volumes grew, rural markets led and Nestlé India reported higher profit, but inflation crossed 6%, input costs rose, and profit growth lagged sales at most companies checked.
What should you watch next in the FMCG sector outlook 2026?
Watch the November inflation release, the December policy meeting and Q3 FY27 results. The table gives each item and the figure to compare it against.
| Item to watch | Why it matters | Compare against |
|---|---|---|
| CPI inflation for November 2026, released 14 December | Shows whether food inflation keeps rising | October: 6.09% headline, 8.94% food |
| RBI policy meeting, December 2026 | Decides the funding and demand backdrop | Repo rate 5.50% from 7 October 2026 |
| Palm oil, sugar and crude-linked costs in Q3 results | Tests whether margin pressure intensifies | Palm oil about 21% higher, sugar about 18% higher in September |
| Underlying volume growth at HUL and GCPL in Q3 | Tests whether volumes survive price rises | HUL 7% and GCPL 8% in Q2 FY27 |
| Rural against urban growth data for Q3 | Tests the rural lead against rural inflation | Rural 10.6% against urban 5.8% in Q2 FY27, as reported |
| ITC cigarette volumes and segment profit | Tests the tax impact | Segment profit down 27.2% in Q2 FY27, as reported |
Cite this table: FMCG watch list, PositionalCalls, Saturday, 21 November 2026, 12:30 PM IST, dates as reported; later dates may move.
Inflation data arrive monthly and company results quarterly, so the two move at different speeds. If your decision depends on one month, use the quarterly company results, because they include margins and volumes that the inflation release does not.
How should you read FMCG data in the FMCG sector outlook 2026?
Read volume first, then price, then margin, and never treat one quarter as a trend. The steps below work for any FMCG company or survey release.
- Check whether growth is in value or volume, because value growth includes price rises.
- Check whether profit is standalone or consolidated, and whether it is the owners’ share.
- Read underlying volume growth before headline sales, since price can mask weak demand.
- Read the margin next to the earlier-year margin of the same company.
- Open the investor presentation when two sources give different figures.
What are the main FMCG measures?
| Measure | What it counts | Where it comes from | Common trap |
|---|---|---|---|
| Underlying volume growth | Growth in units sold, excluding price and acquisitions | Company releases | Companies define it differently |
| Underlying sales growth | Sales growth excluding currency and acquisitions, including price | Company releases | Includes price rises |
| EBITDA margin | Operating profit before interest, tax and depreciation as a share of sales | Company results | Standalone and consolidated differ |
| Value growth | Growth in sales value across a market | Survey firms such as NIQ | Needs a named provider and period |
| CPI food inflation | Annual change in the food price index | MoSPI | New 2024 base year series |
Cite this table: FMCG measures explained, PositionalCalls, Saturday, 21 November 2026, 12:30 PM IST, general definitions.
For a sector page, the useful question is whether growth is paying for its own costs. In a year of rising inputs, check whether margins held while volumes grew. Check the date, since the sector picture moves, and this page carries its own Updated line.
What pages sit beside this FMCG page?
The company results pages, the inflation page and the other sector outlooks give the surrounding layer.
- Sector hub: sector outlook India, the sector pages
- Related sectors: banking sector outlook 2026, NBFC sector outlook 2026 and insurance sector outlook 2026
- Inflation: India CPI inflation October 2026
- Company results: HUL Q2 results, ITC Q2 results, Britannia Q2 results, Dabur Q2 results and Marico Q2 results
- Dates: earnings calendar
This page is the sector view. It does not rank companies or give targets. The results pages show company figures, so use them for that job.
Sources for this FMCG page
Every figure comes from the sources below, read on 21 November 2026. I did not open exchange filings, investor presentations or the original survey releases for each figure, so use the links to reach the primary source.
- MoSPI: Press Release of CPI for October 2026
- ThePrint: October retail inflation breaches the RBI’s 6% ceiling
- The Policy Edge: Food prices rise nearly 9% from a year ago, 12 November 2026
- DSIJ: India’s retail inflation rises to 6.09% in October 2026, 14 November 2026
- Oneindia: India retail inflation jumps to 6.09% in October
- Sahi: India FMCG value growth hits six-quarter high of 8.6% in Q2 FY27
- Whalesbook: FMCG sector grows 8.6% in Q2 FY27 on rural and quick commerce surge
- NIQ: GST 2.0 sparks short-term dip in FMCG demand, 17 November 2025
- NIQ: GST 2.0 transition reshapes India’s FMCG growth landscape
- YourStory: FMCG firms grapple with input cost inflation in Q2, October 2026
- Upstox: HUL raises prices, Dabur signals increase, 11 November 2026
- Malaysian Palm Oil Board: Reuters on India’s FMCG margin squeeze, July 2026
- The Pioneer: FMCG firms signal price hikes in Q2
- Outlook Business: FMCG companies bracing for another round of price increases
- Angel One: FMCG companies raise prices by up to 5%, 18 February 2026
- Lakshmishree: HUL Q2 results
- Finology Ticker: HUL Q2 FY27 results analysis
- 5paisa: HUL Q2 FY27 results
- InCred Money: HUL Q2 FY27 results
- Lapaas Voice: HUL Q2 FY27 results
- Multibagg: ITC Q2 profit falls 18.5% as cigarette earnings weaken
- Finology Ticker: ITC Q2 FY27 results analysis
- Upstox: ITC Q2 FY27 result, 2 November 2026
- Nifty Trader: ITC Q2 FY27 results
- Lapaas Voice: ITC Q2 cigarette business drags profit
- Multibagg: ITC Q2 FY27 standalone profit and segments
- Multibagg: Britannia Q2 revenue and price increase
- Arthneeti: Britannia Q2 FY27 earnings
- Craytheon: Nestlé India Q2 FY27 results
- HDFC Sky: Britannia Q2 results
- Business Today: Britannia Q2 results, 6 November 2026
- Multibagg: Britannia Q2 margin returns to 17% amid input inflation
- Free Press Journal: Nestlé India Q2 FY27 profit
- Multibagg: Nestlé India Q2 FY27
- JM Financial: Nestlé India Q2 profit, 15 October 2026
- Kotak Neo: Godrej Consumer Products Q2 FY27 results
- Ventura Securities: Godrej Consumer Q2 results
- InCred Money: Dabur India Q2 FY27 results
Where a source is a news report on company data, the report is named, not the company. If any figure differs from the primary release, the primary release governs.
Disclaimer: PositionalCalls is not a SEBI-registered research analyst or investment adviser. This page is general information and gives no target, rating or buy or sell call. Figures may have changed since the date shown.
PositionalCalls WhatsApp channel
Keep sector updates together
- Quarterly result summaries
- Budget and policy changes
- Links to new sector pages
FMCG sector outlook 2026: frequently asked questions
What is the FMCG sector outlook 2026 for India?
Demand is recovering, but margins are under pressure. One secondary source reports FMCG value growth of 8.6% in Q2 FY27, led by rural markets, while Hindustan Unilever reported 7% underlying volume growth. Against that, October inflation reached 6.09% and palm oil ran about 21% higher. This page tests that view against dated data and makes no stock call.
How fast is FMCG volume growing in 2026?
Company data show volume growth of 7% at Hindustan Unilever and 8% at Godrej Consumer in Q2 FY27, and double-digit volume growth across Nestlé India’s product groups. Sector-wide volume for the quarter was not stated in the sources found. The FMCG sector outlook 2026 therefore rests on company volumes and a value figure, not a confirmed sector volume number.
Is rural demand driving the FMCG sector outlook 2026?
Reported data say yes. A secondary source puts rural FMCG value growth at 10.6% in Q2 FY27 against 5.8% in urban markets, and says the gap narrowed in September. Rural consumers also face higher inflation: rural CPI was 6.63% in October 2026 against 5.41% in urban areas, so the rural lead depends on the monsoon and food prices.
Why are FMCG margins falling in 2026?
Input costs rose faster than prices. Hindustan Unilever’s EBITDA margin was 22.6% against 24.0% a year earlier, and Godrej Consumer’s fell 120 basis points. Palm oil was about 21% higher and sugar about 18% higher year on year in September, according to Grant Thornton Bharat. The FMCG sector outlook 2026 treats margins as the open question, not demand.
Which FMCG companies reported Q2 FY27 results on this page?
Six: Hindustan Unilever, ITC, Britannia, Nestlé India, Godrej Consumer Products and Dabur. Revenue rose 5% to 20.5%, but ITC’s profit fell 18.5% on cigarettes and Hindustan Unilever’s rose 3.9%. The page lists each result with its period and source, flags where sources disagree, and does not rank the companies or give a target.
Is the FMCG sector outlook 2026 affected by inflation?
Yes. India’s retail inflation reached 6.09% in October 2026, above the RBI’s 6% upper limit, and food inflation reached 8.94%. Higher food prices squeeze household budgets, while crude-linked and palm oil costs squeeze company margins. The RBI raised the repo rate to 5.50% on 7 October 2026. Watch the November inflation release on 14 December.
Why do sources disagree on FMCG numbers?
They mix standalone and consolidated figures, rounded and unrounded values, and different cut-off times. Hindustan Unilever’s Q2 revenue appears as Rs 18,226 crore, Rs 18,071 crore and Rs 18,037 crore, and ITC’s profit appears as Rs 4,229 crore and Rs 4,137 crore. The FMCG sector outlook 2026 conflicts table lists each pair and the version used.
Does this FMCG sector outlook 2026 page recommend stocks?
No. PositionalCalls is not a SEBI-registered research analyst or investment adviser. This page reports company, government and survey figures with sources, labels its own arithmetic and records where sources disagree. It gives no target, rating or buy or sell call, and it leaves out brokerage picks. Open the filings before you decide anything.
What are the main risks in the FMCG sector outlook 2026?
Six risks: input costs rising further, food inflation squeezing rural and urban budgets, a weak monsoon or El Niño, price hikes that dent volumes, quick commerce shifting margins and share, and cigarette taxation at ITC. Godrej Consumer’s management expects input cost inflation to intensify in Q3. Each risk is sourced in the risks section of this page.
How often is the FMCG sector outlook 2026 page updated?
After each monthly inflation release, each results season and each policy meeting. The next inflation release, for November 2026, is due on 14 December 2026, and Q3 FY27 results follow in January and February. Check the Updated line and the data note first, since every figure on this page carries the date of its source.

Shubham Chaudhary is the founder of PositionalCalls, an independent Indian stock market research website. He writes company fundamentals, quarterly results analysis, IPO analysis and sector research for NSE and BSE listed companies, with a focus on banking stocks, insurance and long-term value investing. Every article is built from primary sources such as RBI, SEBI, NSE and BSE filings and company annual reports, and states its risks plainly in simple language for retail investors.
Coverage areas Our research standards- Numbers checked against NSE, BSE and SEBI filings
- Risks and limits stated in every article
- No paid promotions or broker tie-ups
- Articles updated when new filings arrive