
Sector Outlook · Hospitals
This hospital sector outlook 2026 page tests ICRA’s FY27 forecasts and India’s occupancy and revenue per bed against the Q2 FY27 results of Apollo, Max, Fortis and Narayana, records where numbers disagree and gives no stock picks.
Quick answer
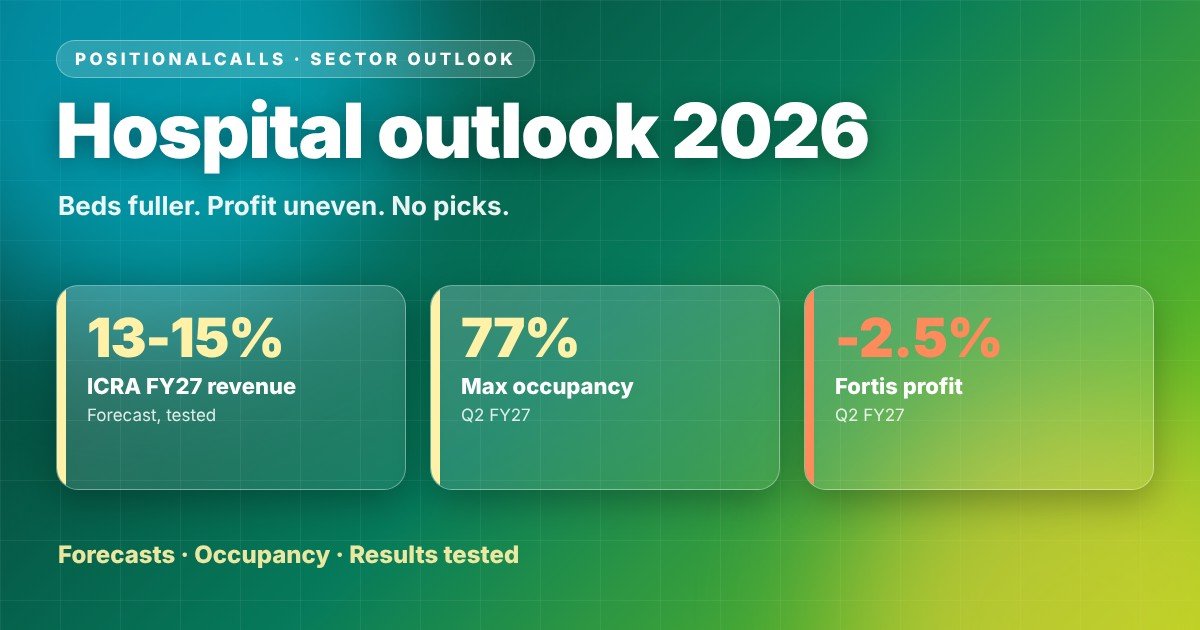
The hospital sector outlook 2026 is strong demand and occupancy with mixed profit growth. ICRA expects 13% to 15% revenue growth in FY27, and Q2 FY27 occupancy was 77% at Max, 73% at Apollo and 72% at Fortis, but Fortis profit fell and Apollo’s hospital margin slipped 60 basis points.
Key takeaways on the hospital sector outlook 2026
- Forecast: ICRA expects 13% to 15% revenue growth and 6% to 8% ARPOB growth in FY27.
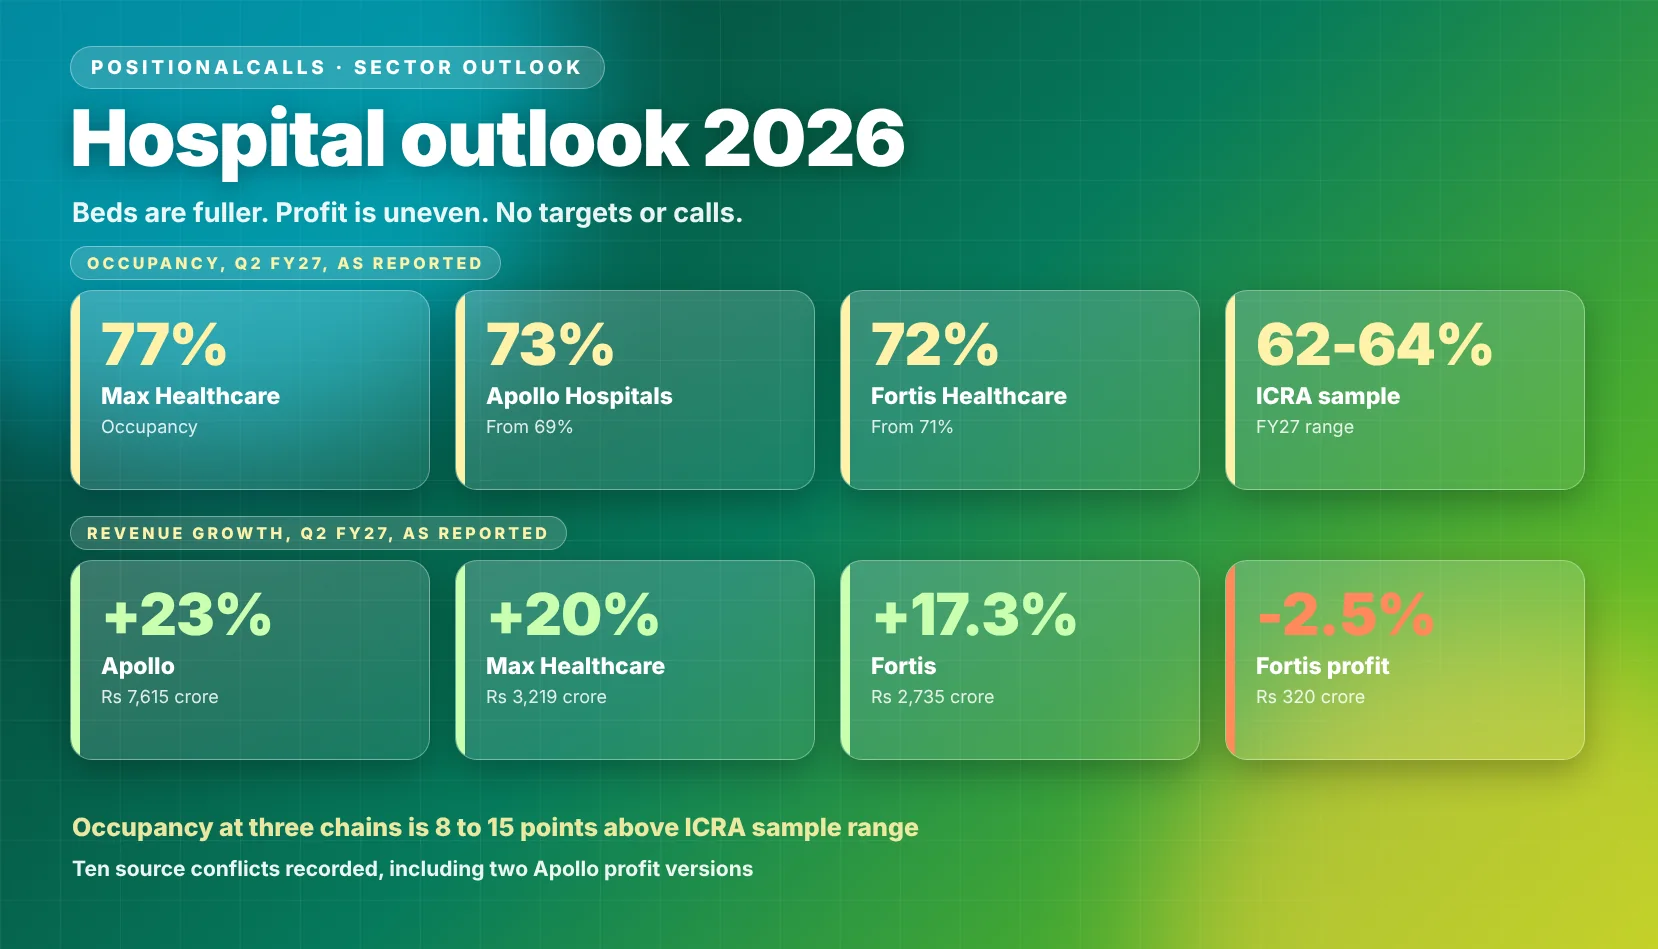
- Results: Apollo, Max and Fortis grew revenue 17.3% to 23% in Q2 FY27, above ICRA’s range.
- Occupancy: 72% to 77% at the three chains, 8 to 15 points above ICRA’s sample range.
- Margins: Apollo’s hospital margin fell 60 basis points to 24.0%, and Max’s profit margin fell to 14.7%.
- Doubt: ten source conflicts are recorded, including two versions of Apollo’s profit.
In plain words: More people are using private hospitals, beds are mostly full and the big chains are adding many more beds. Sales are growing faster than the experts forecast, but profits are not always keeping up because new hospitals take time to fill and costs rise.
Data note: as of Saturday, 21 November 2026, 2:30 PM IST. Company figures are for the quarter ended 30 September 2026, as relayed by the sources named. ICRA, EY and CareEdge figures come from search excerpts of their reports. I did not open the exchange filings, company presentations or the full ICRA reports, and lines marked as my calculation are my own arithmetic. Analysis only: no buy or sell calls, targets or price zones.
Latest update
- 21 November 2026, 2:30 PM IST: company results run to Narayana on 30 October, Max on 30 October, Apollo on 4 November, Fortis on 5 November and Aster DM on 6 November; ICRA’s latest figures are from 30 July 2026.
Hospital sector outlook 2026: where does the sector stand in November 2026?
The hospital sector outlook 2026 shows strong revenue growth and high occupancy, with margins and profit growth less even. The table collects the latest dated figures this page uses.
| Measure | Latest figure | Period | Source named |
|---|---|---|---|
| Sector revenue growth forecast | 13% to 15% in FY27 and 15% to 17% in FY28, ARPOB up 6% to 8% | ICRA, 30 July 2026 | ICRA |
| Sector occupancy | 63.5% in FY26; 62% to 64% expected through FY27 | ICRA sample of 11 listed companies | ICRA, Business Standard |
| Apollo Hospitals revenue and profit | Rs 7,615 crore, up 23%; profit Rs 630 crore, up 32% | Q2 FY27 | Kotak Neo, Multibagg |
| Max Healthcare revenue | Rs 3,219 crore, up 20%; occupancy 77% | Q2 FY27 | Multibagg |
| Fortis Healthcare revenue and profit | Rs 2,735 crore, up 17.3%; profit Rs 320 crore, down 2.5% | Q2 FY27 | Multibagg |
| Narayana Hrudayalaya revenue | Rs 2,844 crore, up 73% with a UK acquisition; India up 16.6% | Q2 FY27 | Kotak Neo, Arthneeti |
Cite this table: Hospital snapshot, PositionalCalls, Saturday, 21 November 2026, 2:30 PM IST, figures as reported by the sources named.
Two readings of this hospital sector outlook 2026 table are worth keeping apart. Revenue growth is running above ICRA’s forecast range at three of the four chains. Profit growth is uneven: Fortis reported a fall, and the growth gap between revenue and profit is the point to watch.
The sector overlaps with other pages on this site. Drug makers sit on the pharma sector outlook 2026, health cover that funds many admissions on the insurance sector outlook 2026, and the largest chain’s results on the Apollo Hospitals Q2 results page. This page stays on hospital providers.
Did Q2 FY27 results meet the ICRA forecast in the hospital sector outlook 2026?
Revenue growth at Apollo, Max and Fortis in Q2 was above ICRA’s 13% to 15% FY27 forecast, while occupancy was well above its sample range. The table sets the forecast against reported figures.
| Measure | ICRA forecast or sample | Reported in Q2 FY27 | Source named |
|---|---|---|---|
| Revenue growth | 13% to 15% for FY27 | Apollo up 23%, Max up 20%, Fortis up 17.3%, Narayana India up 16.6% | ICRA; company results via Multibagg, Arthneeti |
| ARPOB or revenue per patient | ARPOB up 6% to 8% for FY27 | Apollo revenue per patient up 8%; Fortis revenue per patient up 6.8% | ICRA; Quartr, Multibagg |
| Occupancy | 62% to 64% through FY27 | Max 77%, Apollo 73%, Fortis 72% | ICRA; Multibagg, Omnicuris |
| FY26 base | Revenue up 18%, occupancy 63.5%, ARPOB up 9.2% | Not applicable | ICRA |
Cite this table: ICRA hospital forecast against reported Q2 FY27 results, PositionalCalls, Saturday, 21 November 2026, 2:30 PM IST, as reported; the samples differ.
The forecast is for a sample of 11 listed companies over a full year, while the Q2 figures cover four larger chains over one quarter, so the comparison shows direction, not a verdict. Growth above the forecast range is consistent with ICRA’s view that expansion and ramp-up support revenue. ICRA’s ARPOB range of 6% to 8% also matches the per-patient growth Apollo and Fortis reported, though per-patient and per-bed measures are not identical.
What do other agencies forecast for the hospital sector outlook 2026?
| Source | Date | Reported view | Source named |
|---|---|---|---|
| CareEdge Ratings | 1 January 2026 | Sector to sustain 11% to 12% growth, driven by insurance penetration and medical tourism | IBEF, Lokmat Times |
| EY-Parthenon | 22 July 2026 | FY26 growth led by hospitals and diagnostics; single-specialty operators grew revenue above 15% with EBITDA margins near 30% | Business Today, Tribune |
| Sharekhan | 10 May 2026 | India has 1.3 hospital beds per 1,000 people against a global median of 2.9 | Webindia123, from ANI |
| ICRA | 24 December 2025 | Outlook remains Positive for FY26 and FY27 | ICRA |
Cite this table: Other agency views on hospitals, PositionalCalls, Saturday, 21 November 2026, 2:30 PM IST, as reported; each is a single-source item.
The agencies agree on direction. CareEdge’s 11% to 12% is a long-run growth rate, while ICRA’s 13% to 15% is for one year, so they are not in conflict.
How large is the capacity build in the hospital sector outlook 2026?
Large chains are adding thousands of beds, but ICRA estimates the additions at only 2.3% to 2.5% of existing private capacity. The table lists the capacity and capex evidence.
| Item | Evidence | Source named |
|---|---|---|
| Sector capex | Outlay of about Rs 40,000 crore over FY26 to FY30 towards 34,000 or more beds | ICRA, February 2026 |
| Regional split | About 42% to 44% of additions in North India, 31% to 33% in the South and 16% to 18% in the West | ICRA, February 2026 |
| Private share | Private sector holds about 62% to 63% of hospitals and 59% to 60% of beds | ICRA |
| Size of additions | About 2.3% to 2.5% of existing private hospital capacity | ICRA, via Business Standard |
| Max Healthcare | Beds to rise from 5,000 in FY25 to 9,000 to 9,500 by FY28, led by Nanavati Max, Max Smart Saket and Max Mohali | Business Standard |
| Apollo Hospitals | Plans to add more than 5,800 beds over five years | Kotak Neo |
| Public spending | Public healthcare spending around 3% to 3.5% of GDP | ICRA |
Cite this table: Hospital capacity and capex, PositionalCalls, Saturday, 21 November 2026, 2:30 PM IST, as reported by the sources named.
The capex figure has changed with the period quoted. ICRA’s July 2025 note spoke of Rs 32,000 crore of capex planned by FY27, while its February 2026 report gives Rs 40,000 crore over FY26 to FY30, so the two are not like for like. Business Standard’s reading is that the build adds to organised chains’ share without lifting national bed availability much.
Will new beds dilute occupancy in the hospital sector outlook 2026?
Q2 results suggest not yet. Max said new beds are ramping up faster, per Business Standard, and still reported 77% occupancy on a larger base. Apollo’s new hospitals carried a Rs 35 crore EBITDA loss in Q2, per Quartr, which shows the cost of ramp-up even when group occupancy rises.
What did hospital chains report for Q2 FY27 in the hospital sector outlook 2026?
Revenue grew at all four chains, but profit ranged from a 2.5% fall at Fortis to a 32% rise at Apollo. Figures are for the quarter ended 30 September 2026, as reported.
| Company | Q2 FY27 revenue | Q2 FY27 profit | Operating detail | Source named |
|---|---|---|---|---|
| Apollo Hospitals, consolidated | Rs 7,615 crore, up 23% | Rs 630 crore, up 32%; Rs 659.50 crore on one other source | EBITDA Rs 1,191 crore, up 29%; Healthcare Services revenue Rs 3,900 crore, up 23%, margin 24.0% | Kotak Neo, Multibagg, Compounding AI |
| Max Healthcare | Rs 3,219 crore, up 20% | Network profit Rs 448 crore, up 10% | Operating EBITDA up 18%; profit margin 14.7% against 15.7% normalised | Multibagg, PTI via HDFC Sky |
| Fortis Healthcare, consolidated | Rs 2,735 crore, up 17.3% from Rs 2,331 crore | Rs 320 crore, down 2.5%; profit before exceptional items up 6.8% to Rs 429 crore | Operating EBITDA before ESOP Rs 663 crore, up 19.2%, margin 24.2% | Multibagg |
| Narayana Hrudayalaya, consolidated | Rs 2,844 crore, up 73%; India Rs 1,440 crore, up 16.6% | Rs 301.15 crore, up 16.56% | EBITDA Rs 605.4 crore, up 42%; UK acquisition drives the revenue jump | Kotak Neo, JM Financial, Arthneeti |
Cite this table: Hospital company results, Q2 FY27, PositionalCalls, Saturday, 21 November 2026, 2:30 PM IST, as reported; this page does not rank the companies.
Each line needs a qualifier. Narayana’s 73% revenue growth comes mainly from the UK acquisition, so its India growth of 16.6% is the like-for-like figure. Fortis’s profit fell because exceptional gains dropped to Rs 3 crore from Rs 24 crore, while profit before exceptional items rose. Max’s profit base last year included a gain, so its profit growth looks lower than its revenue growth. The site’s Apollo Hospitals Q2 results page carries the company detail.
How do the segments compare in the hospital sector outlook 2026?
| Company | Segment detail | Source named |
|---|---|---|
| Apollo Hospitals | Apollo HealthCo revenue Rs 3,286 crore, up 23%; international patient revenue up 37%; oncology up 28%, gastroenterology up 27%; H1 revenue Rs 14,547 crore, up 22%, H1 profit Rs 1,211 crore, up 33% | Multibagg, Compounding AI |
| Fortis Healthcare | Hospital revenue Rs 2,340 crore, up 18.6%; diagnostics (Agilus) gross revenue up 12.2% with profit Rs 68 crore | Multibagg |
| Max Healthcare | Delhi gross revenue Rs 1,639 crore on 2,676 beds at 79% occupancy; Uttar Pradesh Rs 661 crore on 1,247 beds at 79% | Multibagg |
| Narayana Hrudayalaya | UK business made a profit-after-tax loss of GBP 2.7 million; India insurance and clinic losses narrowed to Rs 20 crore from Rs 33 crore | Multibagg |
Cite this table: Hospital segment detail, Q2 FY27, PositionalCalls, Saturday, 21 November 2026, 2:30 PM IST, as reported.
The pattern is that core hospital revenue is growing at high-teens to low-twenties while adjacent businesses behave differently: diagnostics grew slower than hospitals at Fortis, and Narayana’s overseas operations added revenue but a small loss. The wider health-cover picture sits on the insurance sector outlook 2026 page.
How do occupancy and revenue per bed compare in the hospital sector outlook 2026?
Occupancy at the three listed chains with data was 72% to 77%, and revenue per patient rose 6.8% to 8% where reported. The table lines up the operating measures.
| Company | Occupancy | Volume | Revenue per patient | Source named |
|---|---|---|---|---|
| Apollo Hospitals | 73%, from 69% | Inpatient discharges up 14% to 185,980 | Up 8% to Rs 1,86,880 | Quartr, Multibagg |
| Max Healthcare | 77% | Discharges up 12% to 98,464 | Not found for Q2 FY27 | Multibagg |
| Fortis Healthcare | 72%, from 71% | Occupied beds up 9% to 3,616; patient volume up 5.8% | Up 6.8% to Rs 2.10 lakh | Sovrenn, Omnicuris |
| Narayana, India | Not found | Not found | India margin 26.8% on one source and 24.6% on another | Multibagg, Arthneeti |
Cite this table: Hospital operating measures, Q2 FY27, PositionalCalls, Saturday, 21 November 2026, 2:30 PM IST, as reported; definitions of revenue per patient differ by company.
Apollo’s occupancy gain of four points is the largest reported, and its volume growth of 14% outran Fortis’s 5.8%. Fortis’s revenue per patient and Apollo’s grew at similar rates, so volume differences explain most of the gap in revenue growth. Max’s oncology share of inpatient revenue fell to 20.9% from 25.7%, per Multibagg, which changes mix even where volume grows.
Do high-margin hospitals run fuller beds in the hospital sector outlook 2026?
PositionalCalls WhatsApp channel
Follow sector pages in one place
- New sector outlooks as they are posted
- Results summaries without tips
- A message when a page is updated
| Fortis facility band, Q2 FY27 | Beds and occupancy | Revenue per patient | Source named |
|---|---|---|---|
| Operating EBITDA margin above 20% | 15 facilities, 3,876 beds, 76% occupancy; 84.3% of hospital revenue | Rs 2.22 lakh | Multibagg |
| Margin 10% to 15% | 4 facilities, 707 beds, 64% occupancy | Rs 1.72 lakh | Multibagg |
| Margin below 10% | 2 facilities, 2.7% of hospital revenue, 54% occupancy | Rs 1.36 lakh | Multibagg |
Cite this table: Fortis margin bands against occupancy, Q2 FY27, PositionalCalls, Saturday, 21 November 2026, 2:30 PM IST, as reported.
The bands show the link plainly: facilities above a 20% margin ran 22 points more occupancy than those below 10%, which is my calculation. It is the reason ramp-up units pull on group margins while they fill.
What do the derived numbers show in the hospital sector outlook 2026?
Ten checks tie reported figures together and show how occupancy, volume and price combine. Every row in this table is my calculation from the sourced figures above.
| Check | My calculation | Reading |
|---|---|---|
| Apollo Healthcare Services growth | 3,899.8 / 3,169 = up 23.1%; EBITDA 936.5 / 3,899.8 = 24.0% | Ties to the reported 23% and 24.0% |
| Apollo volume and price | 1.23 / 1.14 = about 7.9% revenue per discharge | Matches the 8% revenue per patient |
| Apollo new-hospital losses | H1 loss Rs 73 crore / guide Rs 150 crore = 48.7% | About half the full-year allowance, one secondary source |
| Apollo sequential change | Revenue 7,615 / 7,043 = up 8.1%; profit 630 / 581 = up 8.4% | Q1 base from Kotak Neo |
| Max price and mix | Revenue up 20% on discharges up 12.4%: 1.20 / 1.124 = about 6.8% per discharge | Rest of growth is price and mix |
| Fortis hospital share | 2,340 / 2,735 = 85.6% of revenue | Hospitals dominate the mix |
| Fortis occupancy gap by band | 76% less 54% = 22 points | High-margin units run fuller beds |
| Fortis profit change | 320 / 329 = down 2.7% | Reported as down 2.5%; rounding of the rupee figures |
| Narayana India share | 1,440 / 2,844 = 50.6% of consolidated revenue | Half the revenue is overseas |
| Occupancy against ICRA sample | 72% less 64% = 8 points; 77% less 62% = 15 points | Chains sit 8 to 15 points above the sample range |
Cite this table: Derived hospital numbers, PositionalCalls, Saturday, 21 November 2026, 2:30 PM IST, my calculation from the sourced figures.
How much of hospital revenue growth is volume rather than price?
Using Apollo’s figures, 14% discharge growth and 8% revenue per patient combine to about 23% revenue growth, so volume carries more than half of it. Max’s per-discharge gain of about 6.8% is lower, so volume is again the larger part. That mix is why occupancy and bed additions matter for the hospital sector outlook 2026.
What do agencies and management say about hospitals, as reported?
Reported views are constructive on demand and cautious on margins and ramp-up, and none of them is a stock call on this page. The table lists statements with dates and sources, and later results will test each forecast against reported figures.
| Source | Date | Reported view | Source named |
|---|---|---|---|
| ICRA | 30 July 2026 | Positive outlook; revenue growth of 13% to 15% in FY27 and 15% to 17% in FY28 on bed additions and ramp-up | ICRA |
| Fortis management | Q2 FY27 call | Hospital revenue growth of 15% or more in FY27 excluding acquisitions; EBITDA margin to improve about 150 basis points; diagnostics margin 23% to 24% | Sovrenn, an AI summary |
| Max Healthcare chairman | Q2 FY27 | Faster ramp-up in occupancy of newly added beds shows demand is absorbing capacity | Business Standard |
| Apollo management | Q2 FY27 | All three businesses grew in double digits; new-hospital EBITDA loss guided at about Rs 150 crore for FY27 | Compounding AI |
| Narayana management | Q2 FY27 | Consolidated EBITDA up 42%; margins improved sequentially in India and Cayman | Equitybulls |
| Business Standard analysts | October 2025 | Bed additions could squeeze operating margins as new units ramp up | Business Standard |
Cite this table: Agency and management views on hospitals, PositionalCalls, Saturday, 21 November 2026, 2:30 PM IST, as reported; each is a single-source item and none is a stock recommendation.
Do the views agree on margins in the hospital sector outlook 2026?
They agree that revenue is secure and margins are the open question. Business Standard flagged margin pressure from ramp-ups in October 2025, and Q2 supports that for Apollo’s hospital margin and Max’s profit margin, while Fortis’s operating margin improved. This page gives no call and does not repeat any broker’s stock names or price targets.
Where do sources disagree on the hospital sector outlook 2026?
Ten conflicts appear in the data, and each changes how a number reads. The table shows both versions and the one this page uses.
| Item | Version A | Version B | How this page handles it |
|---|---|---|---|
| Apollo Q2 profit | Rs 630 crore, up 32% (Kotak Neo, Multibagg) | Rs 659.50 crore, up 33.5% (Compounding AI) | Uses Rs 630 crore, the figure most sources give |
| Apollo Q2 FY26 base | Revenue base implied by 23% growth: about Rs 6,191 crore, my calculation | Rs 6,477 crore (Sovrenn) or Rs 6,358.20 crore (Kotak Neo FY26 page) | Uses the reported growth; does not recompute it |
| Apollo EBITDA growth | Up 29% (Kotak Neo, Quartr) | Up 26.6% on a base of Rs 941 crore or 19.6% on Rs 995.8 crore, my calculation | Uses the reported 29%; base differs by source |
| Max Q2 profit | Network profit Rs 448 crore, up 10% (PTI) | About Rs 473 crore implied by a 14.7% margin on Rs 3,219 crore, my calculation | Uses Rs 448 crore and labels it network profit |
| Fortis revenue per patient | Called ARPOB in one headline (Multibagg) | Called ARPP in its body; Rs 2.10 lakh per patient (Omnicuris) | Calls it revenue per patient |
| Fortis Q2 FY26 revenue base | Rs 2,331 crore (Multibagg) | Rs 2,354.02 crore (Kotak Neo FY26 page) | Uses the 17.3% reported growth |
| Narayana India margin | 26.8% (Multibagg) | 24.6%, EBITDA Rs 3,548 million (Arthneeti) | Shows both; scope differs |
| Narayana growth | Up 73% consolidated | India up 16.6% to 17% | Uses 16.6% for like-for-like |
| ICRA capex outlay | Rs 32,000 crore planned by FY27 (July 2025) | Rs 40,000 crore over FY26 to FY30 (February 2026) | Treats them as different periods |
| Sector growth rate | 13% to 15% for FY27 (ICRA) | 11% to 12% CAGR (CareEdge) | Different horizon and sample; shows both |
Cite this table: Source conflicts in hospital data, PositionalCalls, Saturday, 21 November 2026, 2:30 PM IST, as recorded from the sources named.
Which conflict matters most for comparing hospital chains?
Most of these are definition gaps: network against consolidated, reported against normalised, and acquired against organic. The two that change the reading are Narayana’s acquisition effect and the Apollo base, and the hospital sector outlook 2026 on this page does not rest on either.
What are the risks to the hospital sector outlook 2026?
Six risks could make the hospital sector outlook 2026 wrong, and two are visible in reported numbers. Red marks risks that already show in data, amber marks measures to watch, and blue marks risks that depend on future events.
The risks feed each other: new beds dilute margins while they fill, and a heavier scheme mix slows price growth just when costs are rising.
Bottom line
The hospital sector outlook 2026 is strong on demand and occupancy and uneven on profit. Revenue grew faster than ICRA’s forecast range, but margins slipped at Apollo and Max and Fortis profit fell, so growth alone does not settle the outlook.
What should you watch next in the hospital sector outlook 2026?
Watch Q3 occupancy, ARPOB growth and the ramp-up of new beds. The table gives each item and the figure to compare it against.
| Item to watch | Why it matters | Compare against |
|---|---|---|
| Q3 FY27 results, January and February 2027 | Tests whether occupancy holds on new beds | Max 77%, Apollo 73%, Fortis 72% |
| Revenue per patient and ARPOB | Tests ICRA’s 6% to 8% view | Apollo up 8%; Fortis up 6.8% |
| New-hospital losses at Apollo | Tests the Rs 150 crore guide for FY27 | H1 loss of Rs 73 crore |
| Fortis margin expansion | Tests the 150 basis point target | Q2 margin 24.2% against 23.9% |
| Narayana UK performance | Tests integration of the overseas business | Q2 UK loss of GBP 2.7 million |
| ICRA’s next quarterly update | Tests the 13% to 15% revenue view | Reported Q2 growth of 17.3% to 23% |
Cite this table: Hospital watch list, PositionalCalls, Saturday, 21 November 2026, 2:30 PM IST, dates as reported; later dates may move.
Order and bed plans say nothing about profit, so use the quarterly results and check which profit line is quoted.
Hospital sector outlook 2026 in Hinglish: short summary
Hospital companies ka revenue tez badh raha hai aur occupancy high hai, lekin profit growth mixed hai. ICRA ko FY27 mein 13% se 15% revenue growth ki ummeed hai. Q2 FY27 mein Max ki occupancy 77%, Apollo ki 73% aur Fortis ki 72% rahi.
Apollo ka profit 32% badha, lekin Fortis ka reported profit 2.5% gira aur Apollo ka hospital margin 60 basis points kam hua. Nayi beds bharne mein time lagta hai, isliye margin par dabav rehta hai. Yeh sirf jaankari hai: koi target, rating ya buy-sell salaah nahi.
What pages sit beside this hospital page?
The company results page and the other sector outlooks give the surrounding layer.
- Sector hub: sector outlook India, the sector pages
- Company results: Apollo Hospitals Q2 results
- Related sector pages: pharma sector outlook 2026 and insurance sector outlook 2026
- Scorecard: Q2 FY27 results scorecard
This page is the sector view. It does not rank companies or give targets. The results page shows the company figures, so use it for that job.
Sources for this hospital page
Every figure comes from the sources below, read on 21 November 2026. I did not open exchange filings, company presentations or the full ICRA reports, so use the links to reach the primary source. ICRA, EY and CareEdge figures come from search excerpts of their reports. KIMS, Medanta and Global Health Q2 FY27 figures were not found and are not covered.
- ICRA: Hospital quarterly update, 30 July 2026
- ICRA: Hospital half-yearly update, December 2025
- ICRA: Indian hospital sector, February 2026
- Tribune: ICRA upgrades hospital outlook
- Business Standard: Battle for beds
- IBEF: CareEdge hospital growth
- Business Today: EY-Parthenon healthcare growth
- Webindia123: Hospital sector new growth cycle
- Business Standard: Max Healthcare Q2 FY27
- Business Standard: Max Healthcare expansion
- Business Standard: Hospital volumes and realisations
- Multibagg: Max Healthcare Q2 FY27
- Multibagg: Max Healthcare margin
- HDFC Sky: Max Healthcare network profit
- Whalesbook: Max Healthcare Q2 FY26
- Kotak Neo: Apollo Hospitals Q2 FY27
- Kotak Neo: Apollo Hospitals Q1 FY27
- Kotak Neo: Apollo Hospitals Q2 FY26
- Quartr: Apollo Hospitals Q2 FY27
- Multibagg: Apollo Healthcare Services margin
- Multibagg: Apollo Q2 FY27 profit
- Compounding AI: Apollo Q2 FY27
- Compounding AI: Apollo earnings call
- Sovrenn: Apollo concall
- Omnicuris: Apollo Q2 results
- Multibagg: Fortis Q2 FY27 revenue
- Multibagg: Fortis Q2 FY27 profit
- Multibagg: Fortis margin bands
- Sovrenn: Fortis concall
- Omnicuris: Fortis Q2 results
- Kotak Neo: Fortis Q2 FY26
- Kotak Neo: Narayana Hrudayalaya Q2 FY27
- JM Financial: Narayana Hrudayalaya Q2 PAT
- Multibagg: Narayana India margins
- Multibagg: Narayana UK loss
- Arthneeti: Narayana Q2 FY27
- Equitybulls: Narayana Q2 FY27
Where a source is a news report on company or industry data, the report is named, not the company. If any figure differs from the primary release, the primary release governs.
PositionalCalls WhatsApp channel
Keep sector updates together
- Quarterly result summaries
- Budget and policy changes
- Links to new sector pages
hospital sector outlook 2026: frequently asked questions
What is the hospital sector outlook 2026 for India?
Demand is strong and capacity is expanding. ICRA keeps a Positive outlook with 13% to 15% revenue growth expected in FY27, and Q2 FY27 occupancy was 77% at Max, 73% at Apollo and 72% at Fortis. Margins and profit growth are more mixed, as bed additions, ramp-up costs and payor mix weigh on some chains.
What does ICRA forecast for hospitals in FY27?
ICRA expects its sample of listed hospital companies to grow revenue 13% to 15% in FY27 and 15% to 17% in FY28, with ARPOB up 6% to 8%. Occupancy is seen near 62% to 64%. In FY26 the sample grew revenue 18% with occupancy of 63.5% and ARPOB up 9.2%.
How did hospital chains perform in Q2 FY27?
Revenue grew at all four chains. Apollo reported Rs 7,615 crore, up 23%, Max Rs 3,219 crore, up 20%, Fortis Rs 2,735 crore, up 17.3%, and Narayana Rs 2,844 crore, up 73% after a UK acquisition. Profit was mixed: Apollo and Narayana rose, Max network profit rose 10%, and Fortis reported profit fell 2.5%.
What is hospital occupancy in India in 2026?
It depends on the sample. ICRA’s sample of 11 listed companies had 63.5% occupancy in FY26 and sees 62% to 64% in FY27. In Q2 FY27 Max reported 77%, Apollo 73% and Fortis 72%, which are 8 to 15 points above ICRA’s range on my calculation, because the chains are larger metro operators.
Did Q2 FY27 results meet the ICRA forecast in the hospital sector outlook 2026?
Broadly yes on revenue. ICRA forecast 13% to 15% growth for FY27, and Apollo, Max and Fortis grew 17.3% to 23% in Q2, above that range. Narayana’s India business grew 16.6%. Profit lagged revenue at several chains, which the ICRA revenue forecast does not cover, so margins are the open test.
Why do sources disagree on hospital sector numbers?
They use different bases and definitions. Apollo’s Q2 profit appears as Rs 630 crore and Rs 659.50 crore, Narayana’s India margin as 26.8% and 24.6%, and ICRA’s capex outlay as Rs 32,000 crore and Rs 40,000 crore. The conflicts table records ten gaps and how this page handles each.
What are the main risks in the hospital sector outlook 2026?
Six risks stand out: margin dilution from new beds, a heavier government-scheme mix, slower ARPOB growth, large capacity additions, integration and overseas losses, and regulatory pricing. Apollo’s hospital margin fell 60 basis points, Max’s profit margin fell to 14.7% from 15.7%, and Fortis profit fell despite higher revenue.
Is the hospital sector outlook 2026 a call to buy hospital stocks?
No. This page gives no target, rating, entry or exit level and no buy or sell call, and it leaves out brokerage stock preferences. It reports sector, company and agency figures with sources and dates, and it shows which numbers conflict. Treat it as analysis only, and check each company’s filing before acting.
How is the hospital sector different from the pharma sector?
Hospitals provide inpatient and outpatient care and earn from beds, occupancy and revenue per bed, while pharma companies make and sell medicines. They share demand drivers such as insurance and ageing, and Apollo also runs a pharmacy arm. This page stays on hospital providers, with the drug makers on the pharma sector page.
What should I watch next in the hospital sector outlook 2026?
Watch Q3 FY27 occupancy, ARPOB growth, the ramp-up of new beds and any change in pricing rules. Compare Apollo’s 73% occupancy, Fortis’s 72%, Max’s 77% and ICRA’s forecast of 6% to 8% ARPOB growth. New capacity will test whether occupancy holds as ICRA’s sample range suggests.

Shubham Chaudhary is the founder of PositionalCalls, an independent Indian stock market research website. He writes company fundamentals, quarterly results analysis, IPO analysis and sector research for NSE and BSE listed companies, with a focus on banking stocks, insurance and long-term value investing. Every article is built from primary sources such as RBI, SEBI, NSE and BSE filings and company annual reports, and states its risks plainly in simple language for retail investors.
Coverage areas Our research standards- Numbers checked against NSE, BSE and SEBI filings
- Risks and limits stated in every article
- No paid promotions or broker tie-ups
- Articles updated when new filings arrive