
Earnings · FMCG · Britannia Industries · Q2 FY27
Britannia grew revenue 15.6% on 13% more volume, but the EBITDA margin slipped to about 18.2% and profit rose 10.8%. Here are the profit bases, the cost lines, the preview marks graded, the price move on 6 November and the one brokerage view as reported.
Quick answer
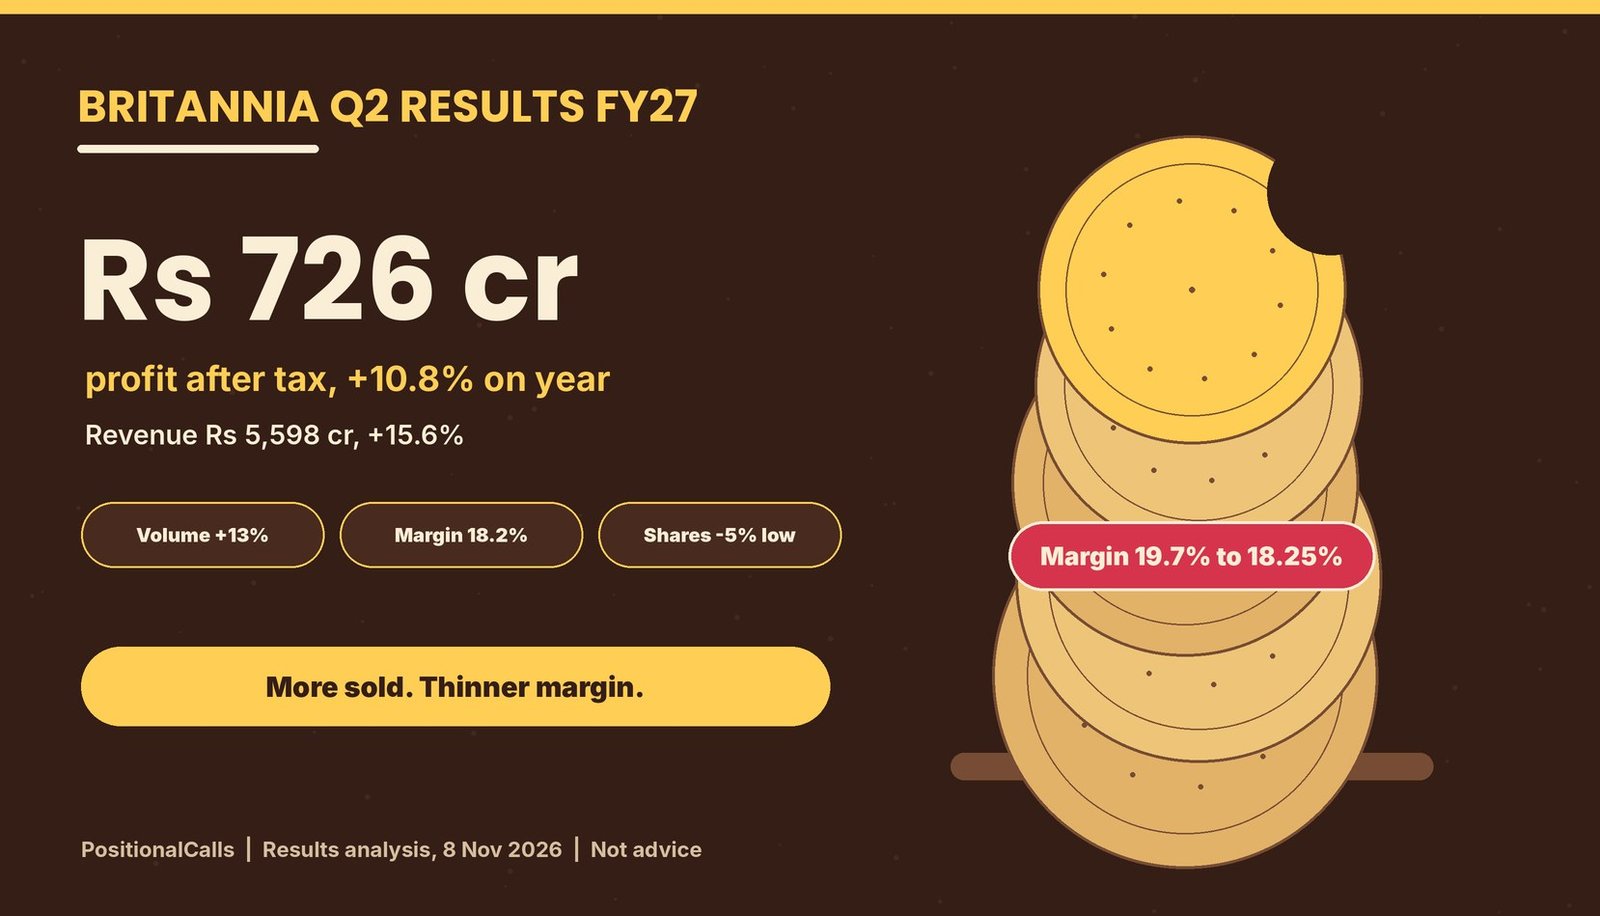
Britannia Q2 results FY27, announced on 5 November 2026: consolidated revenue was Rs 5,598 crore, up 15.6%, and profit after tax Rs 725.99 crore, up 10.8%, on volume growth of 13%. EBITDA margin was about 18.2% against 19.7%. The shares fell as much as 5% on 6 November, per Business Today.
Latest update (Sunday, 8 November 2026, 5:45 PM IST): Britannia announced the Britannia Q2 results FY27 on Thursday, 5 November 2026; Business Standard’s report is stamped 11:48 PM IST. On Friday, 6 November the shares fell as much as 5% to Rs 4,749.30 against a Rs 5,000 close (Business Today, 11:43 AM), and Prabhudas Lilladher kept a Buy with a Rs 6,046 target, as reported by Whalesbook at 3:35 PM. I did not find an official 6 November close, a dividend notice or a second brokerage note. The next regular session is Monday, 9 November.
Key takeaways
- Profit: Profit after tax Rs 725.99 crore (+10.8%); owners’ share Rs 721 crore (+10.2%); the Rs 5 crore gap is minority interest (my calculation).
- Revenue and volume: Revenue from operations Rs 5,597.79 crore (+15.6%, +12.0% on Q1); volume growth 13%, above the preview’s 10% estimate.
- Margin: EBITDA about Rs 1,021 crore (+6.9%) at 18.25%, down from 19.7%; the preview’s 19% margin mark was missed.
- Against the preview: Revenue beat the preview’s single Rs 5,432 crore estimate by 3.1%; EBITDA was 1.1% below Rs 1,033 crore; profit was 0.1% below Rs 727 crore (my calculation).
- Costs: Palm oil +17%, milk +16%, laminates +18% and industrial fuel +45%; price rises of about 3.5% offset roughly half (Prabhudas Lilladher).
- Price: Shares closed at Rs 5,000 on 5 November (+1.70%) and fell as much as 5% to Rs 4,749.30 on 6 November; I found no official 6 November close.
Preview post, 1 November 2026Britannia Q2 results preview: date check, Rs 655 crore base and the margin risk
- The 5 November date and the Rs 655 crore profit base
- One estimate: Rs 5,432 crore revenue, Rs 1,033 crore EBITDA, Rs 727 crore profit
- The sensitivity table, seasonality check and a results-day decoder
Read the full preview post for the checklist made before the numbers arrived.
This results analysis, 8 November 2026What the numbers showed
- Revenue, volume, EBITDA, profit and the definitions that differ
- The cost lines behind the 18.25% margin and how they tie
- The price fall on 6 November and the one brokerage note found
A table further down grades each preview mark against the actual figure.
How to read this page: it is results analysis, not a recommendation. The one brokerage view is quoted as reported with source and date; it is not mine. PositionalCalls.com is not a SEBI-registered research analyst or investment adviser.
In plain words: Britannia sold much more but kept a smaller share of each rupee. Revenue rose 15.6% to Rs 5,598 crore on 13% more volume, yet profit grew only 10.8% to Rs 726 crore because wheat-based and dairy inputs, palm oil, packaging and fuel cost more. The EBITDA margin slipped to about 18.2% from 19.7%, so the preview’s margin risk played out even though profit landed near its estimate.
Data note: as of Sunday, 8 November 2026, 5:45 PM IST. Figures come from press and data-platform summaries of the filing (Business Standard, Business Today, Equentis, Genvest, Lapaas, Sahi and India IPO); I did not open the BSE or NSE filing, the press release or the investor presentation. Two other pages, a Zee Business results story and a Zee Business price story, could not be opened, so I use only their headlines as seen in search. Figures are consolidated, and derived numbers are marked “my calculation”.
Britannia Q2 results FY27: what Britannia reported on 5 November
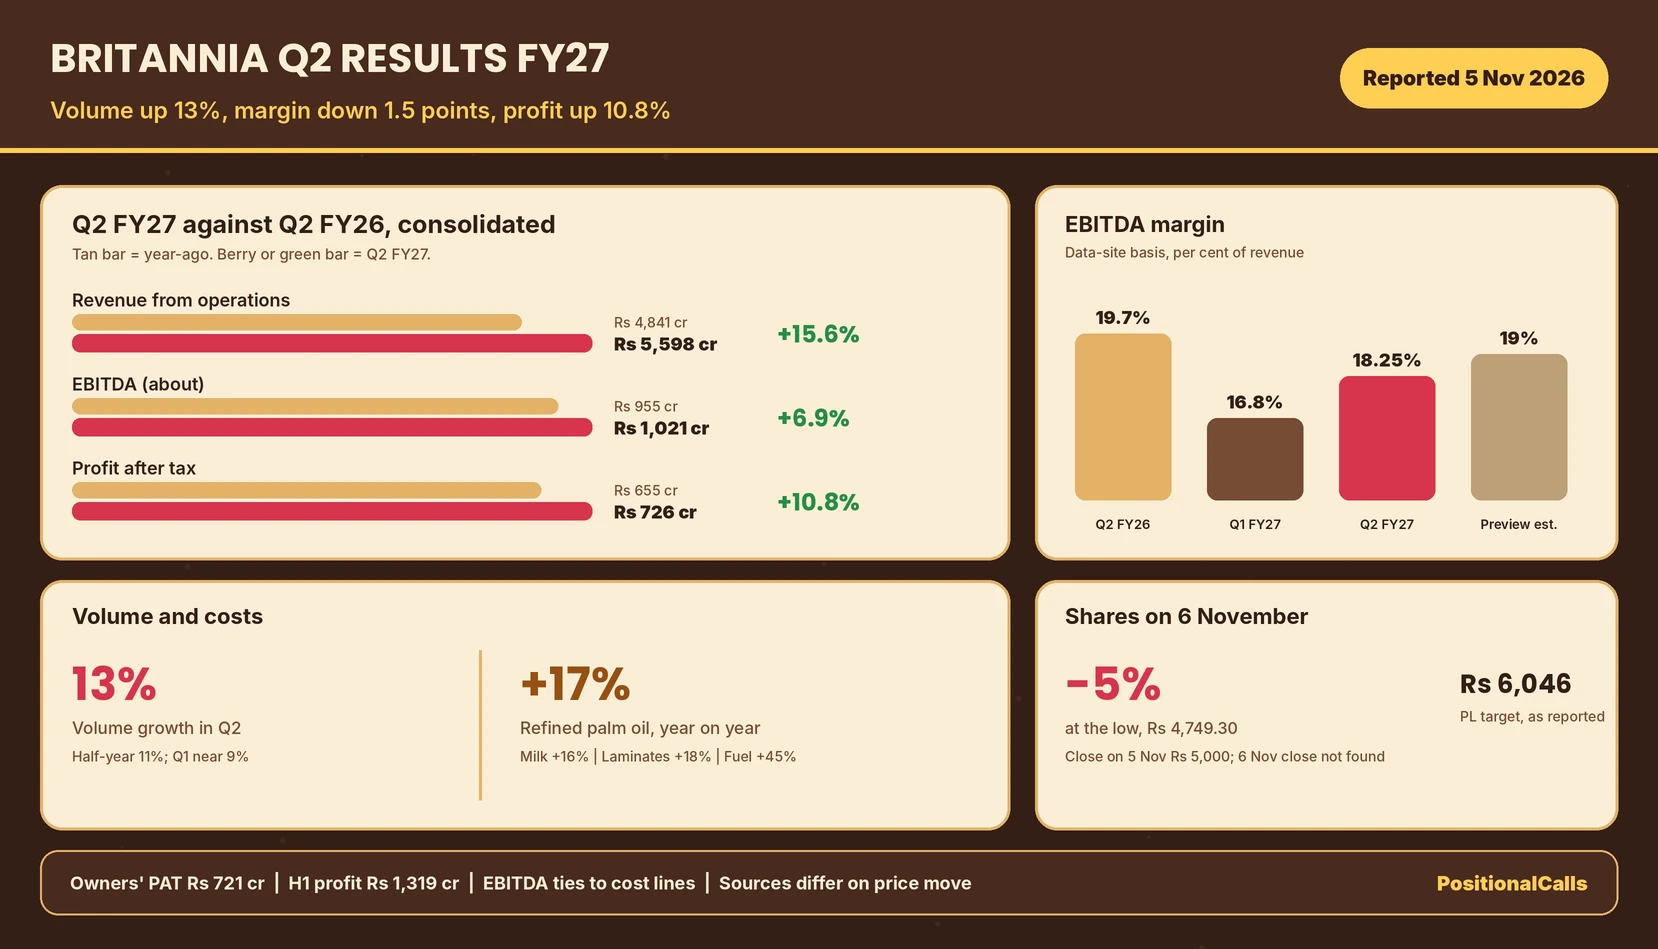
The Britannia Q2 results FY27 show consolidated revenue from operations of Rs 5,597.79 crore (+15.6%), profit after tax of Rs 725.99 crore (+10.8%), EBITDA of about Rs 1,021 crore (+6.9%) at an 18.25% margin against 19.7%, and volume growth of 13%.
| Measure (consolidated) | Q2 FY27 | Q2 FY26 base | Q1 FY27 | Change on year |
|---|---|---|---|---|
| Revenue from operations | Rs 5,597.79 crore | Rs 4,840.63 crore | Rs 5,000 crore | +15.6% (+12.0% on Q1) |
| Revenue from product sales (net sales) | Rs 5,541.57 crore | About Rs 4,752 crore | Rs 4,964 crore | +16.6% |
| EBITDA (data-site basis) | About Rs 1,021 crore | About Rs 955 crore | About Rs 840 crore | +6.9% to +7.0% |
| EBITDA margin | 18.25% | 19.7% | 16.8% | -1.5 points |
| Operating profit (company basis) | Rs 943 crore | About Rs 870 crore | Rs 761 crore | +8.5% (reported) |
| Profit before tax | Rs 977 crore | Not found | Not found | +10.6% |
| Profit after tax (total) | Rs 725.99 crore | Rs 655.06 crore | Rs 593.38 crore | +10.8% (+22.3% on Q1) |
| Profit after tax (owners) | Rs 721 crore | Rs 654.47 crore | Rs 591.4 crore | +10.2% |
Cite this table: PositionalCalls, “Britannia Q2 FY27 Results Table, as of 8 November 2026”.
The Britannia Q2 results FY27 are a clean growth quarter with a margin problem. Revenue and volume ran ahead of the single estimate in the preview post, while EBITDA margin missed its 19% mark. The half-year of the Britannia Q2 results FY27 ties on several bases: Q1 revenue of Rs 5,000 crore plus Q2 of Rs 5,597.79 crore is Rs 10,597.79 crore, against Rs 10,597.76 crore in Lapaas; Q1 net sales of Rs 4,964 crore plus Q2 of Rs 5,542 crore is Rs 10,506 crore, the figure Business Today gives; and Q1 profit of Rs 593.38 crore plus Q2 of Rs 725.99 crore is Rs 1,319.37 crore, up 12.3% on last year’s Rs 1,175.19 crore (my calculation), which matches India IPO’s Rs 1,319 crore. The owners’ basis gives about Rs 1,312 crore, up about 12%, in Lapaas and Business Today. Both are right on their own basis; the rest of this page keeps them apart.
Britannia Q2 FY27 profit: Rs 725.99 crore, or Rs 721 crore to owners
Total consolidated profit after tax was Rs 725.99 crore, up 10.8% from Rs 655.06 crore; the share attributable to owners was Rs 721 crore, up 10.2%, and the Rs 5 crore difference is minority interest, so the headlines of 10.1%, 10.2%, 10.8% and 11% are the same quarter on different bases.
| Basis | Q2 FY27 | Q2 FY26 | Change | Source |
|---|---|---|---|---|
| Total profit after tax (used here) | Rs 725.99 crore | Rs 655.06 crore | +10.8% | Business Standard, Genvest (press release) |
| Owners’ share | Rs 721 crore | Rs 654.47 crore | +10.2% (my calculation) | Genvest, Business Today |
| Owners’ share against total base | Rs 721 crore | Rs 655 crore | +10.1% | India IPO |
| Rounded headline | Rs 721 crore | Not shown | “+11%” | Zee Business headline, page not opened |
| Earnings per share | Rs 29.93 | Rs 27.17 | +10.2% | Genvest |
| Profit before tax | Rs 977 crore | Not found | +10.6% | Genvest, Business Today |
Cite this table: PositionalCalls, “Britannia Q2 FY27 Profit Bases, as of 8 November 2026”.
The Britannia Q2 FY27 profit has a simple structure in the Britannia Q2 results FY27. Profit before tax of Rs 977 crore taxed at 25.7% gives Rs 725.9 crore, which is the Rs 725.99 crore total; the owners’ Rs 721 crore sits Rs 4.99 crore below it (my calculation). Earnings per share confirm the owners’ basis: both years imply 24.09 crore shares, so the 10.2% rise is a real per-share gain (my calculation). Profit did well against the margin, because conversion of EBITDA into profit rose to 71.05% from 68.6% a year ago (my calculation). Other income of about Rs 74 crore, up 41.1%, supplied roughly Rs 22 crore more than a year ago (Genvest; my arithmetic), which helps explain why profit stayed near the preview’s Rs 727 crore estimate while EBITDA did not.
Genvest reports no exceptional items. Quarter on quarter, profit rose 22.3%, close to the 22% the CEO cited.
Britannia EBITDA margin 18.2%: the lines behind the 147 basis point fall
EBITDA was about Rs 1,021 crore, up 6.9%, at an 18.25% margin against 19.7% a year ago, a fall of about 147 basis points, because material costs rose 19.7% against revenue growth of 15.6% while employee and other costs grew 11% and 13%.
| Line (Rs crore) | Q2 FY27 | Growth | Check (my calculation) |
|---|---|---|---|
| Revenue from operations | 5,597.79 | +15.6% | Starting point |
| Material costs | 3,378 | +19.7% | 61.0% of net sales against about 59.4% a year ago |
| Employee costs | 201 | +11.0% | -4.1% on Q1 FY27 |
| Other expenses | 997 | +13.0% | -2.8% on Q1 FY27 |
| Revenue less the three lines | 1,021.79 | +7.0% | Matches EBITDA of Rs 1,021 to 1,022 crore |
| Left in total expenses | 114.47 | Not split | Depreciation, finance costs; 4,690.47 less 4,576 |
| Operating profit (company basis) | 943 | +8.5% | 1,021.79 less 943 is 78.79, close to the 79 gap in Q1 |
Cite this table: PositionalCalls, “Britannia EBITDA Margin Q2 FY27 Table, as of 8 November 2026”.
In the Britannia Q2 results FY27, the EBITDA and operating profit figures are two views of one quarter, as the preview post warned. Revenue less material, employee and other expenses is Rs 1,021.79 crore; the company’s own operating profit of Rs 943 crore is Rs 78.79 crore lower, almost the Rs 79 crore gap in Q1 FY27 (my calculation). On the operating-profit basis the margin was 17.0% of net sales against 18.3% a year ago.
Britannia EBITDA margin 18.2% is a better quarter than Q1’s 16.8%, a gain of about 145 basis points, but it is below the 19.7% base and the 19% estimate. The preview’s warning lines, a margin below 18% and volume below 8%, did not trigger. Material costs are the swing: they took 61.0% of net sales against about 59.4% a year ago (my calculation); that is not the company’s gross margin, which I did not find.
Britannia volume growth Q2 FY27: 13%, with costs and pricing
Volume growth was 13% in Q2 FY27 and 11% for the half-year, led by biscuits and by adjacent bakery above 20%, dairy in double digits and international in the mid-teens, while palm oil, milk, laminates and industrial fuel cost 16% to 45% more.
| Driver | Reported figure | Source and note |
|---|---|---|
| Volume growth, Q2 | 13% | Business Standard, Equentis, Prabhudas Lilladher; Q1 was near 9% |
| Volume growth, half-year | 11% | India IPO |
| Adjacent bakery (cakes, rusk, wafers, croissants) | More than 20% | Business Today, Lapaas |
| Dairy (cheese, ghee, milk drinks) | Double-digit | Business Today, Lapaas |
| International | Mid-teens, a rebound | Business Today, Lapaas |
| Refined palm oil, milk, laminates | +17%, +16%, +18% | Equentis, Lapaas |
| Industrial fuel, sugar, flour | +45%, +6%, -4% | Equentis, Lapaas |
| Price increases | About 3.5%, offsetting about half of cost inflation | Prabhudas Lilladher via Whalesbook |
Cite this table: PositionalCalls, “Britannia Volume Growth Q2 FY27 Table, as of 8 November 2026”.
Britannia volume growth Q2 FY27 of 13% is the strongest line in the Britannia Q2 results FY27 and cleared the preview’s “about 10%” estimate. Revenue growth of 15.6% is volume plus price and mix, and the pricing was lower than the cost rise: a 3.5% price increase against 13% volume leaves most of revenue growth coming from volume, which is a healthy sign for demand but a thin cushion for margin (my reading). The preview also noted that last year’s revenue base was trimmed about 2% to 2.5% by the GST rate cut; that makes the 15.6% growth look better than the trend, and I cannot split the effect from the reports.
CEO and MD Rakshit Hargave said the company “sustained strong top-line momentum”, with double-digit volume and value growth across channels and key states. Business Today’s general-trade multiples are worded unclearly, so I do not use them.
PositionalCalls WhatsApp channel
Britannia and FMCG results on WhatsApp
- Profit basis and one-offs stated for each result
- Conflicts between sources shown, not hidden
- The next company on the results calendar
Britannia Q2 results FY27 against the preview marks
Against the preview’s marks, revenue and volume read stronger, profit read in line, and EBITDA and margin read weaker, so the margin risk in the preview’s title is what played out.
| Preview mark | What the preview said | What was reported | Reading |
|---|---|---|---|
| Board date | 5 November, from a preview and a calendar | Results announced on 5 November | Confirmed |
| Revenue | Rs 5,432 crore (+12.2%), one estimate | Rs 5,597.79 crore (+15.6%) | Stronger, +3.1% on the estimate |
| Volume growth | About 10%; below 8% would change the view | 13% | Stronger |
| EBITDA | Rs 1,033 crore, one estimate | About Rs 1,021 crore | Weaker, -1.1%; +0.3% on a Rs 1,019 crore poll |
| EBITDA margin | 19.0%; below 18% would change the view | 18.25% | Weaker than 19%; above the 18% line |
| Profit after tax | Rs 727 crore, up 11%; Rs 655 crore base | Rs 725.99 crore (+10.8%) | In line, -0.1% |
| Gross margin | Base 41.7% (Q2 FY26), 41.5% (Q1) | Not found; material share up to 61.0% | Likely lower; not like-for-like |
| Non-biscuit growth | Double digits held in Q1 | Bakery over 20%, dairy double-digit | Held |
| Two EBITDA figures | Rs 761 crore against Rs 840 crore in Q1 | Rs 943 crore against Rs 1,021 crore in Q2 | Gap of about Rs 79 crore repeated |
| Dividend | None found | None found in the reports | Check the filing |
Cite this table: PositionalCalls, “Britannia Q2 FY27 Preview-to-Result Table, as of 8 November 2026”.
| Step, Q1 to Q2 | FY26 actual | FY27 estimate (preview) | FY27 actual |
|---|---|---|---|
| Revenue | 4,622 to 4,841 (+4.7%) | 5,000 to 5,432 (+8.6%) | 5,000 to 5,597.79 (+12.0%) |
| EBITDA | 757 to 955 (+26.2%) | 840 to 1,033 (+23.0%) | About 840 to 1,021.79 (+21.6%) |
| Profit after tax | 520.13 to 655.06 (+25.9%) | 593.38 to 727 (+22.5%) | 593.38 to 725.99 (+22.3%) |
| EBITDA margin gain | About 330 bps | About 220 bps | About 145 bps |
Cite this table: PositionalCalls, “Britannia Q2 FY27 Seasonality Check, as of 8 November 2026”.
The seasonal step explains the quarter. Revenue climbed 12.0% from Q1 against the estimate’s 8.6%, while EBITDA climbed 21.6% against 23.0%, so the extra sales did not turn into extra EBITDA. In the preview’s sensitivity table, scenario D assumed 15% revenue growth and a 19% margin for a profit of Rs 736 crore; actual revenue growth was 15.6%, the margin was 18.25% and profit was Rs 725.99 crore, which sits between scenarios B (Rs 718 crore) and D. At a 19% margin on the actual revenue, EBITDA would have been about Rs 1,064 crore and profit about Rs 740 crore at the preview’s 69.6% conversion (my calculation); the margin shortfall cost about Rs 42 crore of EBITDA, and higher other income and conversion closed most of the profit gap.
Zee Business’ headline said estimates were met, while India IPO says the beat rests on EBITDA alone, against a poll of Rs 1,019 crore and a margin forecast of 18.7%. These are different estimate sets, so “met”, “beat” and “missed” each depend on which one you pick; I show the preview’s estimate and the poll side by side and do not pick a winner.
Britannia closed at Rs 5,000 on 5 November, up 1.70%, before the results; on 6 November the shares fell as much as 5% to Rs 4,749.30, and Prabhudas Lilladher maintained a Buy with a Rs 6,046 target, per Business Today and Whalesbook; I found no official close.
| Item | Level or view | Source and note |
|---|---|---|
| 5 Nov close | Rs 5,000, +1.70% | Business Standard (BSE); results came after this |
| Previous close (derived) | About Rs 4,916 | Not reported; 5,000 over 1.017 (my calculation) |
| 6 Nov low | Rs 4,749.30, -5.0% | Business Today, 11:43 AM; 4,749.30 over 5,000 (my calculation) |
| 6 Nov, other readings | “Fell as much as 3%” to Rs 4,828 (a photo caption); a live ticker of Rs 4,754 shown as +4.54% | Business Today; both conflict with the -5% text, and I do not use them |
| 6 Nov, summary | “Fell about 5%”; level not given | Equentis, Zee Business headline |
| Official 6 Nov close | Not found | No source gave it |
| Prabhudas Lilladher | Buy maintained, target Rs 6,046 | Whalesbook, 6 Nov, 3:35 PM; target adjusted, prior level not given; single source |
| Basis of that note | 15.4% EPS CAGR to FY29; about 32.6 times forward earnings | Whalesbook; the note cites 13% volume and 18.3% margin |
Cite this table: PositionalCalls, “Britannia Share Price After Q2 Results Table, as of 8 November 2026”.
After the Britannia Q2 results FY27, the Britannia share price after Q2 results fell on the next session, and the sources agree on direction but not on size. Equentis said the primary disappointment was profitability, with expenses growing faster than revenue and EBITDA and profit growing more slowly than sales; that matches the margin figures above. Prabhudas Lilladher, as reported, kept its Buy and said the volume run-rate and the roughly 32.6 times forward valuation gave a buffer, while its 18.3% margin figure differs by 0.05 points from the 18.25% elsewhere, a rounding difference. I found no second brokerage note, so I show no range of targets. The brokerage view is quoted only so you can read it; it is not mine and is not a recommendation.
The price reaction was a 5% dip after a quarter of 13% volume growth, which shows that investors weighed the margin more than the volume (my reading, not stated in the reports). For the Sunday session and how the next regular session will be read, see the Muhurat trading 2026 guide.
Management commentary, Q3 watch-list and dividend
Management pointed to broad-based double-digit volume and value growth, and the reports show no explicit margin guidance for Q3; the lines to watch are material costs, pricing and the pace of bakery and dairy growth.
- Demand: volume growth of 13% in Q2 and 11% in the half-year, with bakery, dairy and international all growing (Business Today, Lapaas, India IPO).
- Costs: palm oil, milk, laminates and industrial fuel all rose by double digits on the year; flour fell 4% (Equentis, Lapaas).
- Pricing: price increases of about 3.5% offset roughly half of cost inflation (Prabhudas Lilladher via Whalesbook), so a further increase or a cost easing would be the margin lever.
- Overheads: employee cost fell 4.1% and other expenses fell 2.8% on Q1, which helped the sequential margin gain (Genvest; my calculation of the lines).
- Dividend: none of the reports I opened mentions a dividend; confirm on the BSE or NSE announcement page, and read the dividend tax in India guide if one is declared.
The commentary supports the volume story in the Britannia Q2 results FY27 but gives no margin guidance in the reports I read. For how other consumer companies reported the same season, see the Marico Q2 results FY27, ITC Q2 results FY27, Dabur Q2 results FY27 and HUL Q2 results FY27. The businesses differ, so only the method carries over. For tax on any dividend or share gains, see the capital gains tax on shares guide.
What ties and what does not in the Britannia Q2 results FY27
12 checks tie and 4 do not: the gap between total income less expenses and profit before tax, the price move on 6 November, the revenue label and the estimate comparison.
Because of these gaps, any figure you quote from the Britannia Q2 results FY27 should carry its basis and source. The BSE and NSE filing and the investor presentation settle most of them and are free to read. Treat any message promising a sure-shot Britannia call as unreliable, and never share an OTP.
Risks to read with the Britannia Q2 results FY27
Analyst’s note on the Britannia Q2 results FY27
The Britannia Q2 results FY27 show volume and revenue ahead of the preview, profit in line and margin behind, which is the split the preview’s title warned about.
- What stands out: revenue +15.6% and volume +13%, yet EBITDA only +6.9% and margin down about 147 basis points.
- Easy to miss: profit hit the preview’s estimate because other income and a higher conversion rate offset the margin gap, not because margin held.
- What would change the view: a filing note that restates EBITDA, splits the Rs 3.83 crore gap or gives a gross margin below the base.
- Caution: one quarter does not fix a long-term value, and only one brokerage view was found.
- Reader action: read material costs and pricing before the headline profit, and match each profit headline to its basis.
Bottom line
The Britannia Q2 results FY27 show profit after tax of Rs 725.99 crore (+10.8%) on revenue of Rs 5,597.79 crore (+15.6%) and volume growth of 13%, with EBITDA margin down to about 18.25% from 19.7%. Revenue and volume beat the preview, profit landed in line and margin fell short, and the shares fell as much as 5% on 6 November. Only one brokerage view was found. Read the cost lines and the filing notes before acting, and speak to a registered adviser.
Next read: the preview post for the marks set before the results.
Part of the Earnings series.
PositionalCalls WhatsApp channel
Never miss a results update
- Same-day decoders with the numbers sourced
- Corrections posted openly when a number changes
- Plain-language risk notes
Britannia Q2 results FY27: frequently asked questions
What are the Britannia Q2 results FY27?
Britannia reported consolidated revenue from operations of Rs 5,597.79 crore (+15.6%) and profit after tax of Rs 725.99 crore (+10.8%) for the quarter ended 30 September 2026, announced on 5 November 2026, with volume growth of 13%.
Is Britannia’s Q2 FY27 profit Rs 726 crore or Rs 721 crore?
Both are right on their own basis. Rs 725.99 crore is total profit after tax; Rs 721 crore is the share attributable to owners, Rs 4.99 crore lower, which is minority interest (my calculation). Quote the basis with the figure.
What were Britannia’s EBITDA and margin in Q2 FY27?
EBITDA was about Rs 1,021 to 1,022 crore, up about 7%, at a margin of 18.25%, against 19.7% a year ago. The company’s operating profit was Rs 943 crore, a different measure.
Did Britannia beat estimates in Q2 FY27?
It depends on the estimate. Revenue was 3.1% above the preview’s single Rs 5,432 crore estimate, EBITDA was 1.1% below Rs 1,033 crore and profit 0.1% below Rs 727 crore (my calculation). Against a Rs 1,019 crore poll, EBITDA was slightly above.
Equentis said profitability was the main disappointment, with expenses growing faster than revenue and a margin of 18.2% against 19.7%. These are reported views, not mine.
Business Today reports a fall of as much as 5% to Rs 4,749.30 against a Rs 5,000 close, though a photo caption says 3%. I did not find the official close.
What was Britannia’s volume growth in Q2 FY27?
Volume growth was 13% in the quarter and 11% in the half-year, against about 9% in Q1. Bakery grew above 20%, dairy in double digits and international in the mid-teens.
What did brokerages say about Britannia after Q2 FY27?
The only note I found is Prabhudas Lilladher’s Buy with a Rs 6,046 target, reported by Whalesbook on 6 November; the prior target was not given. This is a reported view, not mine, and a single source.
Did Britannia declare a dividend with its Q2 FY27 results?
None of the reports I opened mentions a dividend. Confirm on the BSE or NSE announcement page, because a dividend would be stated in the board outcome.
Does this page give a Britannia buy or sell call?
No. This is research and education, not advice. PositionalCalls.com is not a SEBI-registered research analyst or investment adviser. Use the numbers to frame questions and speak to a registered adviser before investing.
Sources
- Business Standard, 5 November 2026, 11:48 PM (revenue, profit, expenses, 5 November close, volume, CEO comment)
- Genvest (PBT, tax, other income, cost lines, half-year, EPS)
- Lapaas Voice, 6 November 2026 (EBITDA, margin, half-year, input costs, categories)
- Equentis, 6 November 2026 (EBITDA, margin, what disappointed, 5% fall)
- Business Today, 6 November 2026, 11:43 AM (operating profit, price low, categories, half-year)
- Sahi (EBITDA Rs 1,022 crore, margin 18.25%)
- India IPO (EBITDA against a Rs 1,019 crore poll, margin forecast 18.7%, half-year)
- Whalesbook, 6 November 2026, 3:35 PM (Prabhudas Lilladher note)
- Zee Business, results and share-price stories (6 November 2026): headlines seen in search only; the pages could not be opened.
- Zee Business Q2 preview (30 October 2026) and company results coverage, as cited in the preview post.
- BSE and NSE announcement pages and the Britannia investor page: where the filing is published (I did not open them).
Disclosure: PositionalCalls.com is not a SEBI-registered research analyst or investment adviser. Investments in securities markets are subject to market risks. Read all related documents carefully before investing. Returns are never guaranteed. PositionalCalls is an independent Indian stock market research and education site founded by Shubham Chaudhary. This page is results analysis and not a recommendation, target or investment advice. How I researched this: I compared eight press and data-platform reports of the filing, rebuilt EBITDA from the cost lines, tied profit, tax, share count and half-year totals, recomputed every derived number, and listed the conflicts openly. I did not open the filing.

Shubham Chaudhary is the founder of PositionalCalls, an independent Indian stock market research website. He writes company fundamentals, quarterly results analysis, IPO analysis and sector research for NSE and BSE listed companies, with a focus on banking stocks, insurance and long-term value investing. Every article is built from primary sources such as RBI, SEBI, NSE and BSE filings and company annual reports, and states its risks plainly in simple language for retail investors.
Coverage areas Our research standards- Numbers checked against NSE, BSE and SEBI filings
- Risks and limits stated in every article
- No paid promotions or broker tie-ups
- Articles updated when new filings arrive