
Earnings · Power · Tata Power · Q2 FY27 preview
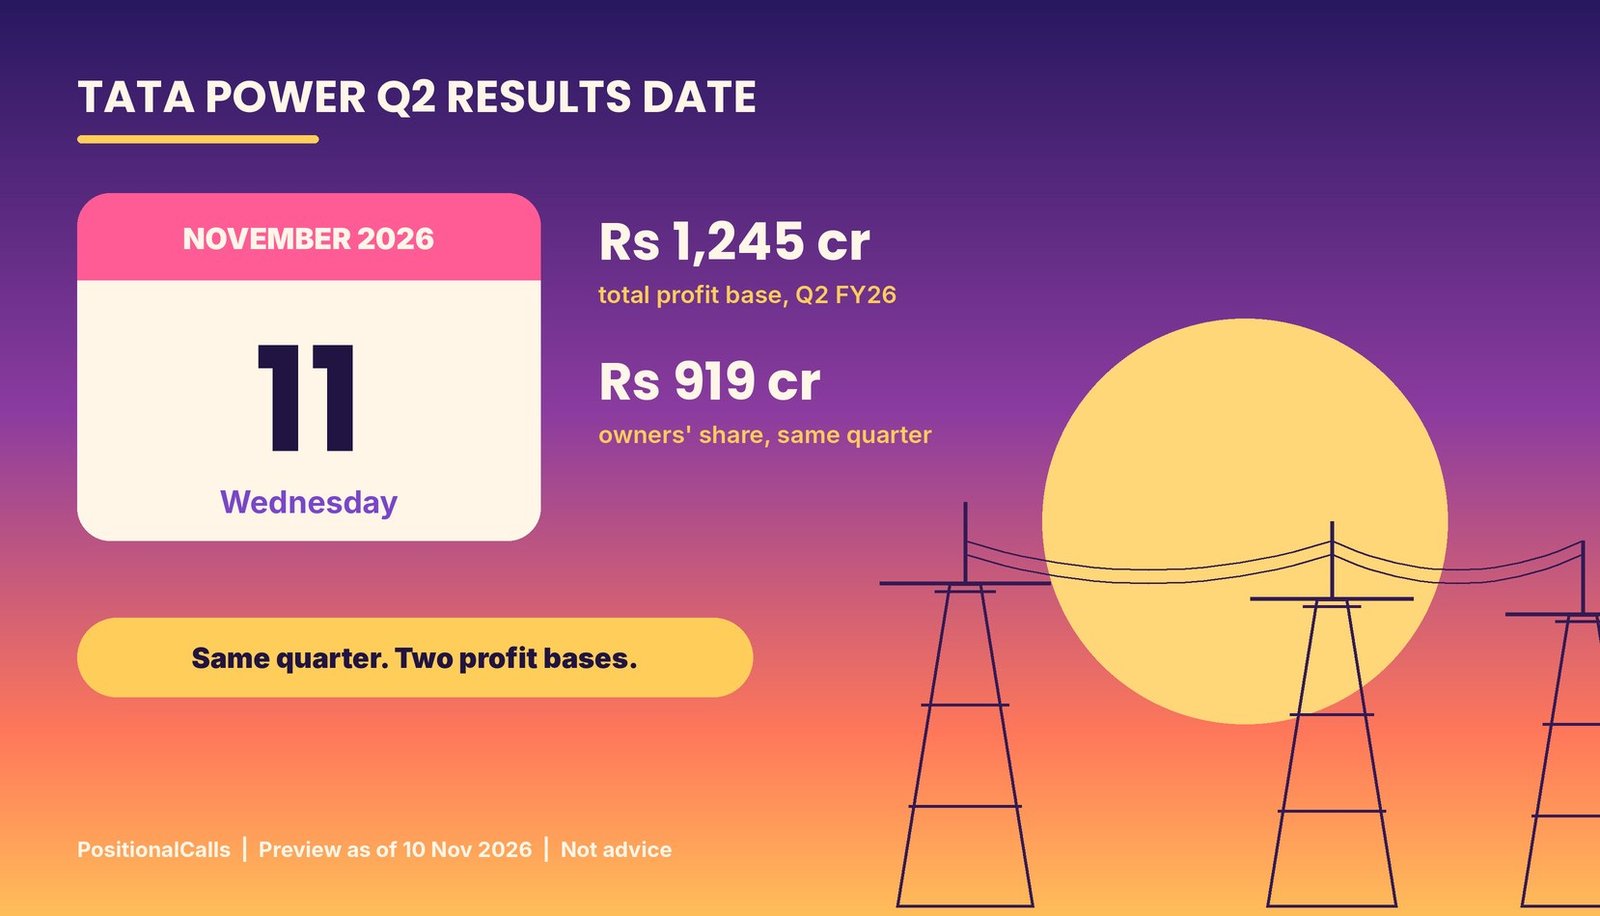
The Tata Power Q2 results date is Wednesday, 11 November 2026, when the board meets for the September-quarter results. The same quarter last year shows two profit numbers and two EBITDA figures. This Tata Power Q2 FY27 preview gives the date, both bases, the segment drivers and the lines to read first.
Quick answer
The Tata Power Q2 results date is Wednesday, 11 November 2026, when the board meets for the quarter and half-year ended 30 September 2026; the time is not announced. The profit base from Q2 FY26 is Rs 1,245 crore in total or Rs 919 crore to owners, as of 10 November 2026.
Latest update (Tuesday, 10 November 2026, 11:00 AM IST): Upstox and Kotak Neo, citing the company’s exchange filing of 7 October 2026, put the Tata Power Q2 results date at Wednesday, 11 November 2026, and a weekly list from Upstox on 8 November repeats it. I could not open the BSE letter itself. The only Q2 FY27 estimates I found are a JM Financial preview (Rs 1,305 crore profit, via Business Today, 5 October 2026) and a Zee Business headline (Rs 1,263 crore); I found no interim dividend notice and no price after 8 October.
Key takeaways
- Date: The Tata Power Q2 results date is Wednesday, 11 November 2026, a board meeting for the quarter and half-year ended 30 September 2026; the time is not announced and the last two results came after market hours.
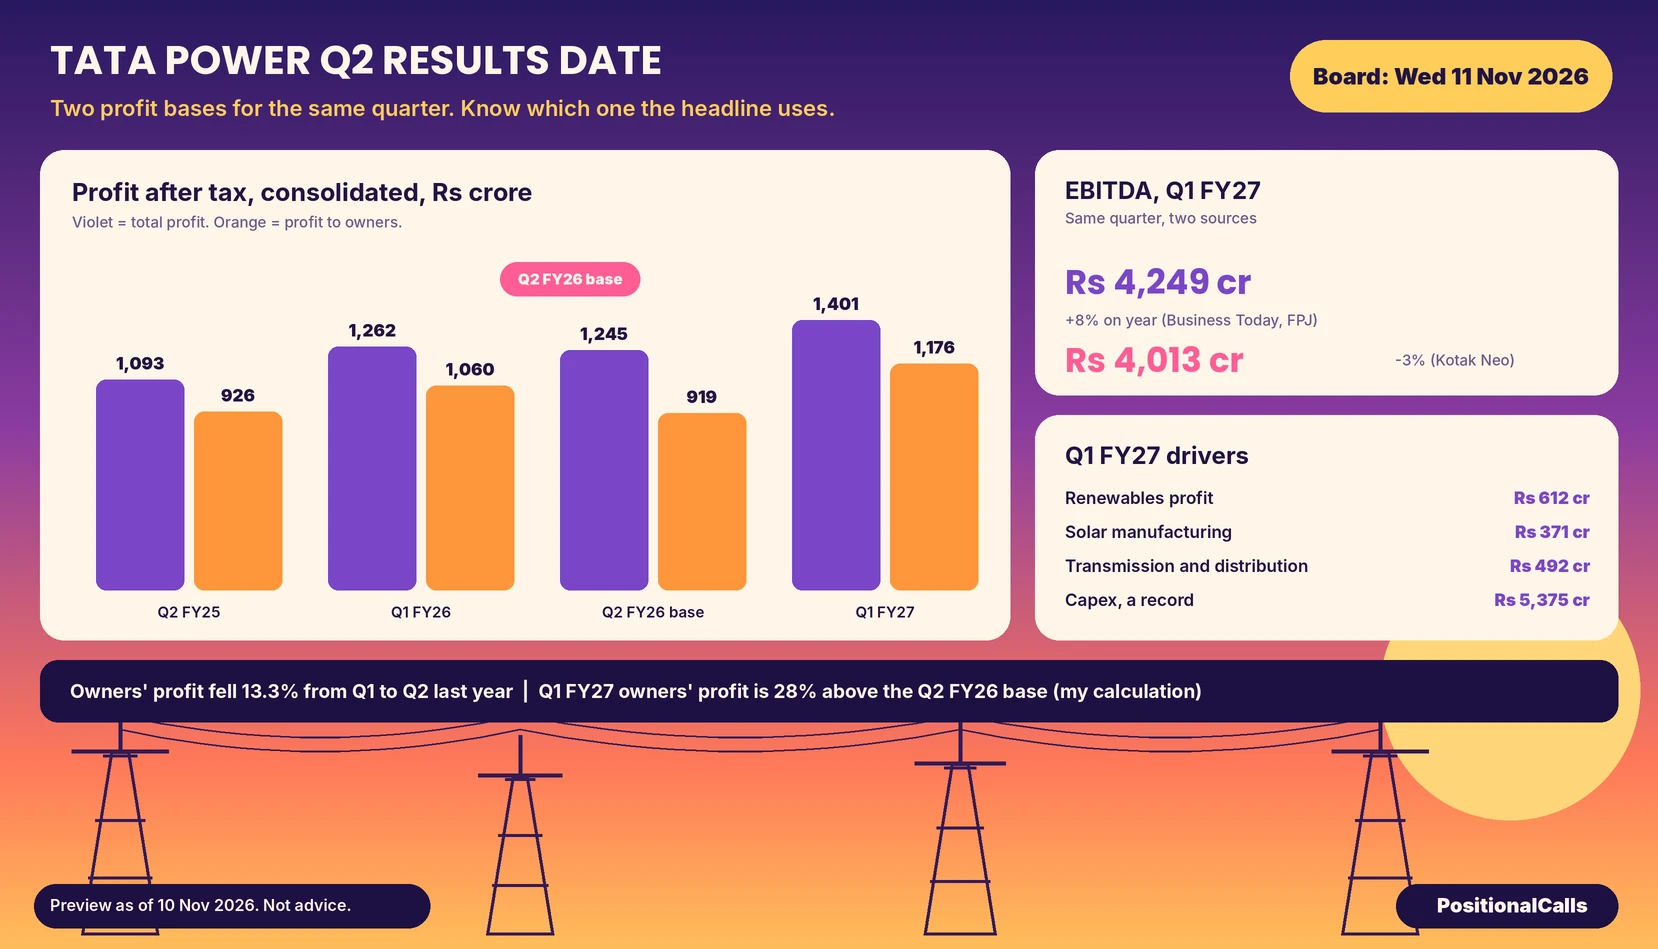
- Two profit bases: Q2 FY26 consolidated profit was Rs 1,245.39 crore in total and Rs 919 crore to owners; Q1 FY27 was Rs 1,401 crore and Rs 1,175.93 crore.
- Two EBITDA figures: Q1 FY27 EBITDA is Rs 4,249 crore (+8%) in one source and Rs 4,013 crore (-3%) in another; Q2 FY26 shows Rs 4,032 crore (+6%) and Rs 3,302 crore (-12%).
- Seasonal step: Last year owners’ profit fell 13.3% from Q1 to Q2, so the Q1 run-rate of Rs 1,176 crore sits 28% above the Q2 FY26 base (my calculation).
- Estimates found: Two previews, no consensus: JM Financial (via Business Today, 5 October 2026) sees profit of Rs 1,305 crore; a Zee Business headline says Rs 1,263 crore. Each is single-source and the definitions are unstated.
In plain words: Tata Power makes and sells electricity, builds solar and wind capacity, makes solar cells and modules, and runs power distribution in Mumbai, Delhi, Odisha and elsewhere. Part of its profit belongs to outside shareholders in its subsidiaries, so the same quarter shows two profit numbers. This Tata Power Q2 FY27 preview gives the date, both profit bases, the two ways EBITDA is reported and what to read first.
Data note: as of Tuesday, 10 November 2026, 11:00 AM IST. The date comes from Upstox (7 October 2026) and Kotak Neo (8 October 2026), which cite the exchange filing, and from weekly lists on 7 and 8 November. The two estimates come from Business Today (5 October 2026) and the headline of a Zee Business preview, whose page I could not open. Q1 FY27 figures come from Business Today, Free Press Journal and Kotak Neo (27 July 2026). Q2 FY26 figures come from Kotak Neo’s results page, PTI via NewsDrum and Upstox (11 November 2025). I did not open the BSE or NSE filings. Sources disagree on revenue, EBITDA and profit labels; each version is shown with its source. Derived figures are marked “my calculation”. If the filing differs from a source quoted here, the filing governs, and I will correct this page with a visible note.
When is the Tata Power Q2 results date and time?
The Tata Power Q2 results date is Wednesday, 11 November 2026, when the board meets to consider the audited standalone and unaudited consolidated results for the quarter and half-year ended 30 September 2026; the time is not announced.
Upstox (updated 7 October 2026) and Kotak Neo (8 October 2026) both report the same date from the company’s exchange filing, and the Upstox and Goodreturns weekly lists of 7 and 8 November repeat it. I found no conflicting date for the Tata Power Q2 results date. I could not open the BSE letter dated 7 October 2026, so the date rests on these reports, not on a document I read. The Tata Power Q2 results time is not given in any of these reports. Upstox adds that in the past two quarters the results were released after market hours. If that repeats on 11 November, the first price reaction would come in the Thursday, 12 November session (my reading, not stated in the sources). The SEBI listing rules give a deadline of 14 November 2026, 45 days after quarter end.
Tata Power Q2 results date: what changed and when
| Event | Date | Weekday | Status |
|---|---|---|---|
| Exchange intimation of the board meeting | 7 October 2026 | Wednesday | Letter not opened; reported by Upstox and Kotak Neo |
| Q2 FY26 results | 11 November 2025 | Tuesday | Filed; this is the year-ago base |
| Q1 FY27 results | 27 July 2026 | Monday | Filed; the latest run-rate |
| Q2 FY27 board meeting | 11 November 2026 | Wednesday | Reported date; time not announced |
| SEBI deadline for Q2 results | 14 November 2026 | Saturday | Legal limit |
Cite this table: PositionalCalls, “Tata Power Q2 Results Date Table, as of 10 November 2026”.
The Tata Power Q2 results date falls in a busy week, with other companies reporting; see the Q2 results calendar for every date. For how another power company set up its quarter, see NHPC Q2 results FY27 and Adani Power Q2 results FY27.
Tata Power profit base to beat: what mark must Q2 FY27 clear?
The Tata Power profit base to beat is the Q2 FY26 consolidated profit of Rs 1,245.39 crore in total, or Rs 919 crore attributable to owners, and the Q1 FY27 run-rate is Rs 1,401 crore in total or Rs 1,175.93 crore to owners.
| Consolidated, Rs crore | Q2 FY25 | Q1 FY26 | Q2 FY26 (base) | Q1 FY27 | Source note |
|---|---|---|---|---|---|
| Total profit after tax | 1,093.08 | 1,262.32 | 1,245.39 | 1,401 | Kotak Neo table; FPJ and Upstox for Q1 FY27 |
| Profit to owners | 926.5 | 1,059.86 | 919 | 1,175.93 | Upstox and Business Today |
| Gap (my calculation) | 166.58 | 202.46 | 326.39 | 225.07 | Likely minority interest; not labelled |
| Change in total profit on year | – | – | +13.9% | +11% | My calculation and reports |
| Change in owners’ profit on year | – | – | -0.8% | +10.95% | My calculation and reports |
Cite this table: PositionalCalls, “Tata Power Profit Base Table, as of 10 November 2026”.
The Tata Power Q2 FY26 net profit is quoted as Rs 1,245.39 crore, Rs 1,245 crore or Rs 919 crore depending on the source. The gap between the two profit lines was Rs 326.39 crore in Q2 FY26 and Rs 225.07 crore in Q1 FY27 (my calculation). That is why one headline said profit rose 14% and another said it dipped about 1% for the same quarter. A Q2 FY27 headline of “profit up” on the Tata Power Q2 results date can only be judged against the matching base. On the owners’ basis, Q1 FY27 profit of Rs 1,175.93 crore is already 28.0% above the Q2 FY26 base of Rs 919 crore; on the total basis it is 12.5% above Rs 1,245.39 crore (my calculation). The Tata Power Q2 results date therefore decides which of the two bases the headlines will use.
Which Tata Power profit, revenue and EBITDA figures are right?
Use total profit after tax or profit to owners, but never mix them; revenue and EBITDA each appear in two versions, and the EBITDA versions give opposite signs for growth, so name the source and basis with every figure.
| Measure | Version A | Version B | What differs |
|---|---|---|---|
| Q1 FY27 revenue | Rs 19,051.26 crore, +5.64% on 18,035.07 (Business Today, Kotak Neo) | Rs 18,898 crore, +8% on 17,464 (Free Press Journal, Upstox) | Gap Rs 153 crore in Q1 FY27; the year-ago bases also differ |
| Q1 FY27 EBITDA | Rs 4,249 crore, +8% on 3,930 (Business Today, FPJ) | Rs 4,013 crore, -3% on 4,139; margin 21.06% (Kotak Neo) | Gap Rs 236 crore; opposite growth signs |
| Q2 FY26 revenue | Rs 15,545 crore, -0.97% on 15,698 (Upstox) | Rs 15,769 crore, +3% on 15,247 (PTI) | Different bases for the same quarter |
| Q2 FY26 EBITDA | Rs 4,032 crore, +6% on 3,808 (PTI, Kotak Neo FAQ, Upstox) | Rs 3,302 crore, -12% on 3,746; margin 21.2% (Upstox) | Gap Rs 730 crore; opposite growth signs |
| Q2 FY26 profit | Rs 1,245.39 crore total, +13.9% (Kotak Neo, PTI) | Rs 919 crore to owners, about -1% (Upstox, Business Today) | Gap Rs 326 crore |
Cite this table: PositionalCalls, “Tata Power Definitions Table, as of 10 November 2026”.
My calculation: the margins match their own versions. Rs 4,013 crore over Rs 19,051.26 crore is 21.06%, and Rs 3,302 crore over Rs 15,545 crore is 21.24%, which are the margins those sources print. That suggests the lower EBITDA versions exclude items that the higher versions include, probably other income, but no source says so and I could not reconcile the gaps, which are Rs 236 crore in Q1 FY27 and Rs 730 crore in Q2 FY26. Compare each new figure with the version from the same source. Every comparison on the Tata Power Q2 results date should name its source and basis.
Two further checks, both my calculation. First, profit before tax of Rs 1,550.82 crore less tax of Rs 434.51 crore is Rs 1,116.31 crore, which is Rs 129.08 crore below the reported Rs 1,245.39 crore profit; the same gap is Rs 129.63 crore in Q1 FY26. A steady gap of about Rs 129 crore looks like a regular add-back, probably the share of profit of joint ventures and associates, but the page does not say. Second, Rs 919 crore over earnings per share of Rs 2.88 is about 319 crore shares, and Rs 926.5 crore over Rs 2.90 is about 319.5 crore, so earnings per share is computed on the owners’ profit. The share count is not stated in the sources.
One source page also calls the Rs 1,245.39 crore figure a “net loss” in an FAQ line while its table and summary show a profit, so I treat that line as a typing error.
What do analysts expect from Tata Power before the Q2 results date?
I found two Tata Power Q2 FY27 profit previews: JM Financial sees Rs 1,305 crore (via Business Today, 5 October 2026) and a Zee Business headline says Rs 1,263 crore. Each is a single source, not a consensus, and neither states its profit definition; the seasonal step below is my calculation, not an estimate.
| Preview (as reported) | Profit seen | On owners’ Rs 919 cr (my calculation) | On total Rs 1,245.39 cr (my calculation) | Caveat |
|---|---|---|---|---|
| JM Financial via Business Today, 5 Oct 2026 | Rs 1,305 crore (+81% as reported); sales Rs 20,167 crore | +42.0% | +4.8% | +81% implies a base near Rs 721 crore, which matches neither figure |
| Zee Business headline (page not opened) | Rs 1,263 crore (+37%) | +37.4% | +1.4% | Rs 1,263 over 1.37 is about Rs 922 crore, close to the owners’ base (my reading) |
Cite this table: PositionalCalls, “Tata Power Q2 FY27 Previews, as of 10 November 2026”.
JM Financial also expects double-digit growth in generation, with Mundra and the former JSW Energy plants supporting it, and notes the shares were down 9% this year at that date. Its sales figure is Rs 20,167 crore, 5.9% above Q1 FY27 revenue of Rs 19,051.26 crore (my calculation). I attribute these as reported and do not endorse them.
| Step, Q1 to Q2 | FY26 actual | Same step applied to FY27 (my calculation) | Reading |
|---|---|---|---|
| Owners’ profit | 1,059.86 to 919 (-13.3%) | 1,175.93 to about 1,020 (+10.95% on year) | Q2 was seasonally weaker on this basis |
| Total profit | 1,262.32 to 1,245.39 (-1.3%) | 1,401 to about 1,382 (+10.99% on year) | Total profit was steadier |
| Q1 FY27 level held flat | – | Owners’ 1,175.93 (+28.0%); total 1,401 (+12.5%) | No seasonal dip |
Cite this table: PositionalCalls, “Tata Power Seasonality Check, as of 10 November 2026”.
My calculation: the owners’ profit fell much more than total profit between Q1 and Q2 of FY26, because the gap to minority interest widened from Rs 202 crore to Rs 326 crore. Carrying the same step into FY27 gives a year-on-year growth rate equal to Q1’s, about 11% on either basis. That is arithmetic about the base, not a forecast. If a reader sees a very large percentage growth in owners’ profit, check whether the minority share fell back toward Rs 225 crore.
Compare each preview’s profit definition with the two bases above, and treat a single preview as one source, not a consensus. The headline gap between Rs 1,305 crore and Rs 1,263 crore is Rs 42 crore (my calculation).
PositionalCalls WhatsApp channel
Get the Tata Power result note on 11 November
- Alerts when Tata Power files its results
- The profit basis and EBITDA version we check first
- A link when this page is updated with the numbers
What drives Tata Power’s results: renewables, solar manufacturing and T&D?
The Q1 FY27 profit drivers were renewables (Rs 612 crore, +15%), solar cell and module manufacturing (Rs 371 crore, about 3.9 times), rooftop solar (Rs 145 crore, 1.7 times) and transmission and distribution (Rs 492 crore, +11%), with record capex of Rs 5,375 crore.
| Segment (Q1 FY27) | Reported figure | Source |
|---|---|---|
| Renewables profit after tax | Rs 612 crore, +15% | Business Today, Kotak Neo |
| Solar cell and module manufacturing profit | Rs 371 crore, about 3.9 times | Business Today, FPJ (+287%) |
| Rooftop solar profit | Rs 145 crore, 1.7 times; order book Rs 639 crore | Business Today, FPJ |
| Transmission and distribution profit | Rs 492 crore, +11%; EBITDA Rs 1,541 crore, +14% | Business Today, FPJ |
| Odisha distribution companies profit | Rs 111 crore, +6% | Kotak Neo |
| Generation and coal EBITDA | Rs 1,027 crore, +5.4% | FPJ |
| Renewable EBITDA | Rs 1,696 crore, +8.3% | FPJ |
| Capital expenditure | Rs 5,375 crore, a record | Business Today |
| Net debt and gross debt | Rs 61,238 crore and Rs 74,069 crore; net debt to equity 1.25 | FPJ |
Cite this table: PositionalCalls, “Tata Power Segment Table, as of 10 November 2026”.
The Mundra 4 GW plant returned to full operation in April after a nine-month shutdown, with 94% availability in Q1 (Business Today, FPJ). Kotak Neo notes a lower contribution from Tata Projects and higher corporate expenses in Q1. The board also approved raising up to Rs 4,500 crore through debt securities, mainly to refinance borrowings, and management outlined about Rs 40,000 crore of transmission investment by 2030.
My calculation: the renewables, solar manufacturing and rooftop solar profits of Rs 612 crore, Rs 371 crore and Rs 145 crore add to Rs 1,128 crore, and the sources do not say how this overlaps with the consolidated figure, so I do not compare it with the Rs 1,401 crore total. Gross debt of Rs 74,069 crore less net debt of Rs 61,238 crore is Rs 12,831 crore of cash and equivalents. On the Tata Power Q2 results date, check three lines in this order: segment profit against Q1, availability at Mundra against 94%, and net debt against Rs 61,238 crore. A profit headline that rises while net debt also rises tells a different story from one where debt falls, and JM Financial’s generation view is a reason to read the generation EBITDA line first.
As of 8 October 2026 the shares traded near Rs 341 to Rs 346 on the NSE, close to a 52-week low of Rs 341, against a 52-week high of about Rs 464.8 on 28 April 2026 (Upstox, Kotak Neo). I found no later price. This is context, not a view.
Business Today quotes CEO and managing director Praveer Sinha calling Q1 a quarter of “several strategic milestones”, including the return of the Mundra plant to full operation. The 300 kWp floating solar pilot with Ocean Sun at the Mulshi reservoir, announced in October, is small.
What could Tata Power’s Q2 profit look like? A sensitivity table
Under my arithmetic, Tata Power’s Q2 FY27 profit could land anywhere from about Rs 873 crore to Rs 1,176 crore on the owners’ basis, and from about Rs 1,183 crore to Rs 1,432 crore on the total basis; this is a sensitivity table, not a forecast.
Assumptions: each row applies a stated change to the Q2 FY26 base of Rs 919 crore (owners’ share) and Rs 1,245.39 crore (total profit); row C applies last year’s Q1 to Q2 step to Q1 FY27 profit; row E holds Q1 FY27 profit flat.
| Scenario | Owners’ profit (Rs crore) | Change on Rs 919 | Total profit (Rs crore) | Change on Rs 1,245.39 |
|---|---|---|---|---|
| A: profit 5% lower on year | 873 | -5.0% | 1,183 | -5.0% |
| B: flat on year | 919 | 0.0% | 1,245 | 0.0% |
| C: last year’s seasonal step | 1,020 | +11.0% | 1,382 | +11.0% |
| D: 15% higher on year | 1,057 | +15.0% | 1,432 | +15.0% |
| E: Q1 FY27 level held flat | 1,176 | +28.0% | 1,401 | +12.5% |
Cite this table: PositionalCalls, “Tata Power Q2 FY27 Sensitivity Table, as of 10 November 2026”.
These are not estimates. One percentage point of change on the owners’ base is Rs 9.19 crore, and on the total base Rs 12.45 crore (my calculation). Judge the numbers released on the Tata Power Q2 results date on the matching basis and on how the minority gap moved, not only on the headline growth rate.
Three worked examples
- Same-basis growth: if owners’ profit is Rs 1,000 crore, growth on Rs 919 crore is 8.8%; the same Rs 1,000 crore against the total base of Rs 1,245.39 crore would be a 19.7% fall. The basis changes the sign.
- Seasonal step: Rs 1,175.93 crore times Rs 919 crore over Rs 1,059.86 crore is about Rs 1,020 crore, a rise of 10.95%.
- Minority gap: if total profit is Rs 1,382 crore and the gap is Rs 326 crore as in Q2 FY26, owners’ profit would be about Rs 1,056 crore; if the gap is Rs 225 crore as in Q1 FY27, it would be about Rs 1,157 crore.
Tata Power Q2 results date decoder: what to read first
For the Tata Power Q2 results, read the profit basis first, then EBITDA with its source version, then segment profit, capex and net debt.
| What to read | Mark to beat | Question to ask |
|---|---|---|
| Profit after tax (total) | Rs 1,245.39 crore (year-ago); Rs 1,401 crore (Q1) | Is growth above the 11% of Q1? |
| Profit to owners | Rs 919 crore (year-ago); Rs 1,175.93 crore (Q1) | Did the minority gap move from Rs 326 crore? |
| Revenue from operations | Rs 15,545 crore or Rs 15,769 crore (year-ago) | Which version is the filing? |
| EBITDA | Rs 4,032 crore or Rs 3,302 crore (year-ago) | Is other income included? |
| Renewables and solar manufacturing profit | Rs 612 crore and Rs 371 crore (Q1) | Did they hold the Q1 level? |
| Transmission and distribution | Profit Rs 492 crore; EBITDA Rs 1,541 crore (Q1) | Did growth stay near 11% to 14%? |
| Capex and net debt | Rs 5,375 crore; Rs 61,238 crore (Q1) | Did net debt rise with capex? |
| Dividend | No notice found | Is an interim dividend declared? |
Cite this table: PositionalCalls, “Tata Power Results-Day Decoder, as of 10 November 2026”.
Tata Power results terms in plain words
Seven terms decide how the Tata Power Q2 results read: total profit, profit to owners, minority interest, EBITDA, other income, capex and net debt to equity.
| Term | Plain meaning | Why it matters for Tata Power |
|---|---|---|
| Total profit after tax | Profit of the whole group after tax, including shares owned by outside investors | Rs 1,245.39 crore in Q2 FY26 and Rs 1,401 crore in Q1 FY27 |
| Profit to owners | The part of that profit that belongs to Tata Power’s own shareholders | Rs 919 crore and Rs 1,175.93 crore; earnings per share uses it |
| Minority interest | The share of subsidiary profit that belongs to outside shareholders | The gap of Rs 326 crore and Rs 225 crore (my calculation) |
| EBITDA | Operating earnings before interest, tax, depreciation and amortisation | Reported as Rs 4,249 crore or Rs 4,013 crore for Q1 FY27 |
| Other income | Income outside the core business, such as interest and dividends | May explain why EBITDA versions differ; not confirmed by the sources |
| Capex | Money spent on plants, lines and equipment | A record Rs 5,375 crore in Q1 FY27 |
| Net debt to equity | Debt less cash, divided by shareholders’ equity | 1.25 at the end of June 2026 (Free Press Journal) |
Cite this table: PositionalCalls, “Tata Power Results Terms, as of 10 November 2026”.
A figure with no label is the first thing to question. When a headline says “Tata Power profit rises”, ask whether it means total profit or owners’ profit, whether it is consolidated or standalone, and which year-ago figure it compares with. The same habit applies to every company on the results calendar.
How to read the Tata Power Q2 results and what to avoid
On the Tata Power Q2 results date, use the exchange filing and the company’s press release, and ignore any message that offers the result early.
- Open the BSE or NSE announcements page for Tata Power and find the results filing.
- Read the consolidated statement, then the standalone one; the board takes audited standalone results too.
- Find total profit after tax and the share attributable to owners, and note the minority gap.
- Check the EBITDA line and whether other income is included.
- Compare segment profit, capex and net debt with the decoder.
- Note any exceptional items, dividend and management commentary.
Five common mistakes
- Mixing bases: comparing owners’ profit with the total-profit base, or the reverse.
- Mixing sources: taking Rs 4,249 crore EBITDA from one site and the Rs 3,930 crore year-ago figure from another.
- Reading standalone as consolidated: the board approves both, and the figures differ.
- Trusting an early screenshot: only the filing counts.
- Calling a beat against one preview: name the source and its definition.
What it costs and what to avoid
Reading the result costs nothing. Dealing costs depend on your broker, so check the current charges schedule. For tax on dividends and gains, see our capital gains tax on shares guide. Fake result alerts, “sure-shot” tips and KYC or OTP links circulate around results days. Never share an OTP.
What most people miss before the Tata Power Q2 results date
Analyst’s note on the Tata Power Q2 results date and base
- What stands out: the same quarter shows profit up 13.9% or down 0.8% depending on the basis, and Q1 FY27 EBITDA up 8% or down 3%.
- Easy to miss: the owners’ profit base of Rs 919 crore is low next to the Q1 run-rate of Rs 1,175.93 crore, which can make owners’ growth look large.
- What would change the view: a filing that shows a different minority gap, an exceptional item or a change in how EBITDA is reported.
- Caution: the sensitivity table is my own arithmetic, not a forecast or target. This note is reasoning from reported figures.
- Reader action: on the Tata Power Q2 results date, 11 November, match each headline to the profit and EBITDA definitions above.
Bottom line
The Tata Power Q2 results date is Wednesday, 11 November 2026, and the base is Rs 1,245.39 crore total profit or Rs 919 crore to owners from Q2 FY26, and the same quarter shows EBITDA of Rs 4,032 crore or Rs 3,302 crore depending on the source. JM Financial’s Rs 1,305 crore and a Zee headline’s Rs 1,263 crore are single-source previews, so read the profit basis, EBITDA version, segment profit and net debt in that order.
Next read: the Q2 results calendar for every date this season.
Part of the Earnings series.
PositionalCalls WhatsApp channel
Follow power and energy results on WhatsApp
- Results calendar changes across energy companies
- Base-to-beat tables for power utilities
- A link to each analysis when it is updated
Tata Power Q2 results date: frequently asked questions
When is the Tata Power Q2 results date?
Tata Power’s board meets on Wednesday, 11 November 2026 to consider the audited standalone and unaudited consolidated results for the quarter and half-year ended 30 September 2026, per Upstox and Kotak Neo citing the exchange filing. I could not open the BSE letter, and the time is not announced.
What time will Tata Power announce Q2 results?
The Tata Power Q2 results time is not announced. Upstox says the results came after market hours in the past two quarters, on 27 July 2026 and 11 November 2025. If that repeats, the first price reaction would be in the 12 November session. Confirm on the BSE or NSE page.
What is Tata Power’s profit base for Q2 FY27?
Ahead of the Tata Power Q2 results date, note that for Q2 FY26 consolidated profit was Rs 1,245.39 crore in total and Rs 919 crore attributable to owners, per Kotak Neo and Upstox. Use the base that matches the Q2 FY27 headline.
Why does Tata Power show two profit figures?
The total includes profit that belongs to minority shareholders of subsidiaries. The gap was Rs 326.39 crore in Q2 FY26 and Rs 225.07 crore in Q1 FY27 (my calculation, not labelled by the sources). Quote the basis with the figure.
What were Tata Power’s Q1 FY27 results?
Reported on 27 July 2026: total profit of Rs 1,401 crore (+11%), owners’ profit of Rs 1,175.93 crore (+10.95%), revenue of Rs 19,051.26 crore or Rs 18,898 crore depending on the source, and record capex of Rs 5,375 crore.
What do analysts expect from Tata Power in Q2 FY27?
I found two profit previews, not a consensus: JM Financial sees Rs 1,305 crore (+81% as reported, via Business Today, 5 October 2026) and a Zee Business headline says Rs 1,263 crore (+37%). Neither states its profit definition, so compare each with the Rs 919 crore and Rs 1,245.39 crore bases.
Why do Tata Power’s EBITDA figures differ between sources?
Q1 FY27 EBITDA is Rs 4,249 crore (+8%) in Business Today and Free Press Journal and Rs 4,013 crore (-3%) in Kotak Neo; Q2 FY26 shows Rs 4,032 crore (+6%) and Rs 3,302 crore (-12%). The gaps are Rs 236 crore and Rs 730 crore; the sources do not explain them.
Which Tata Power segments matter for Q2 FY27?
In Q1 FY27, renewables earned Rs 612 crore, solar manufacturing Rs 371 crore, rooftop solar Rs 145 crore and transmission and distribution Rs 492 crore. The Mundra plant also returned to full operation.
Will Tata Power declare an interim dividend with Q2 results?
I did not find an interim dividend notice, and the Q1 FY27 reports I opened do not mention a dividend. Only the board outcome on the Tata Power Q2 results date can confirm one, so check the exchange filing.
Does this page give a Tata Power buy or sell call?
No. This is research and education, not advice. PositionalCalls.com is not a SEBI-registered research analyst or investment adviser. Use the numbers to frame questions and speak to a registered adviser before investing.
Sources
- Upstox, Tata Power Q2 FY27 results schedule (updated 7 October 2026)
- Kotak Neo, Tata Power Q2 results date (8 October 2026)
- Goodreturns, Q2 results next week (7 November 2026)
- Upstox, upcoming Q2 FY27 results this week (8 November 2026)
- Business Today, Tata Power Q1 FY27 (27 July 2026)
- Free Press Journal, Tata Power Q1 FY27 (27 July 2026)
- Kotak Neo, Tata Power Q1 FY27 results
- Kotak Neo, Tata Power Q2 FY26 results table
- PTI via NewsDrum, Tata Power Q2 FY26 (11 November 2025)
- Upstox, Tata Power Q2 FY26 (11 November 2025)
- Business Today, Q2 results preview with JM Financial estimate (5 October 2026)
- Zee Business, Tata Power Q2 results preview (headline only; page not opened)
- BSE and NSE announcement pages and the Tata Power investor page: where the filing is published (I did not open them; the BSE letter of 7 October 2026 could not be fetched).
Editorial disclosure: PositionalCalls.com is not a SEBI-registered research analyst or investment adviser. Investments in securities markets are subject to market risks. Read all related documents carefully before investing. Returns are never guaranteed. PositionalCalls.com is an independent research and education site founded by Shubham Chaudhary. This page is not investment advice, a recommendation or a price target. How I researched this: I compared twelve press and data-platform reports of the date and the last two results, tied profit, EBITDA margins and earnings per share across them, recalculated every derived figure and listed conflicts openly. I did not open the exchange filings; own calculations are labelled.

Shubham Chaudhary is the founder of PositionalCalls, an independent Indian stock market research website. He writes company fundamentals, quarterly results analysis, IPO analysis and sector research for NSE and BSE listed companies, with a focus on banking stocks, insurance and long-term value investing. Every article is built from primary sources such as RBI, SEBI, NSE and BSE filings and company annual reports, and states its risks plainly in simple language for retail investors.
Coverage areas Our research standards- Numbers checked against NSE, BSE and SEBI filings
- Risks and limits stated in every article
- No paid promotions or broker tie-ups
- Articles updated when new filings arrive