
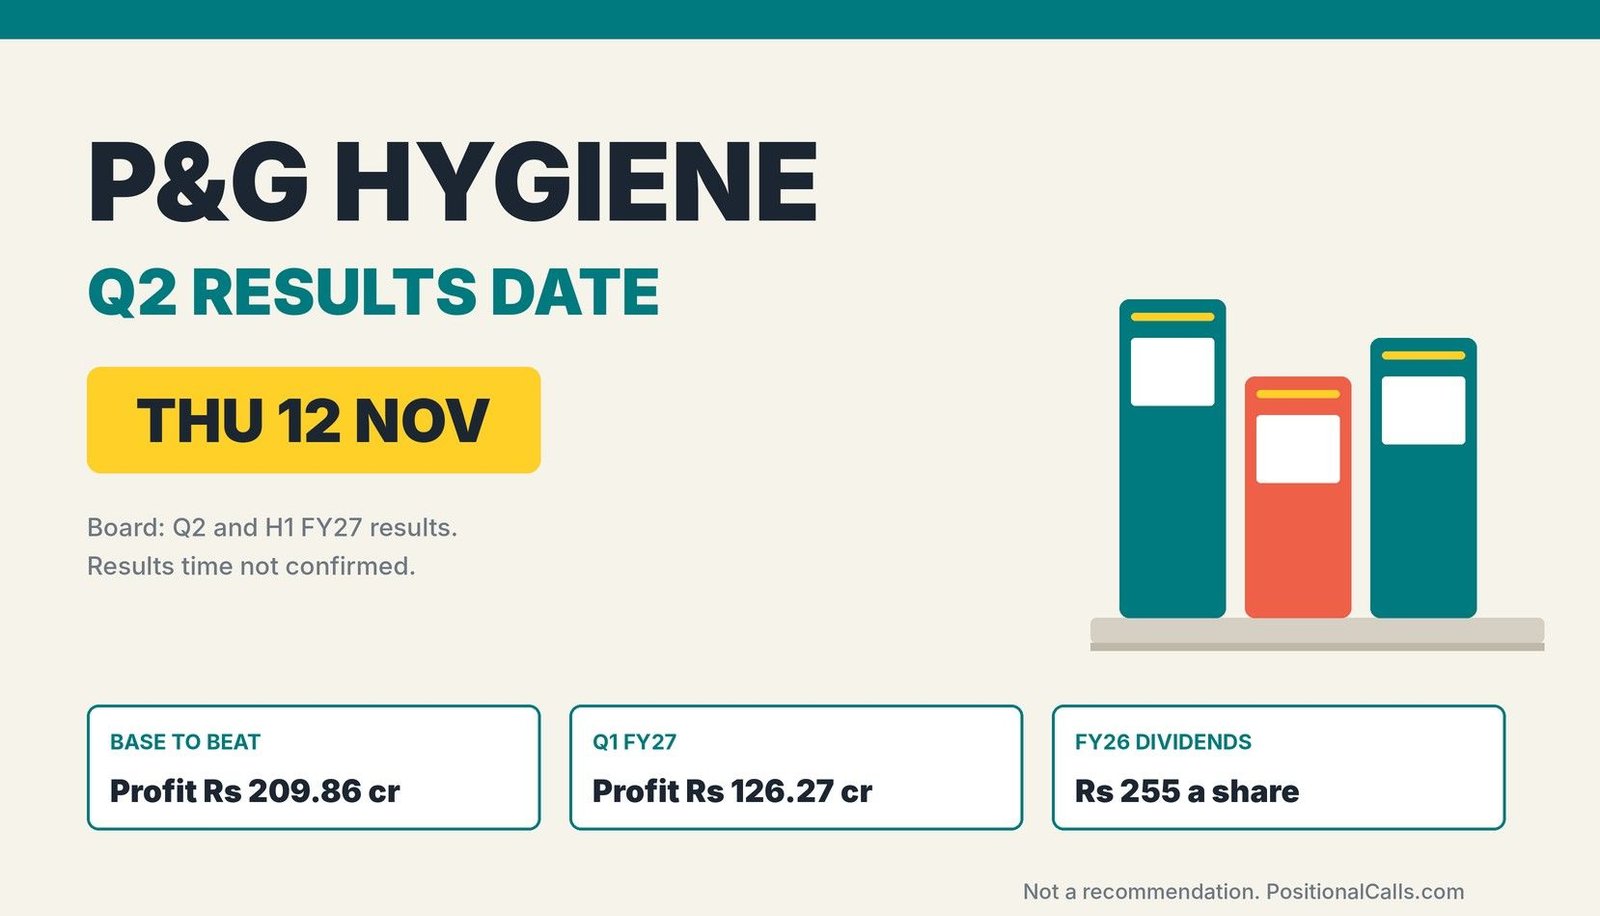
Earnings · FMCG · Q2 FY27 results declared
The P&G Hygiene Q2 results date was Thursday, 12 November 2026, and the numbers are out: revenue flat at Rs 1,145 crore, profit before tax down 7.0% and net profit down 6.7% to Rs 195.8 crore as raw material costs rose 20%. This page keeps the date, the base and the dividend record, and links to the full P&G Hygiene Q2 results FY27 analysis.
Quick answer
The P&G Hygiene Q2 results date was Thursday, 12 November 2026. Revenue was Rs 1,145.08 crore, down 0.4%, and net profit was Rs 195.84 crore, down 6.7% from Rs 209.86 crore, per Free Press Journal. First-half profit fell 19.9%. I found no dividend with the result.
Latest update (Thursday, 12 November 2026, 4:20 PM IST): P&G Hygiene and Health Care reported Q2 FY27 standalone results on Thursday, 12 November 2026, with the first reports at about 1:47 PM IST. I found no dividend announcement, no analyst consensus and no official closing price, and I have not opened the exchange filing. The earlier preview marks are kept below so the result can be checked against them.
Key takeaways
- Date: the board met on Thursday, 12 November 2026, as CompoundingAI had reported; the first reports appeared at about 1:47 PM IST.
- Result: revenue Rs 1,145.08 crore (-0.4%) and net profit Rs 195.84 crore (-6.7%), against the Rs 1,150.17 crore and Rs 209.86 crore base on this page.
- Costs: raw and packing material rose 20.4% to Rs 237.87 crore; total expenses rose about 2.5% on flat revenue.
- Recovery: profit was 55.1% above Q1 FY27’s Rs 126.27 crore but first-half profit was down 19.9% (Rs 322.11 crore against Rs 401.92 crore).
- Dividend: none found with the result; FY26 dividends totalled Rs 255 a share, including a Rs 25 special (CompoundingAI).
- Still open: no EBITDA, no estimate and no official close found.
In plain words: P&G Hygiene and Health Care sells household and health brands such as Vicks and Whisper in India. It earns steadily when volumes and prices hold, so a profit fall usually points to costs, mix or promotions.
Data note: Figures are as of 12 November 2026, 4:20 PM IST. Q2 FY27 figures come from Free Press Journal and Investywise; earlier figures from Business Standard, Free Press Journal, MarketsMOJO, Investywise and CompoundingAI. I could not open the exchange filings. Derived numbers are my calculation. This is Procter & Gamble Hygiene and Health Care Limited, not the separate listed company Procter & Gamble Health Limited.
In this post
- What did P&G Hygiene report?
- When was the results date and time?
- What was the base to beat?
- What did Q1 FY27 show?
- Dividends: what was paid and what was declared?
- What drives the quarter?
- How did the results compare with the scenarios?
- Decoder: what the filing answered
- How to read the filing
- What most people miss
- FAQs
- Sources
What did the company report on the P&G Hygiene Q2 results date?
On the P&G Hygiene Q2 results date, 12 November 2026, the company reported revenue of Rs 1,145.08 crore (-0.4%), profit before tax of Rs 262.02 crore (-7.0%) and net profit of Rs 195.84 crore (-6.7%), per Free Press Journal and Investywise.
| Line (Rs crore, standalone) | Q2 FY27 reported | Q2 FY26 base | Q1 FY27 | Outcome |
|---|---|---|---|---|
| Revenue from operations | 1,145.08 | 1,150.17 | 891.46 | Just below the base; +28.4% on Q1 |
| Total expenses | 900.07 | About 878.3 | 731.26 | +2.5% on the base |
| Profit before tax | 262.02 | 281.78 | Not found | -7.0% on the base |
| Net profit | 195.84 | 209.86 | 126.27 | Below the base; +55.1% on Q1 |
| Net profit margin | 17.1% | 18.2% | 14.2% | Below the base; above Q1 |
| Earnings per share (Rs) | 60.33 | 64.65 | 38.90 | -6.7% on the base |
Cite this table: P&G Hygiene Q2 FY27 against the preview marks, as of 12 November 2026, 4:20 PM IST, PositionalCalls; Q2 FY27 per Free Press Journal and Investywise.
The full line-by-line analysis, with the cost lines, the margin arithmetic and the first half, is in P&G Hygiene Q2 results FY27. Here I keep the date, the base and the dividend record that the preview raised. The preview said Q1 expenses had risen while revenue fell, and asked whether costs would ease. Q2 answered partly: expenses rose only about 2.5% on flat revenue, but raw and packing material rose 20.4% (my calculation). The figures are as reported by news sources and I have not opened the exchange filing.
When was the P&G Hygiene Q2 results date and time?
The board met on Thursday, 12 November 2026 to approve results for the quarter and half-year ended 30 September 2026, as CompoundingAI reported. The first reports appeared at about 1:47 PM IST, during market hours.
The first report I found is Investywise at about 1:47 PM IST (08:17 UTC), followed by an entry in the Upstox live blog at 1:55 PM and Free Press Journal, updated at 2:14 PM. I did not find the exact filing time and could not open the exchange intimation. Companies must report within 45 days of the quarter-end, which made Saturday, 14 November the limit; the company reported on day 43 (my calculation). Last year the board approved Q2 FY26 on 6 November 2025, per Investywise.
| Item | What was reported | Source and date | Status |
|---|---|---|---|
| Board meeting | 12 November 2026 | CompoundingAI | Held |
| Agenda | Q2 and H1 FY27 results | CompoundingAI | Done |
| Results | Revenue Rs 1,145.08 crore; profit Rs 195.84 crore | Free Press Journal; Investywise, 12 Nov | Reported |
| Results time | First reports about 1:47 PM IST | Investywise | Filing time not found |
| Dividend | No announcement found | Reports read | Check the filing |
| Analyst consensus | None found | Searches | Not available |
Cite this table: P&G Hygiene Q2 results date status, as of 12 November 2026, 4:20 PM IST, PositionalCalls.
See the Q2 results hub for the other reporters.
What was the profit and revenue base P&G Hygiene had to beat in Q2 FY27?
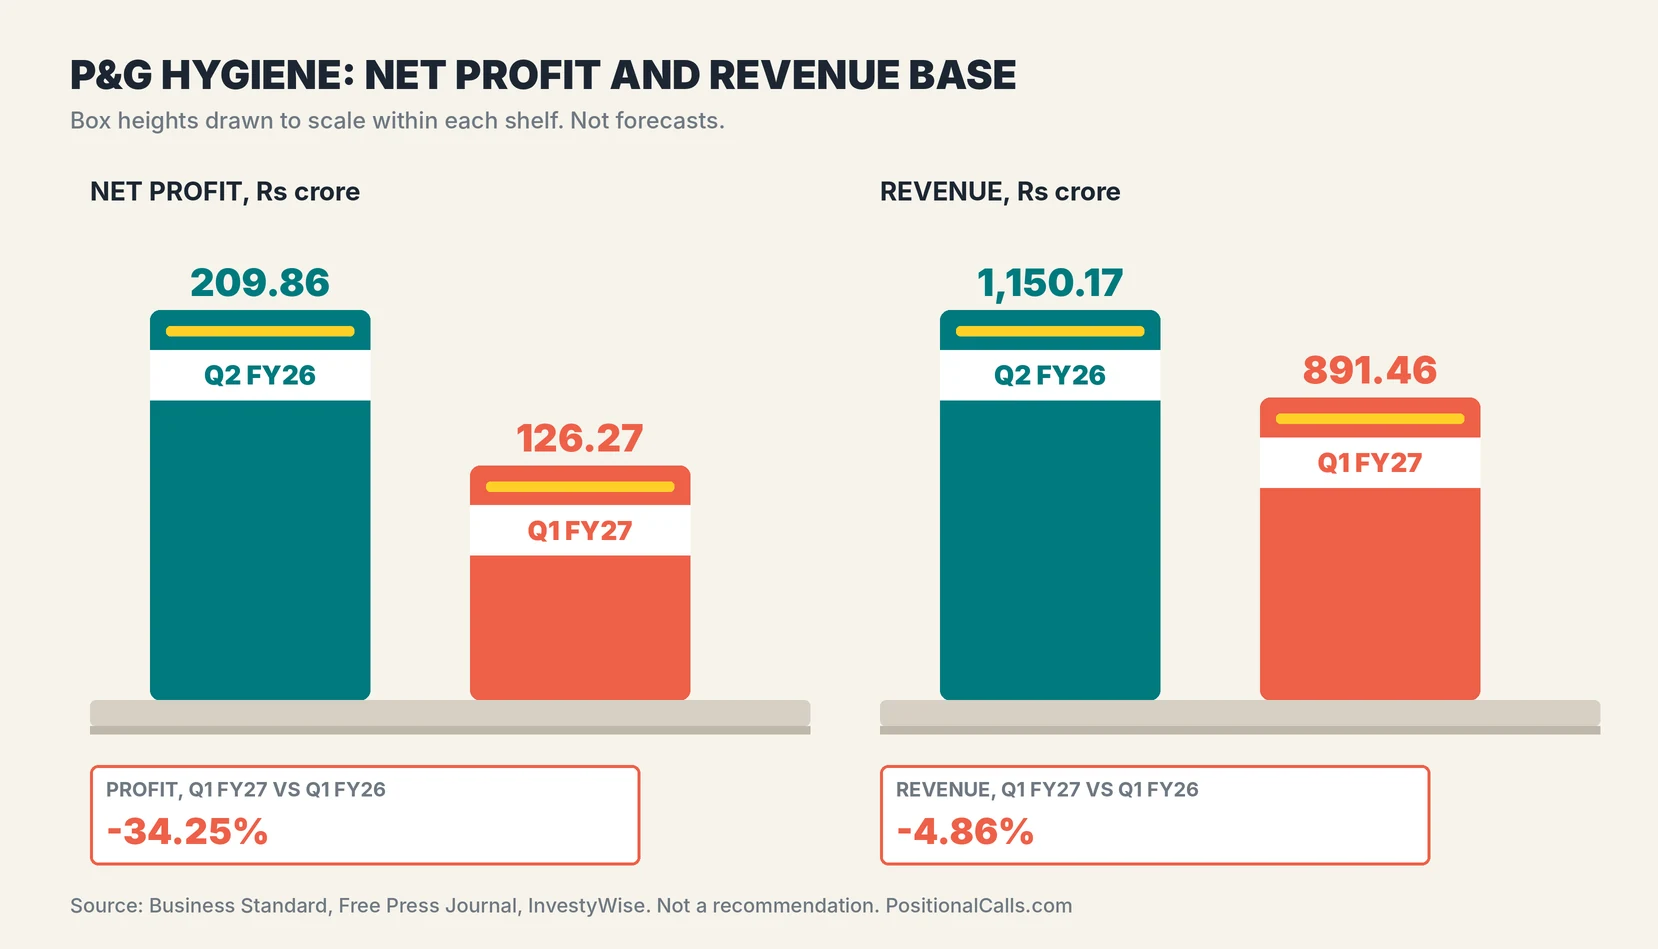
The Q2 FY26 base was revenue of Rs 1,150.17 crore, up 1.32%, and net profit of Rs 209.86 crore, down 1%. Profit before tax was Rs 281.78 crore and earnings per share Rs 64.65, per Business Standard and InvestyWise. Q2 FY27 revenue of Rs 1,145.08 crore was 0.4% below it and net profit of Rs 195.84 crore was 6.7% below it.
| Q2 FY26 (quarter to 30 Sep 2025) | Figure | Change | Source |
|---|---|---|---|
| Revenue from operations | Rs 1,150.17 crore | +1.32% year on year | Business Standard |
| Net profit | Rs 209.86 crore | -1% year on year | Business Standard |
| Profit before tax | Rs 281.78 crore | Not found | InvestyWise |
| Earnings per share | Rs 64.65 | Not found | InvestyWise |
| Net profit margin | 18.2% | My calculation | PositionalCalls |
| Implied tax | Rs 71.92 crore, 25.5% of profit before tax | My calculation | PositionalCalls |
Cite this table: P&G Hygiene Q2 FY26 base as reported; margin and tax derived by PositionalCalls.
The figures tie: Rs 209.86 crore on Rs 1,150.17 crore is 18.2%, and profit before tax of Rs 281.78 crore less profit of Rs 209.86 crore leaves Rs 71.92 crore of tax, 25.5% of profit before tax (my calculation). InvestyWise labels its figures in millions, but they match Business Standard’s crore figures, so I treat the label as an error; that is my reading, not confirmed. Neither source gives EBITDA for the quarter. InvestyWise shows total income of 1,160.07, which is Rs 9.90 crore above revenue and implies other income of about that size (my calculation).
Why the base is higher than the latest quarter
Q2 FY26 revenue was 29.0% above Q1 FY27 revenue and Q2 FY26 profit was 66.2% above Q1 FY27 profit (my calculation). Those are different quarters, so this is not a growth rate. Q2 FY27 revenue was 28.4% above Q1 FY27 and profit 55.1% above it, which closed most of that gap (my calculation).
What did P&G Hygiene report in Q1 FY27, the nearest mark?
In Q1 FY27 P&G Hygiene reported revenue of Rs 891.46 crore, down 4.86%, and net profit of Rs 126.27 crore, down 34.25% from Rs 192.06 crore. Earnings per share were Rs 38.90 against Rs 59.17, per Free Press Journal.
| Q1 FY27 (quarter to 30 June 2026) | Q1 FY27 | Q1 FY26 | Change |
|---|---|---|---|
| Revenue from operations | Rs 891.46 crore | Rs 937.03 crore | -4.86% |
| Total income | Rs 900.89 crore | Rs 944.72 crore | -4.60% |
| Total expenses | Rs 731.26 crore | Rs 680.02 crore | +7.54% |
| Net profit | Rs 126.27 crore | Rs 192.06 crore | -34.25% |
| Earnings per share | Rs 38.90 | Rs 59.17 | -34.3% (my calculation) |
| Net profit margin | 14.2% | 20.5% | -6.3 points |
Cite this table: P&G Hygiene Q1 FY27 per Free Press Journal; margins checked by PositionalCalls.
These tie: Rs 891.46 crore over Rs 937.03 crore is a 4.86% fall, and Rs 126.27 crore over Rs 192.06 crore is a 34.25% fall (my calculation). Total expenses rose to 82.0% of revenue from 72.6% a year earlier (my calculation), so revenue fell while costs rose. Q2 FY27 repeated the pattern in part: expenses rose about 2.5% on revenue down 0.4% (my calculation). The article gives no reason for the Q1 fall; MarketsMOJO suggests higher input costs, product mix or promotions, which is its own reading and is not confirmed by the company.
Margins and the sequential view
| Item | Q1 FY27 | Compared with | Source |
|---|---|---|---|
| Operating margin | 19.11% | 28.46% in Q1 FY26 (-932 bps); 23.28% in Q4 FY26 | MarketsMOJO |
| Operating profit | Rs 170.06 crore | Not found for earlier quarters | MarketsMOJO |
| Net profit | Rs 126.27 crore | Rs 153.13 crore in Q4 FY26 (-17.52%) | MarketsMOJO |
| Other income | Rs 9.43 crore | Rs 7.69 crore in Q1 FY26 | MarketsMOJO |
| Employee costs | Rs 54.36 crore | Rs 48.35 crore in Q1 FY26 | MarketsMOJO |
Cite this table: P&G Hygiene Q1 FY27 margins and costs per MarketsMOJO; not checked against the filing.
Sources differ in small ways. MarketsMOJO gives net sales of Rs 889.92 crore against Free Press Journal’s revenue from operations of Rs 891.46 crore, a gap of Rs 1.54 crore that probably reflects a definition difference I could not confirm. CompoundingAI puts the EBITDA margin fall at 933 basis points, against 932 from MarketsMOJO; the rounding differs.
What dividends has P&G Hygiene paid, and was one declared on 12 November?
CompoundingAI reports FY26 dividends of Rs 255 a share: an interim of Rs 195, including a one-time special of Rs 25, paid in February 2026, and a final of Rs 60 with a 1 September 2026 record date. No dividend is mentioned for 12 November.
PositionalCalls WhatsApp channel
The results, then the margin check
- The revenue, margin and profit lines as soon as they appear
- Dividend news explained
- Links to the updated page
| Dividend item | Reported | Detail | Source |
|---|---|---|---|
| Interim dividend | Rs 195 a share | Includes a one-time special of Rs 25; paid 26 February 2026 | CompoundingAI |
| Final dividend | Rs 60 a share | Record date 1 September 2026; payment by 6 October 2026 | CompoundingAI |
| Total for FY26 | Rs 255 a share | Sum of the two (my calculation) | CompoundingAI |
| Total paid in the year | Rs 844 crore | Reported by CompoundingAI | CompoundingAI |
| This meeting | Not mentioned | Check the exchange announcement | None found |
Cite this table: P&G Hygiene dividend record per CompoundingAI; not checked against the filing.
The sums do not tie exactly. Rs 255 a share over about 3.246 crore shares is about Rs 828 crore (my calculation, using shares implied by profit and earnings per share), against the Rs 844 crore reported. The gap probably reflects payments made in a different period, which I could not confirm. The special dividend of Rs 25 was stated as one-time, so it should not be treated as a regular payout.
See dividend tax in India for how dividends are taxed.
What drives P&G Hygiene’s Q2 numbers: volumes, costs and margin?
Four lines drive the quarter: revenue growth, the cost of materials and traded goods, the operating margin and other income. In Q1 FY27 revenue fell 4.86% while expenses rose 7.54%. In Q2 FY27 revenue was flat, raw and packing material rose 20.4% and advertising fell 5.3%.
| Driver | Q2 FY26 | Q1 FY27 | What the result showed |
|---|---|---|---|
| Revenue | Rs 1,150.17 crore | Rs 891.46 crore | Whether sales recovered |
| Net profit margin | 18.2% | 14.2% | Direction of the margin |
| Raw and packing materials | Not found | Rs 200.24 crore | Input cost trend |
| Purchases of stock-in-trade | Not found | Rs 213.23 crore | Traded goods cost |
| Operating margin | Not found | 19.11% | Recovery against 28.46% a year ago |
Cite this table: P&G Hygiene driver checklist, PositionalCalls; figures from the sources above.
| Driver | Q1 FY27 | Q2 FY27 | Change, my calculation |
|---|---|---|---|
| Raw and packing materials | Rs 200.24 crore | Rs 237.87 crore | +18.8% on Q1; +20.4% on Q2 FY26 |
| Purchases of traded goods | Rs 213.23 crore | Rs 237.52 crore | +11.4% on Q1; +12.2% on Q2 FY26 |
| Advertising and sales promotion | Rs 83.32 crore | Rs 166.62 crore | Nearly doubled on Q1; -5.3% on Q2 FY26 |
| Net profit margin | 14.2% | 17.1% | +2.9 points on Q1 |
| Revenue | Rs 891.46 crore | Rs 1,145.08 crore | +28.4% on Q1 |
Cite this table: P&G Hygiene Q2 FY27 cost drivers against Q1 FY27 per Free Press Journal and my earlier preview; calculations by PositionalCalls.
How did the actual P&G Hygiene results compare with the scenario tables?
Reported revenue of Rs 1,145 crore sits just below the flat row, and net profit of Rs 195.8 crore sits between the 14.16% and 18.25% margin columns, at a net margin of 17.1%. In the profit-level table it sits between the Rs 175 crore and Rs 209.86 crore rows. The tables were arithmetic illustrations, not forecasts.
| Revenue change on Q2 FY26 | Revenue, Rs crore | Profit at 14.16% margin | Profit at 18.25% margin |
|---|---|---|---|
| -10% | 1,035.2 | 146.6 | 188.9 |
| -4.86% (Q1 pace) | 1,094.3 | 154.9 | 199.7 |
| 0% | 1,150.2 | 162.9 | 209.9 |
| +5% | 1,207.7 | 171.0 | 220.4 |
Cite this table: P&G Hygiene Q2 FY27 arithmetic, my calculation. Base: Q2 FY26 revenue Rs 1,150.17 crore. Margins are Q1 FY27 and Q2 FY26 net margins. Not forecasts.
| Net profit level, Rs crore | Change vs Q2 FY26 base (209.86) | Change vs Q1 FY27 (126.27) |
|---|---|---|
| 110 | -47.6% | -12.9% |
| 126.27 | -39.8% | 0.0% |
| 150 | -28.5% | +18.8% |
| 175 | -16.6% | +38.6% |
| 209.86 | 0.0% | +66.2% |
Cite this table: P&G Hygiene Q2 FY27 profit arithmetic, my calculation. Levels are illustrations, not forecasts.
What did the filing answer? P&G Hygiene results-day decoder
On results day the reading order was: revenue against Rs 1,150.17 crore and Rs 891.46 crore, net profit against Rs 209.86 crore and Rs 126.27 crore, the margin, then costs and any dividend.
| Order | Line to read | Mark to compare | Why it comes first |
|---|---|---|---|
| 1 | Revenue from operations | Rs 1,150.17 crore; Rs 891.46 crore | Top-line trend |
| 2 | Net profit | Rs 209.86 crore; Rs 126.27 crore | The headline |
| 3 | Net profit margin | 18.2%; 14.2% | Cost and mix |
| 4 | Total expenses | Rs 731.26 crore in Q1 | Whether costs eased |
| 5 | Earnings per share | Rs 64.65; Rs 38.90 | Per-share view |
| 6 | Dividend | None mentioned | Check the filing |
Cite this table: P&G Hygiene results-day reading order, PositionalCalls.
| Decoder question | Answer from the reports (12 Nov 2026) | Status |
|---|---|---|
| Revenue above Rs 1,150.17 crore? | Rs 1,145.08 crore, -0.4% | Just below |
| Net profit above Rs 209.86 crore? | Rs 195.84 crore, -6.7% | No |
| Margin back to 18.2%? | About 17.1% net margin | Between Q1 and the base |
| Costs eased against Q1? | Raw material +18.8% on Q1; total expenses +23.1% on Q1 | No |
| Earnings per share? | Rs 60.33 against Rs 64.65 and Rs 38.90 | Between the two |
| Dividend? | No announcement found | Check the filing |
Cite this table: PositionalCalls, P&G Hygiene decoder answers, as of 12 November 2026; figures as reported, filing not opened.
Compare like with like: use revenue from operations against revenue from operations, and the same profit line on both sides.
How do I read the P&G Hygiene filing and avoid fake alerts?
To check the results, open the NSE or BSE announcement for Procter & Gamble Hygiene and Health Care, not a link in a message, and read the results table first. Treat any tip that asks for an OTP, payment or login as fake.
- Open the exchange announcement page for Procter & Gamble Hygiene and Health Care Limited.
- Read the unaudited results for the quarter ended 30 September 2026.
- Note revenue, expenses and profit.
- Compare with Rs 1,150.17 crore, Rs 281.78 crore and Rs 209.86 crore.
- Read the notes for any exceptional items.
- Check any dividend announcement.
PositionalCalls is not SEBI-registered, gives no buy or sell calls and never asks for payment. Nothing here is investment advice.
What do most people miss about the P&G Hygiene Q2 results date?
Around the P&G Hygiene Q2 results date, most readers see profit down 6.7% and miss that the first half is down 19.9%, that raw and packing material rose 20.4% on flat revenue, that other income cushioned profit and that no source reports EBITDA.
A last point on sources. Most figures here come from news summaries of the company’s filings, and definitions differ between them: net sales were Rs 889.92 crore in one report and revenue Rs 891.46 crore in another for Q1, and Investywise rounds the Q2 figures to Rs 1,145 crore and Rs 196 crore where Free Press Journal gives Rs 1,145.08 crore and Rs 195.84 crore. Before using any number from the P&G Hygiene Q2 results date in a decision, open the exchange filing, check the definition of each line and note the date of the report. I list each source with its time below so the comparison can be repeated, and the inputs for my own calculations are in the tables so the arithmetic can be checked line by line.
One more check on the P&G Hygiene Q2 results date numbers: the revenue and profit lines here are standalone figures, so they should not be compared with consolidated figures of other companies, and every percentage marked as my calculation can be rebuilt from the table inputs.
Bottom line
The P&G Hygiene Q2 results date was 12 November 2026. The company reported revenue of Rs 1,145.08 crore (-0.4%), profit before tax of Rs 262.02 crore (-7.0%) and net profit of Rs 195.84 crore (-6.7%), with first-half profit down 19.9% and no dividend found. There is no target or call here. See the full P&G Hygiene Q2 results FY27 analysis and our earnings coverage.
PositionalCalls WhatsApp channel
Never miss a results update
- Results dates and dividend dates
- Numbers explained without tips or targets
- Updated posts as they go live
P&G Hygiene Q2 results date: frequently asked questions
When was the P&G Hygiene Q2 results date?
The P&G Hygiene Q2 results date was Thursday, 12 November 2026, when the board met to approve results for the quarter and half-year ended 30 September 2026, per CompoundingAI. The first reports appeared at about 1:47 PM IST. I did not find the exact filing time; check the exchange announcement.
What was P&G Hygiene net profit in Q2 FY27?
Net profit was Rs 195.84 crore against Rs 209.86 crore a year earlier, down 6.7%, on revenue of Rs 1,145.08 crore, down 0.4%, per Free Press Journal. First-half profit was Rs 322.11 crore against Rs 401.92 crore, down 19.9%. These answer the P&G Hygiene Q2 results date comparison, but the filing is the reference.
Why did P&G Hygiene profit fall on flat revenue?
Raw and packing materials rose 20.4% to Rs 237.87 crore and total expenses rose about 2.5% while revenue fell 0.4%, per Free Press Journal and my calculation. Investywise cites commodity costs and the exchange rate, with a productivity programme as a partial offset. No EBITDA figure is reported.
What was the P&G Hygiene profit base for Q2 FY27?
The Q2 FY26 base was revenue of Rs 1,150.17 crore, up 1.32%, profit before tax of Rs 281.78 crore and net profit of Rs 209.86 crore, down 1%, with earnings per share of Rs 64.65, per Business Standard and Investywise. The Q2 FY27 changes tie to that base within rounding.
How did Q2 FY27 compare with Q1 FY27 for P&G Hygiene?
Revenue of Rs 1,145.08 crore was 28.4% above Q1 FY27’s Rs 891.46 crore, and net profit of Rs 195.84 crore was 55.1% above Rs 126.27 crore, my calculation. Advertising spend nearly doubled from Rs 83.32 crore to Rs 166.62 crore. The first half is still down 19.9% in profit.
Did P&G Hygiene declare a dividend with Q2 results?
I did not find a dividend announcement with the Q2 result. The record on this page is FY26 dividends of Rs 255 a share, a Rs 195 interim including a Rs 25 special and a Rs 60 final with record date 1 September 2026, per CompoundingAI. Check NSE and BSE announcements for any new dividend.
Did P&G Hygiene beat Q2 estimates?
I found no analyst estimate or consensus for the quarter, so I cannot say whether it beat or missed one. Compare the result with the Q2 FY26 base of Rs 1,150.17 crore revenue and Rs 209.86 crore profit instead, as the P&G Hygiene Q2 results date marks on this page do.
I did not find a dated post-result price or official close for 12 November 2026. The earlier preview recorded Rs 6,982 and a market capitalisation of Rs 22,664 crore, undated, from CompoundingAI. Check NSE or BSE for a quote. No brokerage target is used on this page.
Is Procter & Gamble Health the same as P&G Hygiene?
No. Procter & Gamble Hygiene and Health Care Limited and Procter & Gamble Health Limited are separate listed companies. Search results show the second also reported Q2 FY27 with profit up about 26%, but I did not open its results, and this page covers only P&G Hygiene and Health Care.
Is this financial advice about P&G Hygiene?
No. This page is not investment advice, a target or a recommendation, and PositionalCalls is not SEBI-registered. It reports company figures and sources with dates, and labels my calculations. Read the exchange filing and consult a registered adviser before any decision.
Sources
- Free Press Journal: P&G Hygiene Q2 profit falls 6.7%, 12 November 2026, updated 2:14 PM IST.
- Investywise: Procter & Gamble Hygiene and Health Care Q2 FY27 results, 12 November 2026, about 1:47 PM IST.
- PositionalCalls: P&G Hygiene Q2 results FY27 analysis
- NSE India: corporate announcements: where the results will appear.
- BSE India: corporate announcements: the results filing.
- CompoundingAI: P&G Hygiene Q2 FY27 preview: date, dividends and price.
- Free Press Journal: P&G Hygiene Q1 profit, July 2026.
- MarketsMOJO: P&G Hygiene Q1 FY27 margins, 2026.
- Business Standard: P&G Hygiene Q2 FY26, November 2025.
- InvestyWise: P&G Hygiene Q2 FY26 results, 6 November 2025.
Disclosure: PositionalCalls.com is not a SEBI-registered research analyst or investment adviser. Investments in securities markets are subject to market risks. Read all related documents carefully before investing. Returns are never guaranteed. PositionalCalls is an independent research and education site founded by Shubham Chaudhary. Nothing here is a recommendation, target or investment advice. How I researched this: for the P&G Hygiene Q2 results date I read Business Standard, Free Press Journal, MarketsMOJO, InvestyWise and CompoundingAI, noted where sources differ, and marked every derived number as my calculation. I did not open any company filing or exchange document. Figures are as of 12 November 2026, 4:20 PM IST.

Shubham Chaudhary is the founder of PositionalCalls, an independent Indian stock market research website. He writes company fundamentals, quarterly results analysis, IPO analysis and sector research for NSE and BSE listed companies, with a focus on banking stocks, insurance and long-term value investing. Every article is built from primary sources such as RBI, SEBI, NSE and BSE filings and company annual reports, and states its risks plainly in simple language for retail investors.
Coverage areas Our research standards- Numbers checked against NSE, BSE and SEBI filings
- Risks and limits stated in every article
- No paid promotions or broker tie-ups
- Articles updated when new filings arrive