
Results analysis · Telecom
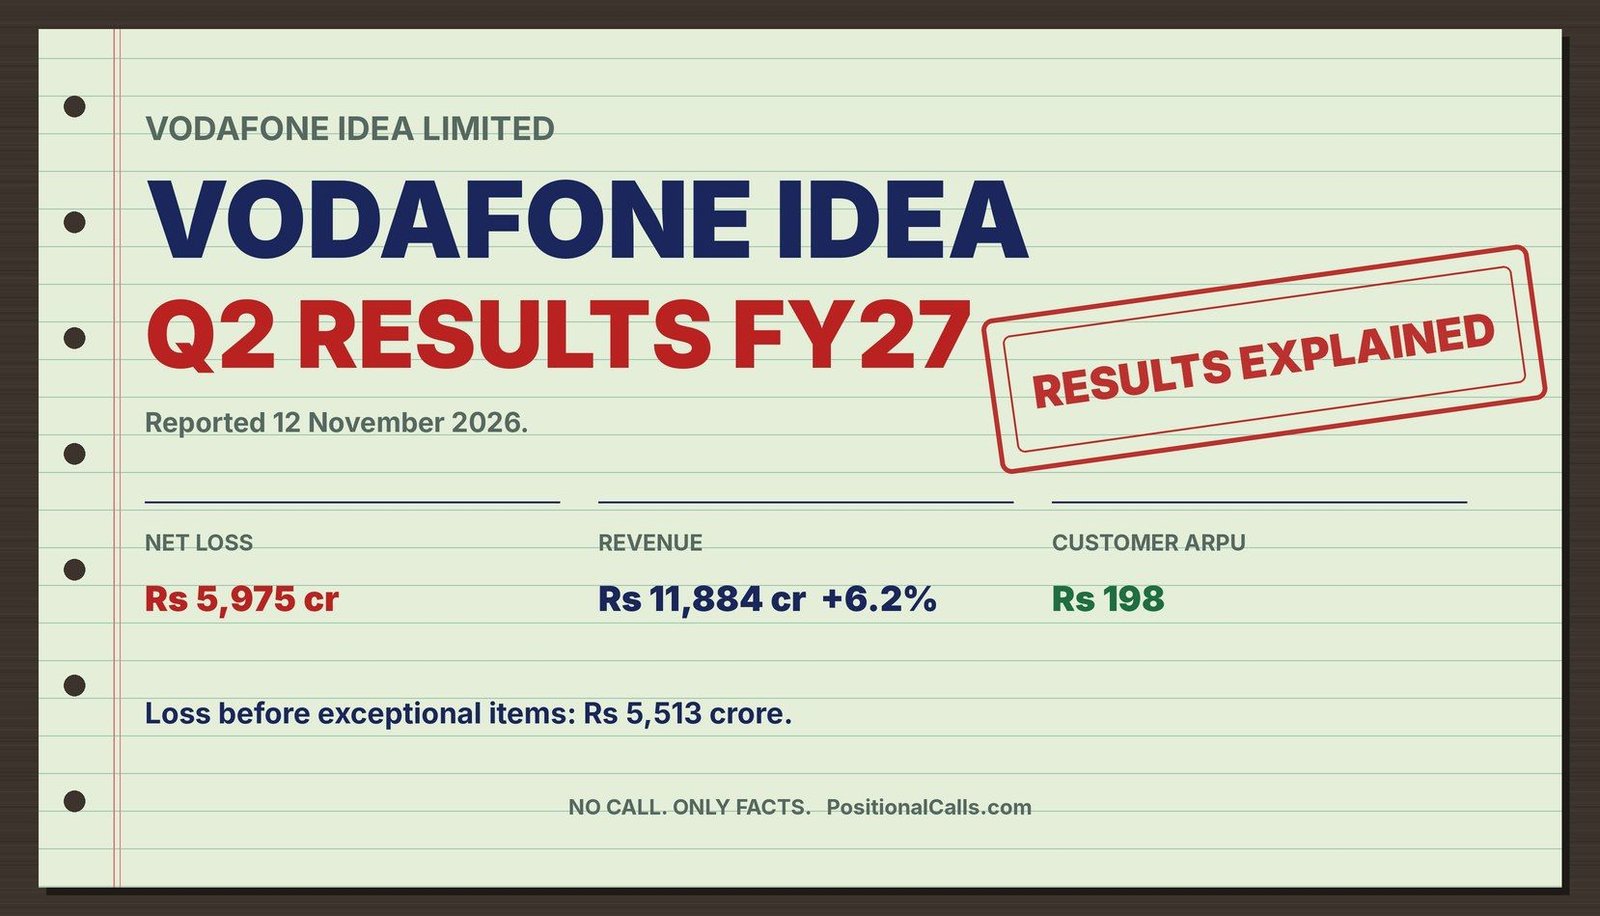
Looking for the Vodafone Idea Q2 results FY27? Vodafone Idea reported on 12 November 2026: revenue up 6.2%, EBITDA up 6.3% and customer ARPU of Rs 198, yet a net loss of Rs 5,975 crore. This page ties the numbers to the base and the previous quarter, shows why the loss looks bigger than the adjusted loss, and lists what to check in the filing.
Quick answer
Vodafone Idea Q2 results FY27: the consolidated net loss widened to Rs 5,975 crore from Rs 5,524 crore, while revenue rose 6.2% to Rs 11,884 crore and customer ARPU reached Rs 198, per Upstox and Kotak Neo. The loss before exceptional items was Rs 5,513 crore. No dividend. Reported 12 November 2026; no call here.
Latest update (Thursday, 12 November 2026, 9:10 PM IST): Vodafone Idea reported Q2 FY27 results on Thursday, 12 November 2026. The Upstox live blog carried the loss at 6:51 PM IST, revenue at 6:53 PM and ARPU at 6:56 PM, and Kotak Neo published the fuller set at 8:27 PM. I did not find net debt, AGR dues, a 4G or 5G subscriber split, an analyst estimate or a post-result price, and I have not opened the exchange filing.
Key takeaways
- Loss: consolidated net loss was Rs 5,975 crore against Rs 5,524 crore a year earlier, up 8.2%, and 59.2% above Q1 FY27’s Rs 3,754 crore (my calculation).
- Adjusted loss: before exceptional items the loss was Rs 5,513 crore against Rs 5,562 crore a year earlier, so the adjusted loss was about 0.9% lower (Kotak Neo; my calculation).
- Revenue: Rs 11,884 crore, up 6.2% from Rs 11,195 crore and 1.7% above Q1 FY27’s Rs 11,689 crore; the Upstox headline rounds the quarterly rise to 2%.
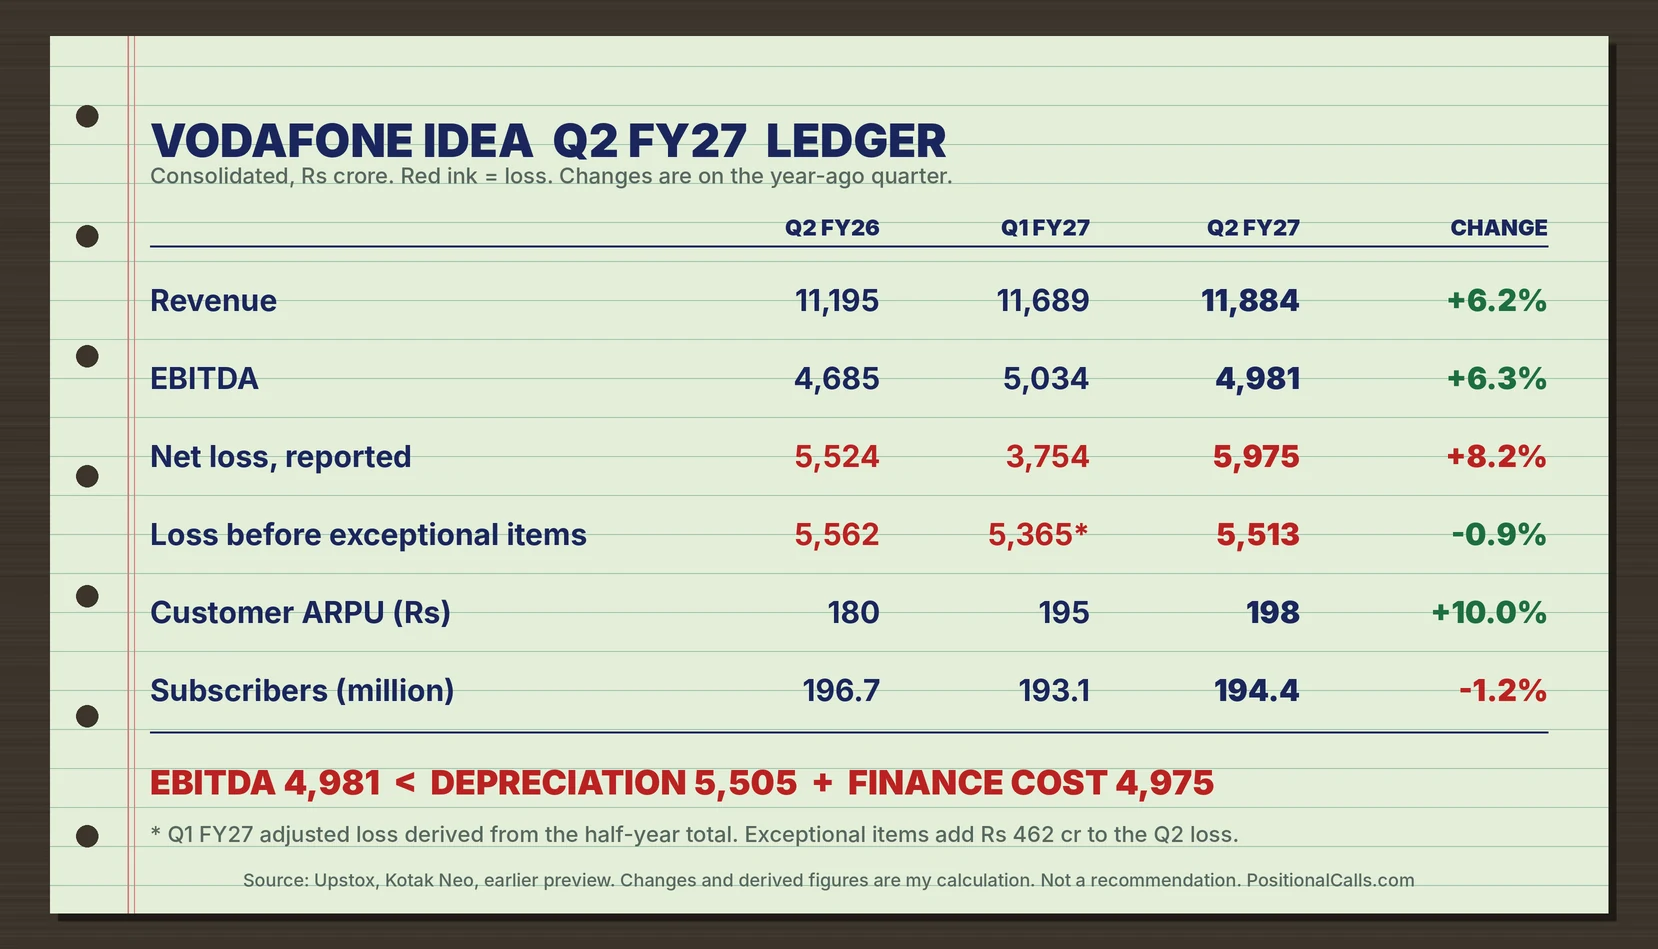
- EBITDA: Rs 4,981 crore at a 41.9% margin, down from 43.1% in Q1; depreciation of Rs 5,505 crore and finance cost of Rs 4,975 crore are both above it.
- Customers: customer ARPU of Rs 198 against Rs 195 in Q1 and Rs 180 a year earlier; subscribers 194.4 million against 193.1 million in Q1 and 196.7 million a year earlier.
- Still open: no net debt, AGR dues, 4G or 5G split, estimate or post-result price found; the filing is not opened.
In plain words: Vodafone Idea is a mobile operator that earns money from customers’ monthly plans, and ARPU is the average revenue it earns from each customer. It also carries large spectrum and licence-fee dues, so interest and depreciation can exceed what its operations earn, which is why it reports a loss even when revenue grows.
Data note: Figures are as of 12 November 2026, 9:10 PM IST. The loss, revenue and ARPU headlines come from the Upstox live blog, and the EBITDA, adjusted loss, subscribers, capex and half-year figures come from a Kotak Neo article that I read once. Earlier figures come from my Vodafone Idea preview, which used Business Today, Business Standard and Upstox. I could not open the exchange filings. Derived numbers are my calculation.
In this post
- What did Vodafone Idea report?
- What was the Q2 FY26 base?
- How does Q2 compare with Q1 FY27?
- Reported loss and adjusted loss
- From EBITDA to the loss
- ARPU, subscribers and capex
- What the reports do not show
- What does the first half show?
- What did the preview say?
- Price and estimates
- Coverage arithmetic
- Next-filing decoder
- How to read the filing
- What most people miss
- FAQs
- Sources
What did the company report in the Vodafone Idea Q2 results FY27, and how big was the change?
In the Vodafone Idea Q2 results FY27, the consolidated net loss was Rs 5,975 crore, against Rs 5,524 crore a year earlier, and revenue from operations was Rs 11,884 crore, up 6.2% from Rs 11,195 crore, per the Upstox live blog at 6:51 PM IST and Kotak Neo on 12 November 2026. Customer ARPU was Rs 198.
The results covered the quarter and half-year ended 30 September 2026. The Upstox items are stamped 6:51, 6:53 and 6:56 PM IST and the Kotak Neo article 8:27 PM, so the result came after the 3:30 PM close; I did not find the exact filing time. Companies must report within 45 days of the quarter-end, which made 14 November the limit, so this was day 43 (my calculation). Every number below is as reported by the sources named, and I have not opened the filing.
| Reported figures (quarter to 30 Sep 2026) | Q2 FY27 | Q2 FY26 | Change |
|---|---|---|---|
| Revenue from operations | Rs 11,884 crore | Rs 11,195 crore | +6.2% |
| EBITDA | Rs 4,981 crore | About Rs 4,685 crore | +6.3% |
| Net loss, reported | Rs 5,975 crore | Rs 5,524 crore | +8.2% wider (my calculation) |
| Net loss before exceptional items | Rs 5,513 crore | Rs 5,562 crore | -0.9% (my calculation) |
| Customer ARPU | Rs 198 | Rs 180 | +10.0% (my calculation) |
| Subscribers | 194.4 million | 196.7 million | -1.2% (my calculation) |
Cite this table: Vodafone Idea Q2 FY27 per Upstox live blog and Kotak Neo; Q2 FY26 per my earlier preview and Kotak Neo; derived changes calculated by PositionalCalls.
The growth rates check against their bases: Rs 11,195 crore multiplied by 1.062 is Rs 11,889 crore, within rounding of Rs 11,884 crore, and Rs 4,685 crore multiplied by 1.063 is Rs 4,980 crore (my calculation). The Upstox headline says revenue rose 2%, while its body says 1.7% on the quarter; arithmetic gives 1.67% on Rs 11,689 crore, so I use 1.7%. The Upstox item calls the loss consolidated and gives only quarter-on-quarter comparisons, and the year-on-year comparisons here come from Kotak Neo.
Is the Vodafone Idea Q2 results FY27 loss a consolidated figure?
Yes. The Upstox item calls it a consolidated net loss, and the base figures in my preview were consolidated too. I did not find standalone figures, so this page does not compare them. A year-on-year loss comparison from a single article should be checked against the filing, because the preview recorded a different base in one headline.
What was the Q2 FY26 base, and does it tie to the Vodafone Idea Q2 results FY27?
The base was revenue of about Rs 11,195 crore, EBITDA of about Rs 4,685 crore, a net loss of Rs 5,524 crore and customer ARPU of Rs 180, per my preview and Kotak Neo. The Q2 FY27 changes tie to that base, and Kotak Neo’s customer ARPU also explains a conflict in the preview.
| Q2 FY26 base | Figure | Q2 FY27 figure | Ties? |
|---|---|---|---|
| Revenue | Rs 11,190 to 11,195 crore | Rs 11,884 crore | Yes: +6.2% |
| EBITDA | Rs 4,685 to 4,690 crore | Rs 4,981 crore | Yes: +6.3% |
| Net loss | Rs 5,524 crore (headline Rs 5,584 crore in one report) | Rs 5,975 crore | Yes on Rs 5,524 crore: +8.2% |
| Customer ARPU | Rs 180 | Rs 198 | Yes: +10.0% |
| Blended ARPU | Rs 167 (Kotak Neo) | Rs 178 | Yes: +6.6% |
| Subscribers | 196.7 million | 194.4 million | Down 2.3 million |
Cite this table: Vodafone Idea Q2 FY26 base per my earlier preview, Business Standard, Business Today and Kotak Neo; ties calculated by PositionalCalls.
My preview showed Q2 FY26 ARPU as Rs 180 in one source and Rs 166 in another. Kotak Neo gives customer ARPU of Rs 180 and blended ARPU of Rs 167 for that quarter, which suggests the two figures were different definitions, not different values (my reading). The preview also showed the year-ago loss as Rs 5,524 crore in some reports and Rs 5,584 crore in a Business Standard headline; Kotak Neo’s Rs 5,524 crore ties to the Q2 FY27 comparison, so I use it.
How do the Vodafone Idea Q2 results FY27 compare with Q1 FY27?
Q2 FY27 revenue of Rs 11,884 crore was 1.7% above Q1 FY27’s Rs 11,689 crore, but EBITDA of Rs 4,981 crore was 1.1% below Rs 5,034 crore. The reported loss rose 59.2% from Rs 3,754 crore, while the loss before exceptional items rose only about 2.8% (my calculation).
| Sequential view | Q2 FY27 | Q1 FY27 | Change, my calculation |
|---|---|---|---|
| Revenue | Rs 11,884 crore | Rs 11,689 crore | +1.7% |
| EBITDA | Rs 4,981 crore | Rs 5,034 crore | -1.1% |
| EBITDA margin | 41.9% | 43.1% | -1.2 points |
| Operating expenditure | Rs 6,903 crore | Rs 6,655 crore (derived) | +3.7% |
| Net loss, reported | Rs 5,975 crore | Rs 3,754 crore | +59.2% |
| Net loss before exceptional items | Rs 5,513 crore | Rs 5,365 crore (derived) | +2.8% |
| Customer ARPU | Rs 198 | Rs 195 | +Rs 3 |
Cite this table: Vodafone Idea Q1 FY27 figures per my earlier preview; items marked derived are calculated by PositionalCalls by subtracting Q2 from the Kotak Neo half-year totals.
Revenue rose, but costs rose faster, so EBITDA slipped and the margin fell by 1.2 points (my calculation). The much larger rise in the reported loss comes mostly from Q1, not Q2: the Q1 loss of Rs 3,754 crore was flattered by an exceptional gain of about Rs 1,611 crore, which is covered in the next section. Customer ARPU rose by Rs 3; using the preview’s rule of thumb that Rs 1 of ARPU is about Rs 58 crore a quarter, that is about Rs 174 crore, in line with the Rs 195 crore rise in revenue (my calculation, rough).
Why is the reported loss different from the adjusted loss in the Vodafone Idea Q2 results FY27?
Kotak Neo gives a loss before exceptional items of Rs 5,513 crore for Q2 FY27, Rs 462 crore below the reported Rs 5,975 crore, and Rs 5,562 crore a year earlier. Q1 FY27’s adjusted loss works out near Rs 5,365 crore, so the reported Rs 3,754 crore had an exceptional gain of about Rs 1,611 crore.
| Loss measure (Rs crore) | Q2 FY27 | Q1 FY27 (derived) | Q2 FY26 |
|---|---|---|---|
| Reported net loss | 5,975 | 3,754 | 5,524 |
| Net loss before exceptional items | 5,513 | 5,365 | 5,562 |
| Exceptional effect on the loss | +462 (adds to loss) | -1,611 (reduces loss) | -38 (reduces loss) |
| Half-year reported loss | 9,729 | Sum of Q1 and Q2 | Not found |
| Half-year loss before exceptional items | 10,878 | Sum of Q1 and Q2 | Not found |
Cite this table: Vodafone Idea loss measures per Kotak Neo; Q1 FY27 adjusted loss derived by PositionalCalls as 10,878 less 5,513; exceptional effect is reported loss less adjusted loss.
The adjusted loss was Rs 5,513 crore in Q2 FY27 against Rs 5,562 crore a year earlier, so on that measure the loss was slightly smaller, while the reported loss was 8.2% larger (my calculation). Kotak Neo does not itemise the exceptional items, so I cannot say what they were or whether they will recur. Both measures matter, but they tell opposite stories for the year-on-year comparison, and the filing’s note on exceptional items will settle the detail.
How does EBITDA turn into the loss in the Vodafone Idea Q2 results FY27?
Revenue of Rs 11,884 crore less operating expenditure of Rs 6,903 crore gives EBITDA of Rs 4,981 crore. Depreciation of Rs 5,505 crore and finance cost of Rs 4,975 crore are both larger than EBITDA, which leaves a loss of about Rs 5,499 crore before exceptional and other items (my calculation).
| Bridge (Rs crore, my calculation) | Q2 FY27 | How it is built |
|---|---|---|
| Revenue from operations | 11,884 | Reported |
| Operating expenditure | 6,903 | Reported (Kotak Neo) |
| EBITDA | 4,981 | Revenue less expenditure; ties to the reported figure |
| Depreciation and amortisation | 5,505 | Reported (Kotak Neo) |
| Net interest and financing costs | 4,975 | Reported (Kotak Neo) |
| EBITDA less depreciation and finance cost | -5,499 | 4,981 – 5,505 – 4,975 |
| Reported net loss | -5,975 | Reported |
| Other items, net | -476 | Exceptional items of about 462 plus about 14 of other income, tax and other lines |
Cite this table: Vodafone Idea EBITDA-to-loss bridge calculated by PositionalCalls from Kotak Neo figures; the split of the other items is my inference.
The bridge ties to within Rs 14 crore: the loss before exceptional items of Rs 5,513 crore is within Rs 14 crore of the Rs 5,499 crore bridge result, and the remaining difference may be other income, tax or minority lines (my reading). Cash EBITDA, which excludes lease rentals, was Rs 2,498 crore, up 11.2%, with a margin of 21%. That is the figure that has to cover interest on borrowings, but the reports do not split the finance cost between lease interest, debt interest and spectrum dues.
What do ARPU, subscribers and capex show in the Vodafone Idea Q2 results FY27?
Customer ARPU was Rs 198, up Rs 3 on the quarter and 10.0% on the year, and subscribers were 194.4 million, up 1.3 million on Q1 but 2.3 million below a year earlier. Capex was Rs 3,946 crore, double Q1’s Rs 1,930 crore, with orders of over Rs 13,200 crore placed.
| Operating item | Q2 FY27 | Q1 FY27 | Q2 FY26 |
|---|---|---|---|
| Customer ARPU (excludes machine-to-machine) | Rs 198 | Rs 195 | Rs 180 |
| Blended ARPU | Rs 178 | Rs 177 | Rs 167 |
| Subscribers | 194.4 million | 193.1 million | 196.7 million |
| Capex in the quarter | Rs 3,946 crore | Rs 1,930 crore | Not found |
| Capex orders placed | Over Rs 13,200 crore | About Rs 9,000 crore | Not applicable |
| Cash EBITDA | Rs 2,498 crore (21%) | About Rs 2,475 crore (derived) | About Rs 2,246 crore (derived) |
Cite this table: Vodafone Idea operating items per Kotak Neo and my earlier preview; derived figures calculated by PositionalCalls.
PositionalCalls WhatsApp channel
The results, then the filing check
- The revenue, loss and ARPU lines as soon as they appear
- Reported against adjusted loss, explained
- Links to the updated page
Subscribers rose 1.3 million from Q1 but were 1.2% lower than a year earlier (my calculation), so the growth in revenue seems to have come from price and mix, not from more customers (my reading). The preview recorded a three-year capex plan of Rs 45,000 crore; Q1 and Q2 capex of Rs 1,930 crore and Rs 3,946 crore add to Rs 5,876 crore, about 13% of that plan, while orders placed were over Rs 13,200 crore (my calculation). The reports I read do not give a 4G or 5G split.
What do the reports not show about the Vodafone Idea Q2 results FY27?
The reports I read do not show net debt, AGR dues, the spectrum payment schedule, a 4G or 5G split, the itemised exceptional items, standalone results, a dividend or any analyst estimate. Each would help explain how the Rs 5,975 crore loss will be funded.
| Item missing from the reports | Why it matters | Last mark in my preview | Where to find it |
|---|---|---|---|
| Net debt | Funding burden | Not found | Filing and presentation |
| AGR dues | Large payable | Rs 64,046 crore after a 27% cut (Business Standard, 1 May 2026) | Notes to results |
| Spectrum dues | Cash due FY27 to FY29 | About Rs 49,000 crore (7,000, 15,000 and 27,000) | Notes to results |
| Exceptional items | Explains the gap of Rs 462 crore | Not found | Notes to results |
| 4G and 5G subscribers | Quality of the base | Q1 FY27 about 130.1 million (conflicting in one report) | Operating data |
| Funding for capex | Delivery of the plan | Rs 25,000 crore bank and Rs 10,000 crore non-funded | Management commentary |
Cite this table: Vodafone Idea items not found in Q2 FY27 reports; earlier marks per my preview; PositionalCalls.
These gaps matter because the loss of Rs 5,975 crore is a quarter’s worth of a larger funding question, and the answer sits in debt, dues and capex funding, not in revenue alone. The preview noted a gap of Rs 746 crore between the AGR total and the sum of its schedule; I did not find an update. I make no forecast of funding or of the dues.
What does the first half show in the Vodafone Idea Q2 results FY27?
Kotak Neo gives first-half revenue of Rs 23,573 crore, EBITDA of Rs 10,015 crore and a reported net loss of Rs 9,729 crore, or Rs 10,878 crore before exceptional items. The half-year figures tie to the sum of Q1 FY27 and Q2 FY27 (my calculation).
| First half (H1 FY27) | Figure | Check | Result |
|---|---|---|---|
| Revenue | Rs 23,573 crore | 11,689 + 11,884 | Ties |
| EBITDA | Rs 10,015 crore | 5,034 + 4,981 | Ties |
| Reported net loss | Rs 9,729 crore | 3,754 + 5,975 | Ties |
| Net loss before exceptional items | Rs 10,878 crore | Implies Q1 of 5,365 | Derived |
| Net interest and financing costs | Rs 9,900 crore | Implies Q1 of 4,925 | Derived |
| Cash EBITDA | Rs 4,973 crore | Implies Q1 of 2,475 | Derived |
Cite this table: Vodafone Idea H1 FY27 per Kotak Neo; checks and derived Q1 figures calculated by PositionalCalls.
The half-year loss before exceptional items of Rs 10,878 crore is 11.8% above the reported Rs 9,729 crore (my calculation), because Q1 carried the exceptional gain. A caution on the source: Kotak Neo’s image caption shows Rs 23,573 crore as quarterly revenue, but its text and the arithmetic show that it is the half-year total, so I use the text. The first-half year-ago comparisons were not found.
What did the preview say, and how did the Vodafone Idea Q2 results FY27 compare?
The Vodafone Idea Q2 results date FY27 preview named Q2 FY26 revenue of about Rs 11,190 crore and a loss of Rs 5,524 crore as the base, and Q1 FY27 revenue of Rs 11,689 crore and ARPU of Rs 195 as the sequential marks. Revenue and ARPU were above both marks, and the loss was above the base.
| Preview mark | Preview figure | Reported in Q2 FY27 | Outcome |
|---|---|---|---|
| Q2 FY26 revenue | Rs 11,190 crore | Rs 11,884 crore | Above, +6.2% |
| Q2 FY26 net loss | Rs 5,524 crore | Rs 5,975 crore | Wider, +8.2% |
| Q1 FY27 revenue | Rs 11,689 crore | Rs 11,884 crore | Above, +1.7% |
| Q1 FY27 net loss | Rs 3,754 crore | Rs 5,975 crore | Wider, +59.2% |
| Q1 FY27 ARPU | Rs 195 | Rs 198 | Higher, +Rs 3 |
| Q1 FY27 subscribers | 193.1 million | 194.4 million | Higher, +1.3 million |
| Q1 FY27 capex | Rs 1,930 crore | Rs 3,946 crore | Higher |
Cite this table: Preview marks against reported figures; outcomes calculated by PositionalCalls.
The preview set out the marks and gave no loss or revenue estimate, because none existed, and this page records the outcome without one. The Q1 FY27 loss of Rs 3,754 crore was the lowest mark in the preview, and Q2 returned to a level closer to the year-ago base once exceptional items are set aside.
Kotak Neo cites a close of Rs 12.97 on the NSE on 12 November 2026, up 0.70%, before the result was released. I found no post-result price and no analyst estimate. The first trading reaction would be the next session, Friday, 13 November 2026 (my reading from the timestamps).
| Item | Figure | Source and status |
|---|---|---|
| Close on 12 November 2026 | Rs 12.97, up 0.70% | Kotak Neo; not re-checked against an exchange quote |
| Earlier mark in my preview | Rs 11.51 on 22 October 2026 | Kotak Neo via my preview |
| Change between the two marks | +12.7% | My calculation |
| Share price after the result | Not found | No dated figure |
| Analyst consensus for Q2 | Not found | No estimate located |
| Brokerage targets | Not used | PositionalCalls does not use targets |
Cite this table: Vodafone Idea price and estimate items as of the time stated; not verified against filings.
Without an estimate I cannot say whether the result beat or missed expectations. The comparison that can be made from reported figures is against the base and the previous quarter, done above. For another telecom name in the same results season, see Airtel Q2 results FY27.
What does the coverage arithmetic show for the Vodafone Idea Q2 results FY27?
EBITDA of Rs 4,981 crore covers finance cost of Rs 4,975 crore about 1.0 times, but cash EBITDA of Rs 2,498 crore covers it about 0.5 times. Quarterly capex of Rs 3,946 crore was about 1.6 times cash EBITDA. These are ratios of reported figures, not a view on solvency.
| Coverage arithmetic (my calculation) | Figure | How it is built |
|---|---|---|
| EBITDA divided by finance cost | 1.00 times | 4,981 divided by 4,975 |
| Cash EBITDA divided by finance cost | 0.50 times | 2,498 divided by 4,975 |
| Depreciation above EBITDA | Rs 524 crore | 5,505 less 4,981 |
| Capex divided by cash EBITDA | 1.58 times | 3,946 divided by 2,498 |
| H1 capex divided by H1 cash EBITDA | 1.18 times | (1,930 + 3,946) divided by 4,973 |
| Loss per rupee of revenue | Rs 0.50 | 5,975 divided by 11,884 |
Cite this table: Vodafone Idea coverage ratios calculated by PositionalCalls from Kotak Neo and Upstox figures; mixed definitions, illustrations only.
Finance cost may include lease interest, and cash EBITDA excludes lease rentals, so the second ratio mixes definitions and is only an indication (my reading). A ratio does not show how dues or capex are funded, which the reports did not give; a ratio below one also does not say what the company will do. I show the arithmetic so a reader can repeat it with the filing’s figures.
How do I read the next Vodafone Idea results after the Vodafone Idea Q2 results FY27?
On the next results read, in this order: exceptional items, EBITDA against Rs 4,981 crore, customer ARPU against Rs 198, subscribers against 194.4 million, finance cost against Rs 4,975 crore, capex against Rs 3,946 crore and the loss before exceptional items against Rs 5,513 crore.
| Order | Line to read | Mark to compare | Why it comes first |
|---|---|---|---|
| 1 | Exceptional items | Rs 462 crore in Q2 FY27 | Gap between reported and adjusted loss |
| 2 | EBITDA and margin | Rs 4,981 crore; 41.9% | Operating strength |
| 3 | Customer ARPU | Rs 198 | Pricing |
| 4 | Subscribers | 194.4 million | Customer base |
| 5 | Finance cost and depreciation | Rs 4,975 crore; Rs 5,505 crore | Why the loss persists |
| 6 | Capex and funding | Rs 3,946 crore | Network plan |
| 7 | Loss before exceptional items | Rs 5,513 crore | Underlying loss |
Cite this table: Vodafone Idea reading order, PositionalCalls.
For any summary or target you read elsewhere, compare its assumptions with these lines: whether it uses the reported or the adjusted loss, how it treats finance cost and how it funds the capex plan. If it does not state them, you cannot check it.
How do I read the Vodafone Idea filing and avoid fake tips?
Open the NSE or BSE announcement for Vodafone Idea Limited, not a link in a message, and read the consolidated results with the notes on exceptional items. Treat any tip that asks for an OTP, payment or login, or promises a target, as fake.
- Open the exchange announcement page for Vodafone Idea Limited.
- Read the unaudited consolidated results for the quarter and half year ended 30 September 2026.
- Note revenue, operating expenditure, depreciation, finance cost, exceptional items and the loss.
- Compare with Rs 11,884 crore, Rs 4,981 crore, Rs 5,975 crore and Rs 5,513 crore.
- Read the notes on exceptional items, AGR dues, spectrum payments and going-concern comments.
- Read the investor presentation for ARPU, subscribers, capex and funding.
PositionalCalls is not SEBI-registered, gives no buy or sell calls and never asks for payment. Nothing here is investment advice.
What do most people miss in the Vodafone Idea Q2 results FY27?
Most readers see a bigger loss and miss that the loss before exceptional items was slightly lower than a year earlier, that Q1’s loss included an exceptional gain of about Rs 1,611 crore, that depreciation and finance cost both exceed EBITDA and that the reports give no net debt or dues.
Analyst’s note. What stands out: revenue, EBITDA and ARPU all rose year on year, yet the reported loss widened because of exceptional items and fixed costs below EBITDA (my reading). What is easy to miss: the sequential jump in the loss comes from Q1’s exceptional gain. What would change the view: a filing that itemises the exceptional items or gives net debt. Caution: the figures come from news reports and I did not open the filing. Reader action: read the exceptional items and the finance cost first.
Bottom line
The result shows a net loss of Rs 5,975 crore (Rs 5,513 crore before exceptional items), revenue of Rs 11,884 crore (+6.2%), EBITDA of Rs 4,981 crore and customer ARPU of Rs 198, with no dividend. There is no target or call on this page. I will update it when the filing is read. See our earnings coverage.
PositionalCalls WhatsApp channel
Never miss an update
- Results dates and subscriber updates
- Numbers explained without tips or targets
- Updated posts as they go live
Vodafone Idea Q2 results FY27: frequently asked questions
What did the company report in the Vodafone Idea Q2 results FY27?
In the Vodafone Idea Q2 results FY27, the consolidated net loss was Rs 5,975 crore against Rs 5,524 crore a year earlier, and revenue was Rs 11,884 crore, up 6.2%, reported on 12 November 2026. Customer ARPU was Rs 198. Figures are from Upstox and Kotak Neo; check the filing.
What was the Vodafone Idea net loss in Q2 FY27?
The consolidated net loss was Rs 5,975 crore, against Rs 5,524 crore in Q2 FY26 and Rs 3,754 crore in Q1 FY27. Before exceptional items the loss was Rs 5,513 crore, against Rs 5,562 crore a year earlier, per Kotak Neo. The exceptional items were not itemised in the reports I read.
What was Vodafone Idea revenue in Q2 FY27?
Revenue from operations was Rs 11,884 crore, up 6.2% from Rs 11,195 crore a year earlier, per Kotak Neo, and up 1.7% from Rs 11,689 crore in Q1 FY27, per Upstox. The Upstox headline rounds the quarterly rise to 2%. EBITDA was Rs 4,981 crore at a margin of 41.9%.
What was Vodafone Idea ARPU in Q2 FY27?
Customer ARPU, which excludes machine-to-machine connections, was Rs 198, against Rs 195 in Q1 FY27 and Rs 180 a year earlier, per Kotak Neo. Blended ARPU was Rs 178 against Rs 167 a year earlier. Subscribers were 194.4 million, 1.3 million above Q1 but 2.3 million below Q2 FY26.
Why did Vodafone Idea report a loss despite higher revenue?
Depreciation of Rs 5,505 crore and finance cost of Rs 4,975 crore are both larger than EBITDA of Rs 4,981 crore, per Kotak Neo, so the operating profit does not cover them (my calculation). In the Vodafone Idea Q2 results FY27, exceptional items added about Rs 462 crore to the reported loss.
Did Vodafone Idea declare a dividend with Q2 results?
I found no dividend in the reports of the Vodafone Idea Q2 results FY27, and the company reported a net loss of Rs 5,975 crore. Check the board outcome on NSE or BSE for any announcement. PositionalCalls reports only what filings and news sources show.
Did Vodafone Idea beat Q2 estimates?
I found no analyst estimate or consensus for the quarter, so I cannot say whether it beat or missed one. Compare the result with the year-ago base of Rs 11,195 crore revenue and Rs 5,524 crore loss, and with Q1 FY27, as the tables on this page do.
I did not find a dated post-result price. Kotak Neo cites a close of Rs 12.97 on the NSE on 12 November 2026, up 0.70%, before the result, which came after the 3:30 PM close, so the first reaction would be the next session, my reading. No brokerage target is used.
Why do the Vodafone Idea Q2 results FY27 sources conflict?
The Upstox headline says revenue rose 2%, while its body says 1.7%. Kotak Neo’s image caption shows Rs 23,573 crore as quarterly revenue, but its text and the arithmetic show it is the half-year total. A Business Standard headline gave the year-ago loss as Rs 5,584 crore against Rs 5,524 crore elsewhere.
Is this page financial advice about Vodafone Idea?
No. This page is not investment advice, a target or a recommendation, and PositionalCalls is not SEBI-registered. It reports company figures and sources with dates, and labels my calculations. Read the exchange filing and consult a registered adviser before any decision.
Sources
- NSE India: corporate announcements: results notices.
- BSE India: corporate announcements: the results filing.
- Upstox: Q2 results live blog, Vodafone Idea entries, 12 November 2026, 6:51 to 6:56 PM IST.
- Kotak Neo: Vodafone Idea Q2 FY27 results, 12 November 2026, 8:27 PM IST.
- PositionalCalls: Vodafone Idea Q2 results date FY27 preview, 11 November 2026.
Disclosure: PositionalCalls.com is not a SEBI-registered research analyst or investment adviser. Investments in securities markets are subject to market risks. Read all related documents carefully before investing. Returns are never guaranteed. PositionalCalls is an independent research and education site founded by Shubham Chaudhary. Nothing here is a recommendation, target or investment advice. How I researched this: for this page on the Vodafone Idea Q2 results FY27 I read the Upstox live blog and Kotak Neo, noted where sources differ, and marked every derived number as my calculation. I did not open any company filing or exchange document. Figures are as of 12 November 2026, 9:10 PM IST.

Shubham Chaudhary is the founder of PositionalCalls, an independent Indian stock market research website. He writes company fundamentals, quarterly results analysis, IPO analysis and sector research for NSE and BSE listed companies, with a focus on banking stocks, insurance and long-term value investing. Every article is built from primary sources such as RBI, SEBI, NSE and BSE filings and company annual reports, and states its risks plainly in simple language for retail investors.
Coverage areas Our research standards- Numbers checked against NSE, BSE and SEBI filings
- Risks and limits stated in every article
- No paid promotions or broker tie-ups
- Articles updated when new filings arrive