
Earnings · Tata Motors Passenger Vehicles
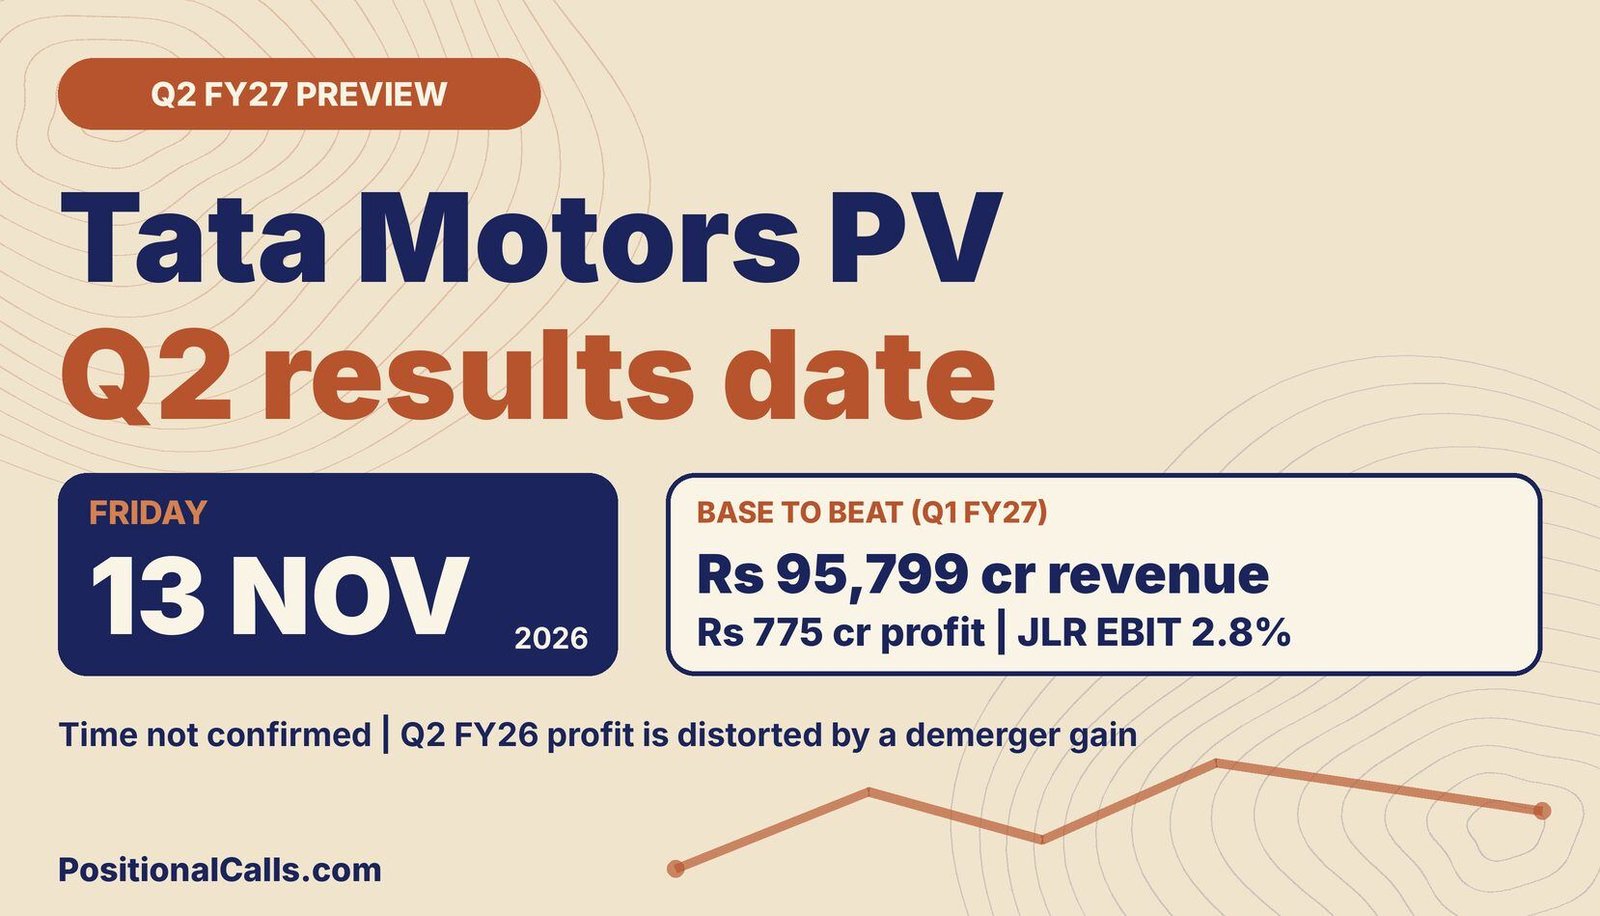
The Tata Motors PV Q2 results date is Friday, 13 November 2026. Here is the time question, the year-ago base that distorts every comparison, the JLR and India volumes already public, and the marks to read first when the numbers arrive.
Quick answer
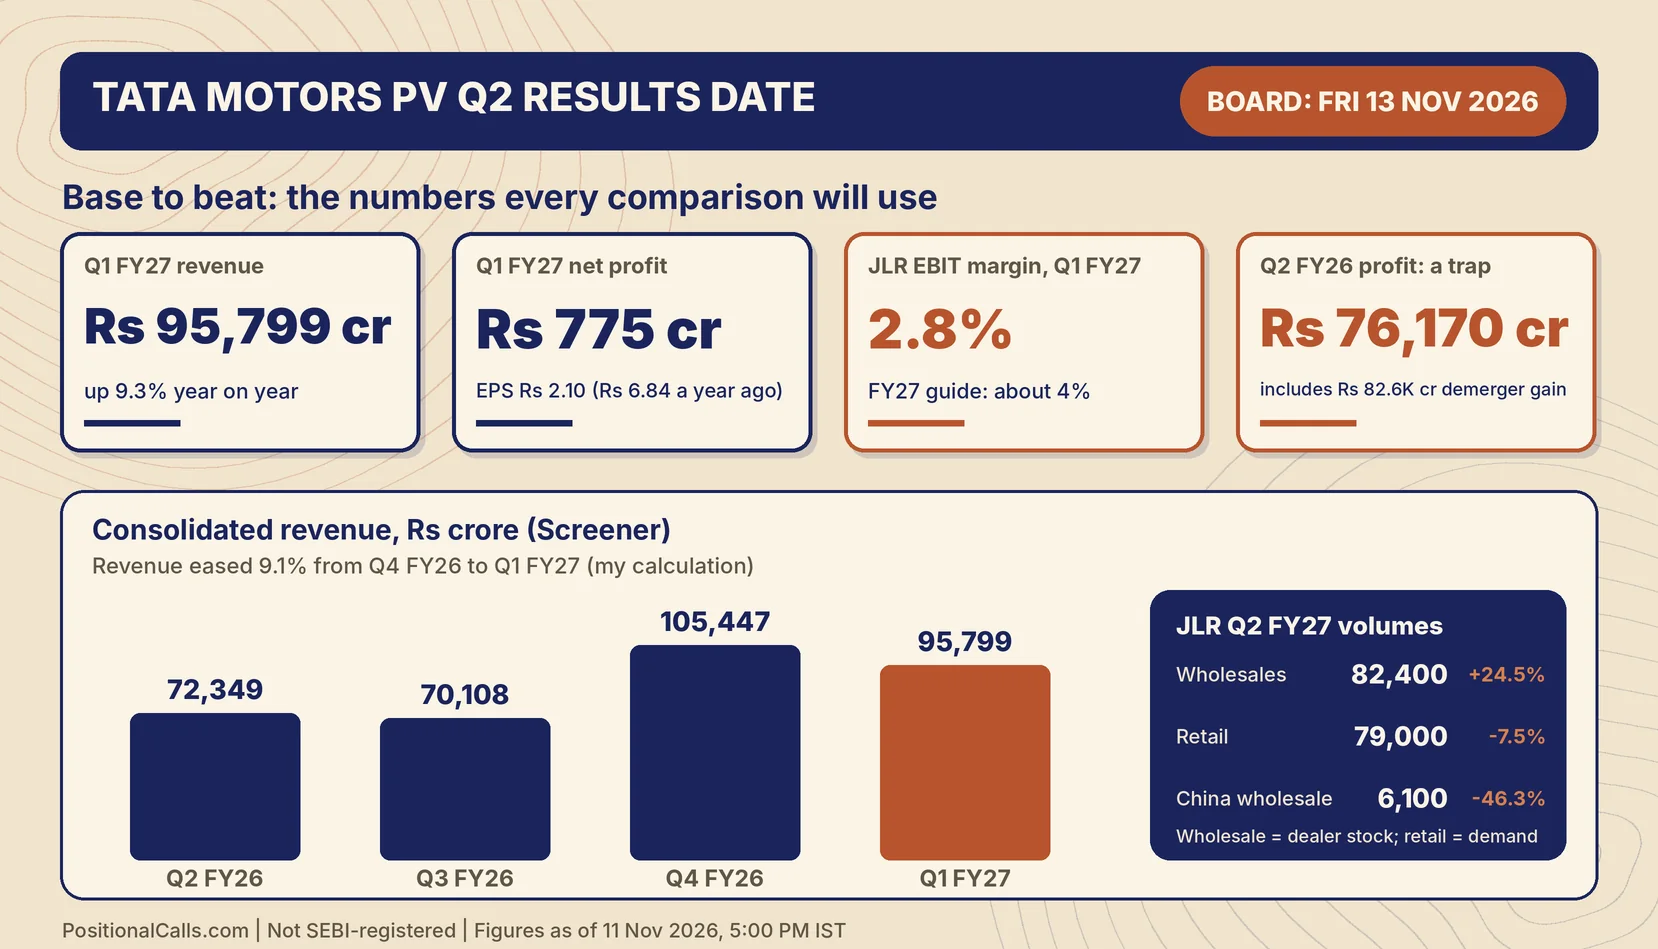
Tata Motors PV Q2 results date is Friday, 13 November 2026, when the board meets to consider results for the quarter ended 30 September 2026, per the NSE event calendar. The base to beat is Q1 FY27: revenue Rs 95,799 crore and net profit Rs 775 crore. The announcement time is not confirmed.
Latest update (Wednesday, 11 November 2026, 5:00 PM IST): I found no change to the 13 November board date. I found no analyst consensus for Q2 and no announcement time, so neither is shown. JLR and India sales for the quarter were published in early October and are in the tables below. This post will be updated after the results.
Key takeaways
- Date: the board meets on Friday, 13 November 2026 (NSE calendar via EconoTimes, 31 October 2026); Upstox lists the same day. The time is not confirmed.
- Base to beat: Q1 FY27 revenue Rs 95,799 crore and net profit Rs 775 crore; Q2 FY26 revenue Rs 72,349 crore.
- Trap: Q2 FY26 net profit of Rs 76,170 crore includes a notional Rs 82.6K crore demerger gain, so year-on-year profit growth is meaningless.
- JLR volumes: wholesales 82,400 (+24.5%) but retail 79,000 (about -7.5%, my calculation); China wholesales roughly halved.
- India: domestic sales 196,674 (+40.3%, my calculation) and EV sales 47,150 (+90%) in the quarter.
- Guidance mark: JLR guided an FY27 EBIT margin of about 4% on about GBP 26 billion of revenue; its Q1 FY27 EBIT margin was 2.8%.
In plain words: Tata Motors Passenger Vehicles makes Tata and EV cars in India and owns Jaguar Land Rover (JLR), the British luxury carmaker. JLR is most of the revenue and most of the swing in profit. The Q2 FY26 base was distorted by a cyber attack and a one-off accounting gain, so the cleaner yardstick is the previous quarter, Q1 FY27.
Data note: Figures are as of 11 November 2026, 5:00 PM IST. They follow EconoTimes (NSE calendar), the company press release of 14 November 2025, Business Today, Kotak Neo, Free Press Journal, ChinaPulse, Autocar Professional, Multibagg, Upstox, DriveSpark and the Screener page. I could not open the company’s Q1 FY27 press release or any exchange filing, so Q1 figures are headline-level. Derived numbers are my calculation. I found no analyst consensus for Q2.
In this post
When is the Tata Motors PV Q2 results date, and at what time will it be announced?
The Tata Motors PV Q2 results date is Friday, 13 November 2026: the board of Tata Motors Passenger Vehicles Limited (TMPV) is scheduled to consider results for the quarter ended 30 September 2026, per the NSE event calendar. The time of announcement is not confirmed.
EconoTimes, reporting the NSE calendar on 31 October 2026, says the board will consider the Q2 FY27 results on 13 November. It adds that the calendar does not say the results will be published that day. Upstox’s weekly list, last updated on 8 November 2026, also places TMPV on 13 November, alongside Eicher Motors, Grasim and Rail Vikas Nigam. Two sources agree on the day; neither gives a time.
Tata Motors PV Q2 results date: what each source says
| Item | What was reported | Source and date | Status |
|---|---|---|---|
| Board meeting day | 13 November 2026 | NSE calendar via EconoTimes, 31 Oct 2026 | Confirmed by two sources |
| Week list | TMPV listed on 13 November | Upstox, updated 8 Nov 2026 | Second source for the day |
| Publication time | Not stated | EconoTimes, 31 Oct 2026 | Not confirmed |
| Earnings call | Not found | None | Not confirmed |
| Quarter end | 30 September 2026 | EconoTimes | Confirmed |
| Filing deadline | 14 November 2026 | My calculation: 30 Sep plus 45 days | Legal limit, not the planned date |
Cite this table: Tata Motors PV Q2 results date and time status, as of 11 November 2026, 5:00 PM IST, PositionalCalls.
A date from an exchange calendar is a planned board meeting, not a release, and boards can move meetings. The reliable check is the company’s own intimation on the BSE or NSE announcement page, which is the document that also carries the results once approved.
Why last year’s timing is only a loose guide to the Tata Motors PV Q2 results date
The Q2 FY26 results came with a press release dated 14 November 2025, a Friday, and the shares settled 1.62% lower at Rs 391.60 that day (Business Today, 14 November 2025). That was TMPV’s first set of results after the commercial-vehicle business was demerged. The company has since reported Q3 and Q4 FY26 and Q1 FY27, so the calendar for 13 November is the better guide than last year’s date.
What is the profit and revenue base Tata Motors PV has to beat in Q2 FY27?
The cleanest base to beat is Q1 FY27: consolidated revenue of Rs 95,799 crore and net profit of Rs 775 crore, with EPS of Rs 2.10. The year-ago Q2 FY26 revenue was Rs 72,349 crore, but its profit is distorted by a one-time demerger gain.
| Consolidated, Rs crore | Q2 FY26 (14 Nov 2025) | Q1 FY27 (Aug 2026) | What to compare |
|---|---|---|---|
| Revenue | 72,349 (down 13.5% on 83,656) | 95,799 (up 9.3%) | Q2 FY27 above 95,799 means a sequential rise (my calculation: Q1 is +32.4% on Q2 FY26) |
| Net profit as reported | 76,170 (attributable) | 775 | Do not use 76,170 as a growth base |
| Net profit excluding demerger gain | About -6,400 (my calculation: 76,170 minus 82,600) | 775 | The real year-ago base is a loss |
| PBT before exceptional items | About -5,500 | Not found | Q1 figure not in the pages I opened |
| EBIT | About -4,900 | Not found | Company rounds to Rs K crore |
| Exceptional items, Q1 only | Not disclosed in release | Loss of 32 (vs 47 in Q1 FY26) | Small this quarter |
| EPS, Rs | 206.85 (Screener, includes gain) | 2.10 (vs 6.84) | EPS base is also distorted |
Cite this table: Tata Motors PV consolidated base to beat, company press release 14 Nov 2025; Kotak Neo and Screener, as of 11 November 2026, 5:00 PM IST.
The Q2 FY26 profit of Rs 76,170 crore is larger than the quarter’s revenue of Rs 72,349 crore. That is not an operating result. The company’s release shows a notional profit of about Rs 82.6K crore on the disposal of the discontinued commercial-vehicle operations, so the figure measures an accounting event, not trading. Strip it out and the quarter was a loss of roughly Rs 6,400 crore (my calculation, rounded from the company’s own Rs K crore figures).
Tata Motors PV Q2 results date base: four quarters of consolidated numbers
| Quarter | Revenue, Rs crore | Operating profit, Rs crore | OPM | Net profit, Rs crore |
|---|---|---|---|---|
| Q2 FY26 (Sep 2025) | 72,349 | -1,404 | -1.9% | 76,248 |
| Q3 FY26 (Dec 2025) | 70,108 | 879 | 1.2% | -3,483 |
| Q4 FY26 (Mar 2026) | 1,05,447 | 11,259 | 11% | 5,878 |
| Q1 FY27 (Jun 2026) | 95,799 | 6,176 | 6% | 859 |
Cite this table: Tata Motors PV quarterly consolidated results as displayed by Screener, as of 11 November 2026, 5:00 PM IST. Net profit there is a different line from the Rs 775 crore reported by Kotak Neo.
The table is the one to keep open on results day. Revenue peaked in the March quarter at Rs 1,05,447 crore and eased 9.1% in the June quarter (my calculation). The operating margin followed: about 11% in March, about 6% in June. The question for Q2 is whether it steadies or keeps falling.
JLR and India base: the two engines behind the Tata Motors PV Q2 results date
| Segment base | Q2 FY26 | Q1 FY27 | Source |
|---|---|---|---|
| JLR revenue | GBP 4.9 bn (down 24.3%) | GBP 6.0 bn (down 9.6%) | Company releases; Q1 headline only |
| JLR EBIT margin | -8.6% | 2.8% | Company releases; Q1 headline only |
| JLR loss before tax and exceptional items | GBP (485) mn | Profit GBP 66 mn (basis not stated) | Company; Kotak Neo |
| JLR free cash flow | GBP (791) mn outflow | Not found | Company, 14 Nov 2025 |
| India PV revenue | Rs 13.5K crore (+15.6%) | +64.8% year on year | Company; Kotak Neo |
| India PV EBITDA / EBIT margin | 5.8% / 0.2% | Not found | Company, 14 Nov 2025 |
| Net automotive debt | Rs 20.1K crore | Not found | Company, 14 Nov 2025 |
Cite this table: Tata Motors PV segment base, company press release 14 Nov 2025 and Kotak Neo, as of 11 November 2026, 5:00 PM IST.
Which Tata Motors PV figures are the right ones to compare on results day?
Compare Q2 FY27 with Q1 FY27 first, and use Q2 FY26 only for revenue and for JLR. Use net profit attributable to owners, not total profit, and expect the EBITDA margin to differ between the company, Screener and news reports.
Three conflicts already exist in the numbers. They are shown here, not resolved.
| Item | Figure A | Figure B | How to read it |
|---|---|---|---|
| Q1 FY27 net profit | Rs 775 crore (Kotak Neo; Outlook Business) | Rs 859 crore (Screener) | Likely different lines, owners versus total; I have not confirmed which |
| Q1 FY27 EBITDA margin | 7.4%, down 130 bps (Kotak Neo; Asianet) | 6% operating margin, Rs 6,176 crore (Screener) | Screener operating profit divided by revenue is 6.4% (my calculation) |
| Q2 FY26 net profit | Rs 76,170 crore (company, Business Today) | Rs 76,248 crore (Screener) | A Rs 78 crore gap (my calculation); both carry the gain |
Cite this table: Tata Motors PV figure conflicts, as of 11 November 2026, 5:00 PM IST.
The definitions trap is simple. EBITDA, operating profit and EBIT are three different lines, and a news report may quote any of them as the margin. Net profit can mean profit attributable to owners or profit including minority interests. Revenue can mean revenue from operations or total income. When the Tata Motors PV Q2 results date arrives, check the label next to each number before comparing it with the base.
The entity is the second trap. After the demerger, Tata Motors Limited is the commercial-vehicle company and Tata Motors Passenger Vehicles Limited is the car and JLR company. Our Tata Motors Q2 results FY27 page covers the commercial-vehicle company only, which reported on Friday, 23 October 2026. It does not cover TMPV.
What do analysts expect from Tata Motors PV in Q2 FY27?
I found no published analyst consensus for Tata Motors PV Q2 FY27, so this post does not show one. What does exist is the company-level guidance JLR gave on 17 June 2026 and the brokerage reactions to it, as reported.
Searches returned old previews and the FY27 guidance stories, but no sourced revenue or profit forecast for 13 November. A number without a source would be a guess, so the table below sticks to guidance and reported broker views.
| Guidance item | FY27 guide (JLR investor day, 17 Jun 2026) | FY26 comparison | Source |
|---|---|---|---|
| Revenue | About GBP 26 bn | GBP 23 bn (+13.0%, my calculation) | Upstox, 18 Jun 2026 |
| EBIT margin | About 4% | Above 0% | Upstox; Multibagg |
| Investment | About GBP 3.7 bn | GBP 3.6 bn | Upstox |
| Operating cash flow | Break-even | Negative GBP 2.3 bn | Upstox; Multibagg |
| Implied EBIT | GBP 1,040 mn (4% of 26 bn, my calculation) | Not applicable | Matches Morgan Stanley’s quoted target |
Cite this table: JLR FY27 guidance as reported, Upstox and Multibagg, 18 June 2026.
Brokerage views on the guidance, as reported
| Broker | What was reported | Source and date | Note |
|---|---|---|---|
| Morgan Stanley | Revenue guide about 5% above its estimate; margin below its 4.6%; break-even FCF versus its positive GBP 400 mn | Upstox, 18 Jun 2026 | Rating not given in the page |
| Nomura | Guidance slightly below its estimates; valuation seen as undemanding at 3.5x FY28F EV/EBITDA, balanced by risk | Upstox; Multibagg (Neutral), 18 Jun 2026 | Reported, not my view |
| Jefferies | Revenue and margin in line; flagged warranty costs at 6.6% of revenue and depreciation at an 11-year low | Upstox; Multibagg, 18 Jun 2026 | Earnings-quality flags |
| Citi | Sell, target Rs 320; called the guidance conservative | Multibagg, 18 Jun 2026 | Single source |
Cite this table: Brokerage commentary on JLR FY27 guidance as reported, 18 June 2026. PositionalCalls shows no target and gives no rating of its own.
These are June views, formed before the Q2 sales data. They show how analysts framed the year, not what they expect for 13 November. The shares fell as much as 10% to Rs 355 on the guidance day and closed about 8% lower (Multibagg, 18 June 2026), which shows how sensitive the stock is to the JLR margin.
PositionalCalls WhatsApp channel
Tata Motors PV results, then the next auto filing
- The filing and the JLR margin as soon as they appear
- Base-versus-actual checks in plain words
- Links to every updated Q2 FY27 page
One useful mark follows from the guidance. A 4% EBIT margin on GBP 26 billion is GBP 1,040 million for the year (my calculation). Q1 FY27 delivered a 2.8% margin on GBP 6.0 billion, about GBP 168 million (my calculation), so the remaining three quarters need about 4.4% on average to reach the guide.
What drives the Tata Motors PV quarter: JLR volumes, India sales and EVs?
JLR volumes drive most of the swing, and the public data is mixed: wholesales rose 24.5% to 82,400 but retail fell about 7.5% to 79,000. In India, domestic sales rose about 40% to 196,674 and EV sales rose about 90% to 47,150.
JLR: wholesales up, retail down, China halved
JLR announced its Q2 FY27 volumes on Saturday, 3 October 2026 (Free Press Journal). Wholesales, the cars sold to dealers, are what feed revenue. Retail, the cars sold to customers, shows real demand. A 3,400-unit gap between wholesale and retail (my calculation) means dealers took more cars than customers bought, which flatters the quarter’s revenue if it is not repeated.
| JLR units | Q2 FY27 | Q2 FY26 | Change (my calculation) |
|---|---|---|---|
| Wholesales, total | 82,400 | 66,165 | +24.5% |
| Wholesales, UK | 21,000 | 12,327 | +70.4% |
| Wholesales, North America | 27,100 | 17,879 | +51.6% |
| Wholesales, Europe | 13,200 | 10,491 | +25.8% |
| Wholesales, China (single source) | 6,100 | 11,370 | -46.3% |
| Retail, total | 79,000 | 85,371 | -7.5% |
| Retail, China | 6,300 | 10,604 | -40.6% |
Cite this table: JLR Q2 FY27 volumes, Free Press Journal and ChinaPulse, 3 and 6 October 2026.
The year-ago wholesale base of 66,165 was depressed by the cyber incident that hit JLR in Q2 FY26, so a 24.5% rise partly measures recovery, not new demand. ChinaPulse attributes the China fall to the end of local CJLR production in June 2026. The Range Rover, Range Rover Sport and Defender family was 77.6% of wholesales against 76.7% a year earlier (Free Press Journal), which supports the margin mix.
India: the other engine behind the Tata Motors PV Q2 results date
Tata Motors PV reported domestic sales of 196,674 units in July to September 2026 against 140,189 a year earlier, a rise of about 40.3% (Autocar Professional, 1 October 2026). Including exports the total was 201,723 units. EV sales were 47,150 against 24,855, up about 89.7% (my calculation), and the company put the EV share at 23%.
| India units | Q2 FY27 | Year earlier | Change (my calculation) |
|---|---|---|---|
| Domestic passenger vehicles | 196,674 | 140,189 | +40.3% |
| Total including exports | 201,723 | Not found | Exports about 5,049 |
| Electric vehicles | 47,150 | 24,855 | +89.7% |
| EV share of domestic | 24.0% (company says 23%) | 17.7% | Company figure likely uses total sales |
| October 2026 domestic | 73,894 | 61,134 | +20.9% |
| October 2026 EVs | 16,244 | 9,286 | +74.9% |
Cite this table: Tata Motors PV India sales, Autocar Professional (1 Oct 2026) and DriveSpark (1 Nov 2026).
October’s sales belong to Q3, not the quarter being reported, but they show whether the Q2 run-rate held. October domestic sales of 73,894 were about 20.9% higher than a year earlier, slower than the 40% of Q2, which fits a tougher base after the GST-cut recovery (my reading, not a company statement).
Margin levers to watch
- JLR mix and pricing: the luxury family’s share is the first lever; Kotak Neo reports Q1 retail VME (variable marketing expense, a measure of incentives) at 7.1% against 4.1% a year earlier, a headwind to watch.
- Warranty and depreciation: Jefferies flagged warranty costs at 6.6% of revenue and depreciation at an 11-year low in June.
- China: local production ended in June 2026, so the second half carries a smaller China business than the base.
What would different Tata Motors PV Q2 outcomes look like in numbers?
The tables below are arithmetic on public figures, not forecasts: they show what revenue, JLR EBIT and EBITDA would be at a few illustrative levels, and what each means against the base.
| Illustrative revenue, Rs crore | Versus Q1 FY27 (95,799) | Versus Q2 FY26 (72,349) |
|---|---|---|
| 91,009 | -5% | +25.8% |
| 95,799 | Flat | +32.4% |
| 1,00,589 | +5% | +39.0% |
| 1,05,447 | Equal to Q4 FY26 | +45.8% |
Cite this table: Tata Motors PV revenue sensitivity, my calculation from the published base. Not an estimate.
| Illustrative EBITDA margin | EBITDA on Rs 95,799 crore revenue | Meaning |
|---|---|---|
| 6.0% | Rs 5,748 crore | Near the Q1 operating margin on Screener |
| 7.4% | Rs 7,089 crore | Matches the Q1 EBITDA margin reported by Kotak Neo |
| 8.0% | Rs 7,664 crore | Margin recovery |
| 9.0% | Rs 8,622 crore | Strong recovery |
Cite this table: Tata Motors PV EBITDA arithmetic at Q1 revenue, my calculation. Not an estimate.
| Illustrative JLR EBIT margin | EBIT on GBP 6.0 bn revenue | Meaning |
|---|---|---|
| 0% | GBP 0 | Break-even |
| 2.8% | GBP 168 million | Same as Q1 FY27 |
| 4.0% | GBP 240 million | The FY27 guidance margin |
| 5.0% | GBP 300 million | Above guidance |
Cite this table: JLR EBIT sensitivity using Q1 revenue as a placeholder, my calculation. Not an estimate.
Three worked examples
Example 1, revenue. If Tata Motors PV reports revenue equal to Q1’s Rs 95,799 crore, it is 32.4% above the Q2 FY26 base and 9.1% below Q4 FY26’s Rs 1,05,447 crore (my calculation). That is how a strong headline growth rate can sit beside a sequential decline.
Example 2, the guidance path. The full-year guide implies GBP 1,040 million of EBIT. With about GBP 168 million booked in Q1, about GBP 872 million must come from about GBP 20 billion of remaining revenue, a 4.36% margin (my calculation). A Q2 margin below that is not a miss against guidance; it only raises the later bar.
Example 3, EPS. Q1 profit of Rs 775 crore and EPS of Rs 2.10 imply about 369 crore shares (my calculation), which matches the market value of Rs 1,08,648 crore at Rs 295 (about 368 crore shares). Each Rs 1,000 crore of profit therefore adds about Rs 2.71 of EPS (my calculation).
How do I read the Tata Motors PV Q2 results on results day?
Read in this order: the entity and the profit label, then revenue against Rs 95,799 crore, then the JLR EBIT margin against 2.8%, then free cash flow and net debt. Decide what each means before the share price moves.
| Order | Line to read | Mark to beat | Why it comes first |
|---|---|---|---|
| 1 | Profit label and entity | Owners’ share; TMPV, not the commercial-vehicle company | Avoids comparing the wrong profit |
| 2 | Consolidated revenue | Rs 95,799 crore (Q1); Rs 72,349 crore (year ago) | Shows scale and sequential direction |
| 3 | JLR EBIT margin | 2.8% (Q1); about 4% FY27 guide; -8.6% base | The biggest swing factor |
| 4 | EBITDA margin | 7.4% (Kotak Neo) or about 6.4% (Screener, my calculation) | Check which basis is used |
| 5 | Free cash flow and net debt | JLR break-even guide; Rs 20.1K crore net automotive debt base | Cash tells if profit is real |
| 6 | Exceptional items | Loss of Rs 32 crore in Q1 | Keeps one-offs out of the trend |
| 7 | India PV margin and EV volume | EBIT margin 0.2% base; 47,150 EVs | Shows the second engine |
Cite this table: Tata Motors PV results-day reading order, PositionalCalls.
Then ask one question of the management commentary: what is the JLR margin path for the second half, given a smaller China business and the tariff and warranty risks? A margin below 4% with a credible path reads differently from one with none.
Set the price reaction aside until the numbers are read. The shares fell 4.32% to Rs 334.50 on Friday, 14 August 2026 after Q1 (Kotak Neo) and settled 1.62% lower on the Q2 FY26 results day. Screener shows Rs 295 after the 9 November close, 11.8% below the Q1 close and 24.7% below last year’s Q2 close (my calculation); that snapshot is not live.
How do I read the Tata Motors PV Q2 filing and avoid fake alerts?
Open the results on the BSE or NSE announcement page for Tata Motors Passenger Vehicles, not through a link in a message, and read the consolidated statement first. Treat any tip that asks for an OTP, a payment or a login as fake.
- Open the BSE or NSE corporate announcements page and search for Tata Motors Passenger Vehicles Limited (TMPV).
- Choose the financial result filing for the quarter ended 30 September 2026 and open the consolidated statement.
- Note the line labels: revenue from operations, profit before tax, exceptional items and profit attributable to owners.
- Compare revenue and owners’ profit with Rs 95,799 crore and Rs 775 crore.
- Find the JLR section in the press release: revenue, EBIT margin, free cash flow and the guidance wording.
- Check the notes for exceptional items and restated earlier quarters before using a growth rate.
Fake “results alerts” and paid tip groups multiply on results days. No genuine filing asks for a login, an OTP or money. PositionalCalls is not SEBI-registered, gives no buy or sell calls and never asks for payment.
What do most people miss about the Tata Motors PV Q2 results?
Most readers miss the base distortion, the wholesale-versus-retail gap, the entity confusion and the exceptional lines. Six risk cards cover them.
Analyst’s note. What stands out: the Tata Motors PV Q2 results date lands after a quarter in which both JLR volumes and India sales rose sharply, yet the share price has fallen about 12% since the Q1 reaction. What is easy to miss: wholesale ran ahead of retail by about 3,400 cars, and the profit base is a loss. What would change the view: a JLR margin well below 2.8% or a free cash outflow. Caution: I found no consensus and could not open the Q1 release. Reader action: read the label, then the JLR margin, then cash, and avoid acting on a headline.
Bottom line
Tata Motors PV reports on Friday, 13 November 2026 at a time not yet confirmed. The marks that matter are revenue of Rs 95,799 crore, profit of Rs 775 crore, a JLR EBIT margin of 2.8% and a path to 4%. Read the commercial-vehicle company separately: Tata Motors Q2 results FY27 is the next read.
PositionalCalls WhatsApp channel
Never miss a Q2 results update
- Dates and times when companies confirm them
- Results explained without tips or targets
- Updated posts as they go live
Tata Motors PV Q2 results date: frequently asked questions
When is the Tata Motors PV Q2 results date?
The Tata Motors PV Q2 results date is Friday, 13 November 2026. The board of Tata Motors Passenger Vehicles is scheduled to consider results for the quarter ended 30 September 2026, per the NSE event calendar reported by EconoTimes on 31 October 2026. Upstox lists the same day. The time of release is not confirmed.
What time will Tata Motors PV announce Q2 results?
No announcement time has been confirmed. EconoTimes notes that the NSE calendar does not say the results will be published on the board-meeting day. Last year’s press release was dated 14 November 2025. Check the BSE or NSE announcement page for the company’s intimation and the filing itself.
What is the profit base Tata Motors PV has to beat?
The cleaner base is Q1 FY27 net profit of Rs 775 crore on revenue of Rs 95,799 crore (Kotak Neo). The Q2 FY26 profit of Rs 76,170 crore includes a notional Rs 82.6K crore demerger gain, so excluding it that quarter was a loss of roughly Rs 6,400 crore (my calculation).
Why is Tata Motors PV Q2 FY26 profit so high?
Q2 FY26 profit of Rs 76,170 crore exceeds the quarter’s revenue of Rs 72,349 crore because it includes a notional gain of about Rs 82.6K crore on the demerger of the commercial-vehicle business. It is an accounting gain, not trading profit, so year-on-year growth rates against it are not meaningful.
What are analysts expecting from Tata Motors PV in Q2 FY27?
I found no published consensus for Q2 FY27, so none is shown. The available views are June 2026 reactions to JLR’s FY27 guidance of about 4% EBIT margin on about GBP 26 billion revenue: Morgan Stanley, Nomura and Jefferies commented, and Citi is reported at Sell with a Rs 320 target (single source).
How did JLR sell in Q2 FY27?
JLR wholesales were 82,400 units, up 24.5% from 66,165, while retail sales were 79,000 against 85,371, about 7.5% lower (my calculation). UK and North America led wholesales, and China wholesales fell to about 6,100 from 11,370, per ChinaPulse (single source). The base was depressed by the cyber incident.
How many cars did Tata Motors PV sell in India in Q2 FY27?
Tata Motors PV sold 196,674 domestic passenger vehicles in July to September 2026 against 140,189 a year earlier, about 40.3% more (my calculation), and 201,723 including exports. EV sales were 47,150 against 24,855, up about 90%, and the company put the EV share at 23% (Autocar Professional, 1 October 2026).
What is JLR’s FY27 guidance, and how does it affect the Tata Motors PV Q2 results date?
JLR guided FY27 revenue of about GBP 26 billion, an EBIT margin of about 4% and break-even operating cash flow (Upstox, 18 June 2026). Around the Tata Motors PV Q2 results date, the mark is Q1’s 2.8% margin; reaching 4% needs about 4.4% across the remaining quarters (my calculation).
Is this Tata Motors PV Q2 results date post about the same company as Tata Motors Q2 results?
No. After the demerger, Tata Motors Limited is the commercial-vehicle company, which reported on 23 October 2026, while Tata Motors Passenger Vehicles Limited covers cars and JLR and reports on the Tata Motors PV Q2 results date, 13 November 2026. Our Tata Motors Q2 results page covers the commercial-vehicle company.
No. PositionalCalls is not SEBI-registered and gives no buy, sell or hold view or price target. Broker targets appear only as reported, with source and date. Figures labelled my calculation are arithmetic on public data. Read the filing and consult a registered adviser before taking any investment decision.
Sources
- BSE corporate announcements: where the TMPV filing will appear.
- NSE corporate filings: financial results: the same filing on NSE.
- EconoTimes: Tata Motors Passenger Vehicles board to consider Q2 results on Nov 13, 31 October 2026 (NSE calendar).
- Upstox: upcoming Q2 FY27 results list, updated 8 November 2026.
- Tata Motors Passenger Vehicles Group Q2 FY26 press release, 14 November 2025 (base quarter).
- Business Today: Tata Motors PV Q2 profit soars on demerger gain, 14 November 2025.
- Kotak Neo: Tata Motors PV Q1 FY27 results, August 2026.
- Free Press Journal: JLR wholesale volumes up 24.5% in Q2 FY27, 3 October 2026.
- ChinaPulse: Tata Motors PV Q2FY27 JLR wholesales, 6 October 2026.
- Autocar Professional: Tata Motors PV sales rise 40% in July to September, 1 October 2026.
- Multibagg: Tata Motors PV, JLR FY27 guidance triggers 10% fall, 18 June 2026.
- Upstox: what Morgan Stanley, Nomura and Jefferies said on FY27 outlook, 18 June 2026.
- DriveSpark: Tata Motors October 2026 sales, 1 November 2026.
- Screener: Tata Motors Passenger Vehicles consolidated, page snapshot after the 9 November 2026 close.
- Also named, not linked: Outlook Business, Asianet Newsable, Trendlyne.
Disclosure: PositionalCalls.com is not a SEBI-registered research analyst or investment adviser. Investments in securities markets are subject to market risks. Read all related documents carefully before investing. Returns are never guaranteed. PositionalCalls is an independent research and education site founded by Shubham Chaudhary. Nothing here is a recommendation, target or investment advice. How I researched this: for the Tata Motors PV Q2 results date I read the NSE calendar as reported by EconoTimes, the company press release of 14 November 2025 and reports by Business Today, Kotak Neo, Free Press Journal, ChinaPulse, Autocar Professional, Multibagg, Upstox and DriveSpark, noted where sources differ, and marked every derived number as my calculation. I did not open the Q1 FY27 press release or any exchange filing. Figures are as of 11 November 2026, 5:00 PM IST.

Shubham Chaudhary is the founder of PositionalCalls, an independent Indian stock market research website. He writes company fundamentals, quarterly results analysis, IPO analysis and sector research for NSE and BSE listed companies, with a focus on banking stocks, insurance and long-term value investing. Every article is built from primary sources such as RBI, SEBI, NSE and BSE filings and company annual reports, and states its risks plainly in simple language for retail investors.
Coverage areas Our research standards- Numbers checked against NSE, BSE and SEBI filings
- Risks and limits stated in every article
- No paid promotions or broker tie-ups
- Articles updated when new filings arrive