
Earnings · Metals and Mining
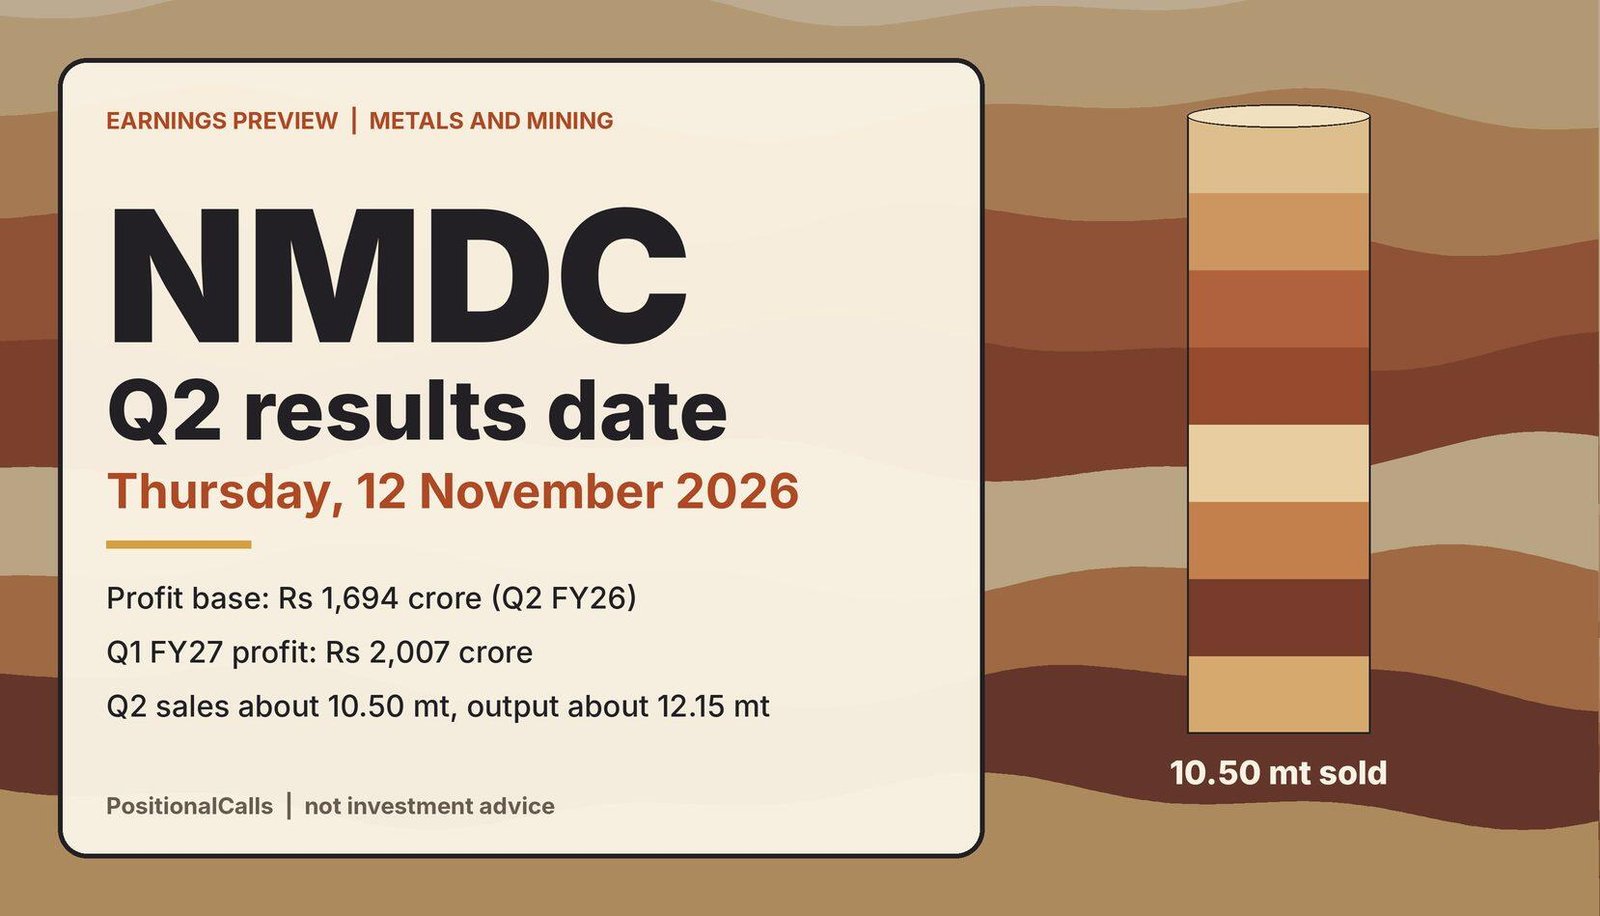
The NMDC Q2 results date is Thursday, 12 November 2026. Here is the year-ago base, the iron ore volumes already published for the quarter, the price cuts that matter and the marks to read first when the numbers arrive.
Quick answer
NMDC Q2 results date is Thursday, 12 November 2026, when the board meets to consider results for the quarter ended 30 September 2026, per Trendlyne. The base to beat is Q2 FY26 profit of Rs 1,694 crore and Q1 FY27 profit of Rs 2,007 crore. The release time is not confirmed.
Latest update (Wednesday, 11 November 2026, 1:00 PM IST): I found no change to the 12 November board date and no announcement time. I found no analyst consensus for Q2, so none is shown. NMDC publishes monthly production and sales, so volumes for the quarter are public and sit in the tables below. This post will be updated after the results.
Key takeaways
- Date: the board meets on Thursday, 12 November 2026 to consider the September-quarter results (Trendlyne). The time is not confirmed.
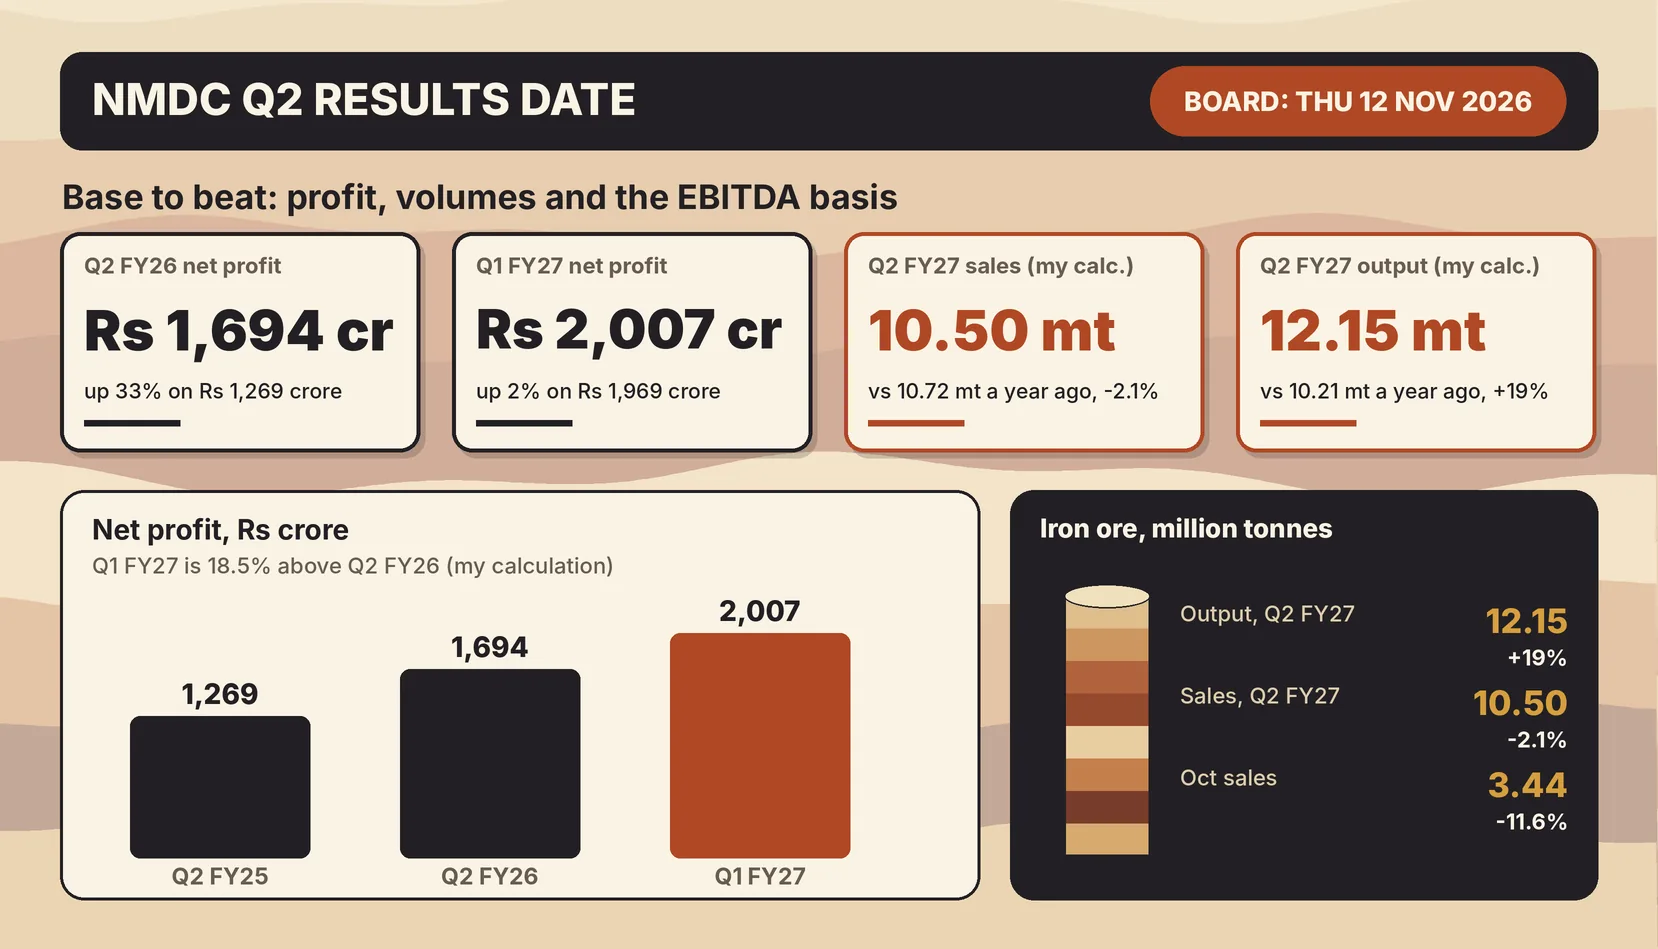
- Base to beat: Q2 FY26 revenue Rs 6,260.85 crore, EBITDA Rs 2,385 crore and profit Rs 1,694 crore; Q1 FY27 profit was Rs 2,007 crore.
- Volumes known: Q2 production about 12.15 million tonnes (+19%) but sales about 10.50 million tonnes (-2.1%), both my calculation from published totals.
- Price cut: NMDC cut lump ore by Rs 200 and fines by Rs 150 a tonne for August 2026 deliveries; sources differ on the new levels.
- Conflict: Q1 FY27 EBITDA is Rs 2,817 crore on one page and Rs 2,470 crore on another; the Rs 347 crore gap equals the revenue gap, so check the basis.
- Dividend: Rs 1 final went ex on 5 October 2026; interim payouts have gone ex in February and March, not after Q2.
In plain words: NMDC is India’s largest iron ore miner and is majority-owned by the government. It sells lump ore and fines to steel makers at prices it sets itself, so profit depends on tonnes sold, price per tonne and royalty costs. That is why this preview leans on volumes and prices more than on a broker estimate.
Data note: Figures are as of 11 November 2026, 1:00 PM IST. They follow Trendlyne, Upstox, Business Today, ScanX, SteelOrbis, Metal.com and Nuvama as quoted by Business Today. I could not open the company’s Q1 FY27 filing or any exchange document, so quarterly figures are headline-level and different pages use different bases. Derived numbers are my calculation. I found no analyst consensus for Q2.
In this post
When is the NMDC Q2 results date, and at what time will it be announced?
The NMDC Q2 results date is Thursday, 12 November 2026: the board is scheduled to consider the results for the quarter and half-year ended 30 September 2026, per Trendlyne’s company page dated 9 November. No announcement time has been confirmed.
Trendlyne lists the board meeting for 12 November 2026. My earlier calendar work for this site also placed NMDC on Thursday, 12 November, next to HAL, Vodafone Idea and Bharat Dynamics. I did not open the exchange intimation itself, so treat the day as reported, not as filed. A board date is a plan, and boards can move meetings.
NMDC Q2 results date: what each source says
| Item | What was reported | Source and date | Status |
|---|---|---|---|
| Board meeting day | 12 November 2026 | Trendlyne, 9 Nov 2026 | Reported by one page I opened |
| Quarter covered | Quarter and half-year ended 30 September 2026 | Trendlyne | Reported |
| Publication time | Not stated | None found | Not confirmed |
| Earnings call | Not found | None | Not confirmed |
| Dividend on the agenda | Not stated | None found | Not confirmed |
| Filing deadline | 14 November 2026 | My calculation: 30 Sep plus 45 days | Legal limit, not the planned date |
Cite this table: NMDC Q2 results date and time status, as of 11 November 2026, 1:00 PM IST, PositionalCalls.
The check that settles it is the company’s own intimation and the result filing on the BSE or NSE announcement page. Anything that says a time without pointing to that page should be left alone.
Why last year’s pattern is only a loose guide to the NMDC Q2 results date
I did not find last year’s exact release time in the pages I opened, so I do not lean on it. This year the board meets on 12 November, two days before the legal limit of 14 November (my calculation). A date close to the deadline is not a signal by itself, but it leaves little room if the meeting slips.
What is the profit and revenue base NMDC has to beat in Q2 FY27?
The year-ago base is Q2 FY26: revenue of Rs 6,260.85 crore, EBITDA of Rs 2,385 crore and net profit of Rs 1,694 crore. The nearer base is Q1 FY27, with profit of Rs 2,007 crore on 11.73 million tonnes of sales.
| Rs crore unless stated | Q2 FY25 | Q2 FY26 | Q1 FY27 | What to compare |
|---|---|---|---|---|
| Revenue from operations | 4,806.57 | 6,260.85 (+30%) | 6,795 (+2% on 6,634) | Q2 FY27 above 6,260.85 beats the year-ago; above 6,795 beats Q1 |
| EBITDA | 1,801 | 2,385 (+32%) | 2,817 or 2,470 (two bases) | Check which basis the filing uses |
| Net profit | 1,269 | 1,694 (+33%) | 2,007 (+2% on 1,969) | Q1 FY27 is 18.5% above Q2 FY26 (my calculation) |
| Production, million tonnes | 8.29 | 10.21 (+23%) | 15.12 (+26%) | Q2 FY27 is already published |
| Sales, million tonnes | 9.73 | 10.72 (+10%) | 11.73 (+2%) | Q2 FY27 is already published |
Cite this table: NMDC consolidated headline base, ScanX (Q2 FY26) and Business Today (Q1 FY27), as of 11 November 2026, 1:00 PM IST. Q2 FY25 volumes are from ScanX’s lakh-tonne figures converted to million tonnes.
Two cross-checks give some comfort that the headline figures hang together. Half-year FY26 turnover of Rs 12,895 crore less Q2’s Rs 6,261 crore leaves Rs 6,634 crore for Q1 FY26, the same figure Business Today uses as the year-ago quarter for Q1 FY27. The same test on profit, Rs 3,663 crore less Rs 1,694 crore, gives Rs 1,969 crore, which also matches (my calculation).
NMDC Q2 results date: the half-year base
| H1 FY26 (April to September 2025) | Figure | Note |
|---|---|---|
| Turnover | Rs 12,895 crore | ScanX |
| Net profit | Rs 3,663 crore | ScanX |
| Production | 22.20 million tonnes | ScanX |
| Sales | 22.23 million tonnes | ScanX |
| H1 FY27 profit if Q2 equals Q1 | Rs 4,014 crore | My calculation: 2 x 2,007; +9.6% on 3,663; illustration, not an estimate |
Cite this table: NMDC half-year base, ScanX and my calculation, as of 11 November 2026, 1:00 PM IST.
A flat Q2 profit of Rs 2,007 crore would be 18.5% above the year-ago Rs 1,694 crore and would take the half-year to about Rs 4,014 crore. That is arithmetic, not a forecast: it simply shows how little growth the first half needs to look healthy against a base that was itself 33% higher.
NMDC revenue per tonne: a number the filing will not print
Dividing revenue by tonnes sold gives a rough realisation. Q2 FY26 revenue of Rs 6,260.85 crore on 10.716 million tonnes is about Rs 5,843 a tonne, and Q1 FY27 revenue of Rs 6,795 crore on 11.73 million tonnes is about Rs 5,793 a tonne (my calculation, ignoring other operating revenue). The gap is small, which is why tonnes, not price, explain most of the quarterly swing in this company.
Which NMDC figures are the right ones to compare on results day?
Compare Q2 FY27 first with Q1 FY27 and with Q2 FY26, on the same basis. Q1 FY27 EBITDA appears as Rs 2,817 crore and Rs 2,470 crore, and Q2 FY26 profit as Rs 1,694 crore and Rs 1,698.86 crore, so the basis matters before the direction does.
Four conflicts already exist. They are shown here, not resolved.
| Item | Figure A | Figure B | How to read it |
|---|---|---|---|
| Q1 FY27 revenue | Rs 6,795 crore (Business Today) | Rs 7,142 crore (Trendlyne, Upstox) | The Rs 347 crore gap reads as other income added to revenue (my reading) |
| Q1 FY27 EBITDA | Rs 2,817 crore (Business Today) | Rs 2,470 crore (Nuvama; Trendlyne operating profit) | The same Rs 347 crore separates them; Nuvama’s basis excludes it |
| Q1 FY27 operating margin | 41.5% (my calculation on 2,817 / 6,795) | 36.35% (Trendlyne; matches 2,470 / 6,795) | Pick one basis and keep it for Q2 |
| Q2 FY26 profit | Rs 1,694 crore (ScanX) | Rs 1,698.86 crore (second source I read) | Rounding or a basis difference; the gap is Rs 4.86 crore |
| Apr-Oct FY27 sales | 35.67 million tonnes (printed) | 25.67 million tonnes (my calculation: 22.23 + 3.44) | The printed figure cannot be right; use the calculation |
| August 2026 price level | Lump Rs 5,650, fines Rs 4,550 (SteelOrbis) | Lump Rs 5,250, fines Rs 4,500 (Metal.com) | Both report a cut of Rs 200 and Rs 150 or close to it |
Cite this table: NMDC conflicting figures, as of 11 November 2026, 1:00 PM IST, PositionalCalls.
The Rs 347 crore match is the useful finding. Revenue differs by 347 and EBITDA differs by 347, which is what you would see if one page adds other income to both lines and the other does not. That is my reading of the arithmetic; I could not confirm it from the filing. It matters because Nuvama’s Rs 2,106 a tonne EBITDA, which is 2,470 divided by 11.73 million tonnes (my calculation), only works on the lower basis.
NMDC Q2 results date checklist: lines to keep on one basis
- Profit label: use net profit after tax for the period, consolidated if the page shows both.
- EBITDA: decide whether other income is in or out before you compare with Rs 2,385 crore or Rs 2,470 crore.
- Revenue: use revenue from operations, not total income.
- Volumes: use million tonnes of sales, not production, to explain revenue.
I found no published Q2 FY27 consensus for NMDC. Trendlyne shows a HOLD consensus from 22 analysts and an average full-year EPS estimate of Rs 9.6 against trailing EPS of Rs 8.5. The shares were at Rs 72.85 on 11 November, about 25% below the 52-week high.
Broker views are shown only as reported, with date and source. They are not PositionalCalls targets and are not a view of mine.
| Broker (as reported) | Rating | Target, Rs | Date | Source |
|---|---|---|---|---|
| Nuvama | Buy (upgraded from Hold) | 97 (cut from 100) | 17 Aug 2026 | Business Today |
| Motilal Oswal | Buy | 98 | 13 Aug 2026 | Trendlyne |
| Prabhudas Lilladher | Accumulate | 97 | 1 Jun 2026 | Trendlyne |
| IDBI Capital | Buy | 102 | 1 Jun 2026 | Trendlyne |
| ICICI Direct | Hold | 105 | 1 Jun 2026 | Trendlyne |
Cite this table: NMDC broker views as reported, Business Today and Trendlyne, as of 11 November 2026, 1:00 PM IST.
Nuvama upgraded the stock on 17 August after a Q1 EBITDA miss: Rs 2,470 crore against its own estimate of Rs 2,620 crore, with EBITDA flat year on year. Its reasoning, as reported, was that domestic iron ore prices had probably bottomed and that higher volumes should lift second-half earnings. It values the stock at 9 times FY28 earnings.
NMDC Q2 results date: price and valuation snapshot
| Item | Figure | Source or note |
|---|---|---|
| Share price, 11 Nov 2026 (intraday, about 11:59 AM) | Rs 72.85 (+1.89%) | Upstox |
| Share price, 9 Nov 2026 close | Rs 71.50 | Trendlyne |
| Share price, 17 Aug 2026 | Rs 85.10 | Business Today |
| 52-week range | Rs 65.15 to Rs 97.49 | Upstox |
| Market capitalisation | Rs 62,773.58 crore | Upstox |
| Price to earnings | 8.42 | Upstox |
| Gap to 52-week high | -25.3% | My calculation: 72.85 / 97.49 – 1 |
| Move since 17 Aug | -14.4% | My calculation: 72.85 / 85.10 – 1 |
Cite this table: NMDC price snapshot, Upstox, Trendlyne and Business Today; calculations by PositionalCalls. Not live.
The shares have fallen about 14% since the upgrade even as production rose, which tells you the market is weighing sales volumes and prices more than output. A price snapshot is not a view: the figures above are a record of where the stock stood, not a signal.
NMDC dividend record before the results
| Ex-date | Rs per share | Type (Trendlyne) |
|---|---|---|
| 5 Oct 2026 | 1 | Final |
| 13 Feb 2026 | 2.5 | Interim |
| 14 Aug 2025 | 1 | Final |
| 21 Mar 2025 | 2.3 | Interim |
| 17 Sep 2024 | 1.5 | Final |
Cite this table: NMDC dividend history, Trendlyne, as of 11 November 2026, 1:00 PM IST. Upstox lists the first two without a type.
PositionalCalls WhatsApp channel
NMDC results, then the next metals filing
- The filing and the volume check as soon as they appear
- Base-versus-actual checks in plain words
- Links to every updated Q2 FY27 page
The last two payouts add to Rs 3.50 a share, or about 4.8% of Rs 72.85 (my calculation). The interim payouts have gone ex in February and March, so the 12 November meeting is not the usual home for an interim declaration; the filing will say if one is declared. For how dividend income is taxed, see dividend tax in India.
Dividends are a board decision. Nothing here says one will be declared.
What drives NMDC’s Q2 numbers: volumes, prices and costs?
Around the NMDC Q2 results date, three things drive NMDC’s quarter: tonnes sold, the price per tonne and royalty costs. Production for Q2 is up about 19%, sales are down about 2%, prices were cut in August, and royalty added Rs 652 a tonne to Q1 costs.
NMDC Q2 results date: the volumes are already public
NMDC reports production and sales every month. Subtracting the first-quarter figures from the April to September totals gives Q2: production of about 12.15 million tonnes against 10.21 million a year ago, and sales of about 10.50 million tonnes against 10.72 million (my calculation).
| Million tonnes | Q2 FY26 | Q2 FY27 (my calculation) | Change | Source |
|---|---|---|---|---|
| Production | 10.21 | 12.15 | +19.0% | Total 27.27 less Q1 15.12 |
| Sales | 10.72 | 10.50 | -2.1% | Total 22.23 less Q1 11.73 |
| Production minus sales | -0.51 | +1.65 | Stock build | Production above sales adds to stockpile |
Cite this table: NMDC Q2 volumes, ScanX, SteelOrbis and Business Today; subtraction by PositionalCalls, as of 11 November 2026, 1:00 PM IST.
Production ran 1.65 million tonnes ahead of sales in the quarter (my calculation), against a quarter a year ago in which sales were 0.51 million tonnes ahead of output. Revenue comes from sales, so a quarter with higher output and lower sales is a stock build, not extra revenue.
NMDC monthly volumes, July to October 2026
| Month (2026) | Production, mt | Production change | Sales, mt | Sales change |
|---|---|---|---|---|
| July | 4.06 | +31% | Not found | – |
| August | About 4.05 | +21% (headline) | Not found | – |
| September | 4.04 | +8% | 3.51 | -10% |
| October (Q3) | 5.04 | +18% | 3.44 | -11.57% |
| April to October | 32.32 | +22% | 25.67 (calculated) | Printed 35.67 is inconsistent |
Cite this table: NMDC monthly volumes, Metal.com, SteelOrbis and company-reported figures; August is my calculation (12.15 – 4.06 – 4.04), as of 11 November 2026, 1:00 PM IST.
September and October sales were each about 10% to 12% lower than a year earlier. October belongs to Q3, but it shows the trend did not reverse after the quarter ended.
Price cuts and the realisation
NMDC cut lump ore by Rs 200 a tonne and fines by Rs 150 for August 2026 deliveries, effective from about 8 August (SteelOrbis and Metal.com). Earlier, in June, it had raised lump by Rs 200 and fines by Rs 150 (Kotak Neo headline). So Q2 saw a hike in June and a cut in August, with July and part of August in between; the filing will show the net effect on realisation.
| Date (2026) | Move | Lump, Rs a tonne | Fines, Rs a tonne | Source |
|---|---|---|---|---|
| June | Hike | +200 | +150 | Kotak Neo headline |
| 8 to 10 August | Cut | -200 (to 5,650 or 5,250) | -150 (to 4,550 or 4,500) | SteelOrbis; Metal.com differ on levels |
Cite this table: NMDC price moves, SteelOrbis, Metal.com and Kotak Neo, as of 11 November 2026, 1:00 PM IST. Prices are ex-pithead and exclude taxes and levies.
Nuvama’s read of Q1 is useful here: blended realisation was up Rs 416 a tonne year on year, but royalty and premium costs rose Rs 652 a tonne, so EBITDA per tonne fell Rs 46 to Rs 2,106. A cost line that rises faster than price is the thing to look for in the Q2 filing.
The 60 million tonne target
NMDC targets 60 million tonnes of production in FY27 and 100 million tonnes by 2030 (Business Today). With 32.32 million tonnes produced from April to October, reaching 60 needs 27.68 million over the remaining five months, or about 5.54 million a month (my calculation), against 5.04 million in October. Production is on course; whether sales and prices follow is the open question.
What would different outcomes look like after the NMDC Q2 results date, in numbers?
These tables are arithmetic on public figures, not forecasts. They show what revenue, EBITDA and profit would be at a few illustrative levels and what each means against the base.
| Illustrative revenue a tonne, Rs | Revenue on 10.50 mt, Rs crore | Versus Q2 FY26 (6,260.85) |
|---|---|---|
| 5,500 | 5,775 | -7.8% |
| 5,800 | 6,090 | -2.7% |
| 6,100 | 6,405 | +2.3% |
Cite this table: NMDC revenue sensitivity at calculated Q2 sales of 10.50 million tonnes, my calculation. Not an estimate.
| Illustrative EBITDA a tonne, Rs | EBITDA on 10.50 mt, Rs crore | Meaning |
|---|---|---|
| 2,106 | 2,211 | Same as Q1 FY27 on Nuvama’s basis |
| 2,200 | 2,310 | Mild improvement |
| 2,271 | 2,385 | Equals the Q2 FY26 EBITDA (my calculation; basis may differ) |
| 2,300 | 2,415 | Above the year-ago EBITDA |
Cite this table: NMDC EBITDA arithmetic, my calculation. Not an estimate.
| Illustrative Q2 net profit, Rs crore | Versus Q2 FY26 (1,694) | Versus Q1 FY27 (2,007) |
|---|---|---|
| 1,850 | +9.2% | -7.8% |
| 2,007 | +18.5% | Flat |
| 2,150 | +26.9% | +7.1% |
Cite this table: NMDC profit sensitivity, my calculation from the published base. Not an estimate.
Three worked examples
Example 1, volumes. Sales of 10.50 million tonnes at Q1’s realisation of about Rs 5,793 a tonne give revenue near Rs 6,083 crore, about 2.8% below Q2 FY26 (my calculation). Lower sales can therefore sit beside higher profit only if the margin per tonne rises.
Example 2, the margin bridge. To match the year-ago EBITDA of Rs 2,385 crore on 10.50 million tonnes, EBITDA per tonne has to be about Rs 2,271, which is Rs 165 above Q1’s Rs 2,106 (my calculation). That is the size of the gap between a cost-driven and a price-driven quarter.
Example 3, profit against the base. A profit equal to Q1’s Rs 2,007 crore would be 18.5% above Rs 1,694 crore; a profit of Rs 1,850 crore would still be 9.2% above it but 7.8% below Q1 (my calculation). A year-on-year gain and a sequential fall can occur together.
How do I read the NMDC Q2 results on results day?
On the NMDC Q2 results date, read in this order: the profit label, then revenue against Rs 6,260.85 crore, then sales volume against 10.50 million tonnes, then EBITDA per tonne against Rs 2,106, then cash, dividend and guidance.
| Order | Line to read | Mark to beat | Why it comes first |
|---|---|---|---|
| 1 | Profit label and basis | Net profit after tax; consolidated | Avoids comparing two different profits |
| 2 | Revenue from operations | Rs 6,260.85 crore (year ago); Rs 6,795 crore (Q1) | Shows scale and direction |
| 3 | Sales volume | About 10.50 mt (my calculation) | Revenue follows tonnes |
| 4 | EBITDA and EBITDA a tonne | Rs 2,385 crore; Rs 2,106 a tonne (Q1, Nuvama) | Separates price from cost |
| 5 | Net profit | Rs 1,694 crore (year ago); Rs 2,007 crore (Q1) | The headline most people quote |
| 6 | Royalty and expenses | Royalty added Rs 652 a tonne in Q1 | The cost line that drove the Q1 miss |
| 7 | Dividend and capex | Rs 1 final already paid in October | Shows what is returned and what is reinvested |
| 8 | Production guidance | 60 million tonnes for FY27 | Management tone on volumes |
Cite this table: NMDC results-day reading order, PositionalCalls.
Then read one management sentence: what do they expect for sales volumes and the iron ore price in the second half? Nuvama’s view is that prices have bottomed; the filing and commentary will show whether the company agrees. Set the share price reaction aside until the numbers are read.
How do I read the NMDC Q2 filing and avoid fake alerts?
On the NMDC Q2 results date, open the result on the BSE or NSE announcement page for NMDC Limited, not through a link in a message, and read the consolidated statement first. Treat any tip that asks for an OTP, a payment or a login as fake.
- Open the BSE or NSE corporate announcements page and search for NMDC Limited.
- Choose the financial result filing for the quarter ended 30 September 2026 and open the consolidated statement.
- Note the line labels: revenue from operations, other income, EBITDA if shown, profit before tax and profit after tax.
- Compare revenue and profit with Rs 6,260.85 crore and Rs 1,694 crore, then with Rs 6,795 crore and Rs 2,007 crore.
- Read the segment note and the press release for volumes, realisation and the dividend decision.
- Check the notes for exceptional items, restated figures and contingent liabilities before using a growth rate.
Fake results alerts and paid tip groups multiply on results days. No genuine filing asks for a login, an OTP or money. PositionalCalls is not SEBI-registered, gives no buy or sell calls and never asks for payment.
What do most people miss about the NMDC Q2 results?
Around the NMDC Q2 results date, most readers miss the basis differences, the gap between production and sales, the cost side and the dividend timing. Six risk cards cover them.
Analyst’s note. What stands out: output is up about 19% but sales are down about 2%, and the shares are about 14% below their August level. What is easy to miss: the two EBITDA bases differ by exactly the revenue gap. What would change the view: EBITDA a tonne well below Rs 2,106 or a larger stock build. Caution: I found no consensus and could not open the Q1 filing. Reader action: read the label, then volumes, then cost per tonne, and avoid acting on a headline.
Bottom line
The NMDC Q2 results date is Thursday, 12 November 2026, at a time not yet confirmed. The marks that matter are revenue of Rs 6,260.85 crore, profit of Rs 1,694 crore, sales near 10.50 million tonnes and EBITDA of Rs 2,106 a tonne. For the wider metals read, see Tata Steel Q2 results FY27.
PositionalCalls WhatsApp channel
Never miss a Q2 results update
- Dates and times when companies confirm them
- Results explained without tips or targets
- Updated posts as they go live
NMDC Q2 results date: frequently asked questions
When is the NMDC Q2 results date?
The NMDC Q2 results date is Thursday, 12 November 2026. The board is scheduled to consider results for the quarter and half-year ended 30 September 2026, per Trendlyne’s company page dated 9 November. The time of release is not confirmed, so check the BSE or NSE announcement page.
What time is the NMDC Q2 results date announcement?
No announcement time has been confirmed for the NMDC Q2 results date, and I found no earnings call detail. The legal limit is 14 November 2026, 45 days after the quarter end (my calculation). The reliable check is the company’s intimation and the result filing on the BSE or NSE announcement page.
What is the profit base to beat on the NMDC Q2 results date?
The year-ago base is Q2 FY26 net profit of Rs 1,694 crore on revenue of Rs 6,260.85 crore and EBITDA of Rs 2,385 crore (ScanX). The nearer base is Q1 FY27 profit of Rs 2,007 crore (Business Today), which is 18.5% above the year-ago figure (my calculation).
How much iron ore did NMDC sell in Q2 FY27?
Ahead of the NMDC Q2 results date, April to September sales were 22.23 million tonnes, and Q1 sales were 11.73 million, so Q2 sales were about 10.50 million tonnes against 10.72 million a year ago, roughly 2.1% lower (my calculation). Production rose about 19% to roughly 12.15 million tonnes.
What are analysts expecting from NMDC in Q2 FY27?
Ahead of the NMDC Q2 results date I found no published Q2 consensus. Trendlyne shows a HOLD consensus from 22 analysts and an average FY27 EPS estimate of Rs 9.6. Reported broker views include Nuvama Buy with a Rs 97 target (17 August 2026) and Motilal Oswal Buy with Rs 98 (13 August 2026).
Why do NMDC’s Q1 FY27 EBITDA figures differ?
Business Today reports Q1 FY27 EBITDA of Rs 2,817 crore on revenue of Rs 6,795 crore, while Nuvama and Trendlyne use Rs 2,470 crore. The Rs 347 crore gap matches the gap between revenue of Rs 7,142 crore and Rs 6,795 crore, which suggests other income (my reading, unconfirmed).
Did NMDC cut iron ore prices before the NMDC Q2 results date?
Yes. For August 2026 deliveries NMDC cut lump ore by Rs 200 a tonne and fines by Rs 150 (SteelOrbis, Metal.com), after a June increase of the same size. Sources differ on the new levels, with lump at Rs 5,650 or Rs 5,250 and fines at Rs 4,550 or Rs 4,500.
Is NMDC likely to declare a dividend with Q2 results?
Dividends are a board decision and nothing here says one is coming. NMDC’s Rs 1 final went ex on 5 October 2026, and its interim payouts of Rs 2.50 and Rs 2.30 went ex in February 2026 and March 2025 (Trendlyne), so Q2 has not been the usual home for an interim.
What is NMDC’s production target?
Before the NMDC Q2 results date, the stated target is 60 million tonnes of production in FY27 and 100 million tonnes by 2030 (Business Today). With 32.32 million tonnes produced from April to October, it needs about 5.54 million tonnes a month over the next five months (my calculation), against 5.04 million in October.
No. This NMDC Q2 results date preview is not a recommendation, and PositionalCalls is not SEBI-registered and gives no buy, sell or hold view or price target. Broker targets appear only as reported, with source and date. Figures labelled my calculation are arithmetic on public data. Read the filing and consult a registered adviser before taking any investment decision.
Sources
- BSE corporate announcements: where the NMDC filing will appear.
- NSE corporate filings: financial results: the same filing on NSE.
- Trendlyne: NMDC company page, snapshot 9 November 2026 (board date, dividends, broker views).
- Upstox: NMDC share price, snapshot 11 November 2026 (price, market cap, 52-week range).
- ScanX: NMDC Q2 and H1 FY26 performance, base quarter.
- Business Today: NMDC Q1 profit rises to Rs 2,007 crore, 16 August 2026.
- Business Today: Nuvama upgrades NMDC to Buy, 17 August 2026.
- SteelOrbis: NMDC October 2026 output and sales.
- SteelOrbis: NMDC September 2026 output and sales.
- SteelOrbis: NMDC cuts iron ore prices for August 2026, 10 August 2026.
- Metal.com: NMDC cuts iron ore prices after July output surge, August 2026.
- Also named, not linked: Nuvama and Motilal Oswal as quoted by Business Today and Trendlyne.
Disclosure: PositionalCalls.com is not a SEBI-registered research analyst or investment adviser. Investments in securities markets are subject to market risks. Read all related documents carefully before investing. Returns are never guaranteed. PositionalCalls is an independent research and education site founded by Shubham Chaudhary. Nothing here is a recommendation, target or investment advice. How I researched this: for the NMDC Q2 results date I read the Trendlyne and Upstox company pages, ScanX, Business Today, SteelOrbis and Metal.com, noted where sources differ, and marked every derived number as my calculation. I did not open the Q1 FY27 filing or any exchange document. Figures are as of 11 November 2026, 1:00 PM IST.

Shubham Chaudhary is the founder of PositionalCalls, an independent Indian stock market research website. He writes company fundamentals, quarterly results analysis, IPO analysis and sector research for NSE and BSE listed companies, with a focus on banking stocks, insurance and long-term value investing. Every article is built from primary sources such as RBI, SEBI, NSE and BSE filings and company annual reports, and states its risks plainly in simple language for retail investors.
Coverage areas Our research standards- Numbers checked against NSE, BSE and SEBI filings
- Risks and limits stated in every article
- No paid promotions or broker tie-ups
- Articles updated when new filings arrive