
Earnings · Life Insurance Corporation of India · Q2 FY27
LIC reported a 20% rise in profit, but new business missed the only estimate found. Here are the profit bases, VNB, margin and APE, premium lines, brokerage views as reported and the price reaction.
Quick answer
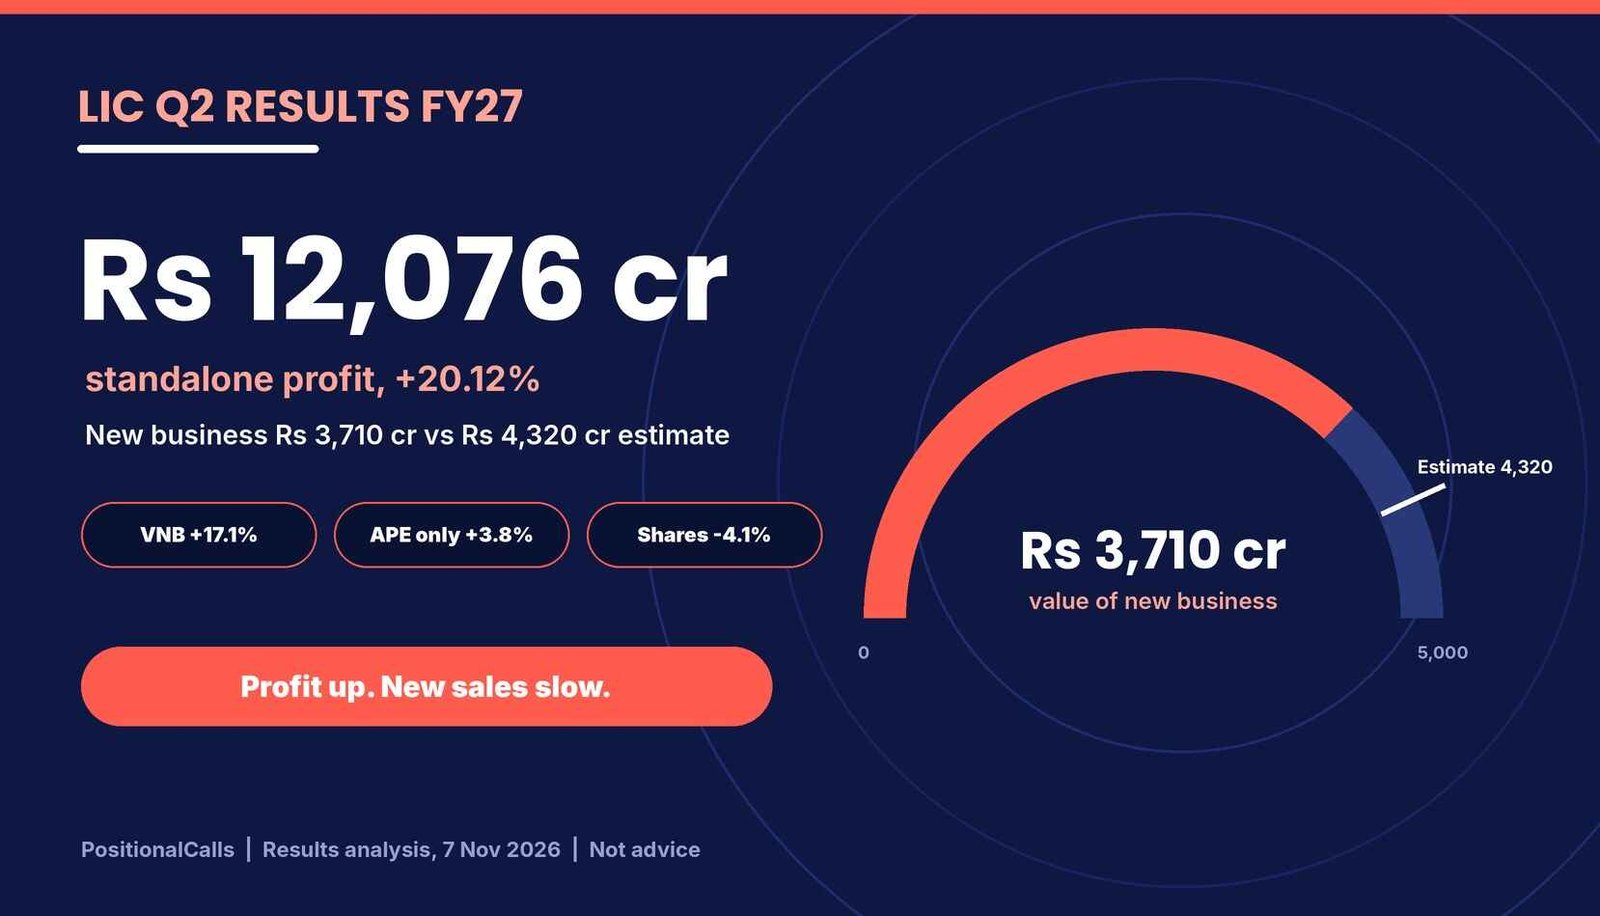
LIC Q2 results FY27: LIC reported standalone profit of Rs 12,076 crore, up 20.12% (consolidated Rs 12,115 crore), on 5 November 2026. Value of new business was Rs 3,710 crore, up 17.1% but below Centrum’s Rs 4,320 crore estimate, and APE grew only 3.8%. The stock fell about 4% on 6 November.
Latest update (Saturday, 7 November 2026, 8:00 PM IST): LIC announced the LIC Q2 results FY27 after market hours on Thursday, 5 November (PSU Watch published at 5:02 PM IST). On Friday, 6 November the stock fell as much as 4.1% to Rs 391.60 in morning trade, per Business Standard, and Jefferies cut its target to Rs 510 from Rs 530. I did not find an official 6 November close or any news after Friday afternoon. The next trading session is Monday, 9 November.
Key takeaways
- Profit: Standalone Rs 12,076 crore (+20.12%) and consolidated Rs 12,115 crore (+20%, one wire report); Q2 profit is about 10% below Q1 FY27’s Rs 13,492 crore.
- Value of new business: Rs 3,710 crore (+17.1% on year, +18.3% on Q1) against Centrum’s Rs 4,320 crore estimate, a 14.1% shortfall (my calculation). Jefferies said VNB missed its estimate.
- Margin and APE: VNB margin 21.82% (19.33% a year ago, 22.90% in Q1); APE Rs 17,004 crore, up only 3.8%, against Centrum’s Rs 18,800 crore.
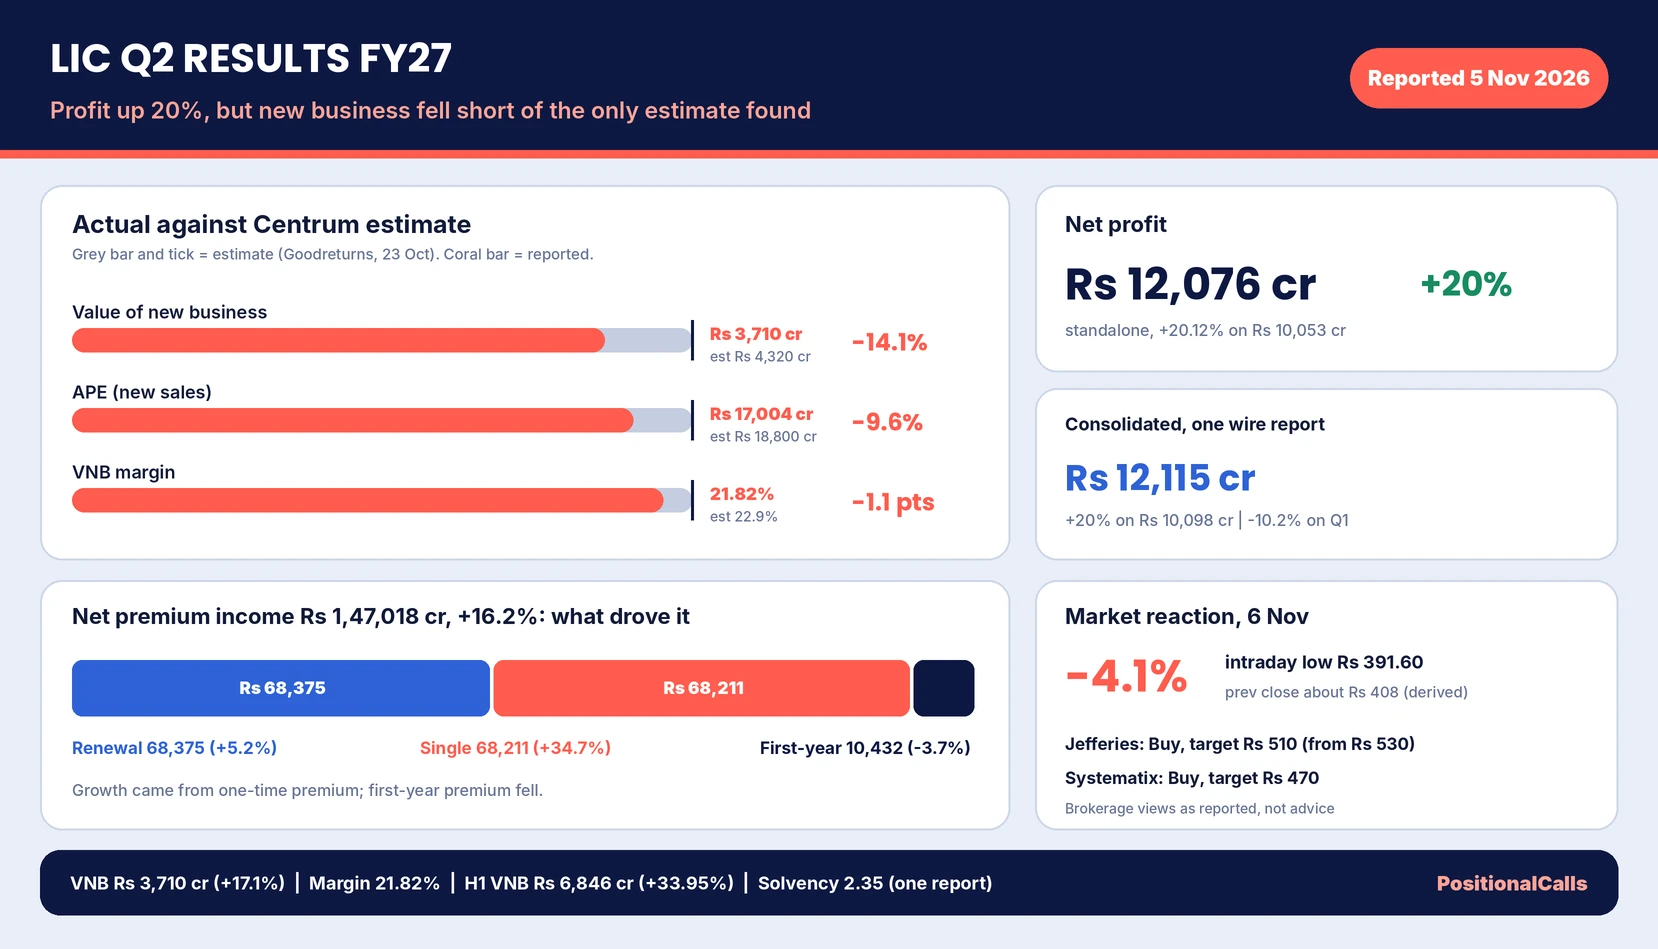
- Premium: Net premium income Rs 1,47,018 crore (+16.2%), driven by single premium; first-year premium fell 3.7% to Rs 10,432 crore.
- Balance sheet: AUM Rs 59.61 lakh crore (+4.16%), solvency 2.35 and embedded value Rs 7.97 lakh crore (-1.95%), all from one report.
- Street and price: Jefferies cut its target to Rs 510 from Rs 530 (Buy); Systematix Buy at Rs 470 (as reported). Shares fell as much as 4.1% to Rs 391.60 on 6 November.
Preview post, 31 October 2026LIC Q2 results preview: date, VNB base and what to watch
- The 5 November board date and the Rs 10,098 crore profit base
- The derived Rs 3,167 crore VNB base and the Centrum estimate
- A reading guide with stronger, in-line and weaker marks
Read the full preview post for the checklist made before the numbers arrived.
This results analysis, 7 November 2026What the numbers showed
- Standalone and consolidated profit side by side
- VNB, margin and APE against the estimate and the base
- Premium lines, brokerage views as reported and the price reaction
A table further down grades each preview mark against the actual figure.
How to read this page: it is results analysis, not a recommendation. Brokerage ratings and targets are quoted as reported with source and date; none is mine. PositionalCalls.com is not a SEBI-registered research analyst or investment adviser.
In plain words: LIC earned Rs 12,076 crore, but profit at an insurer swings with investment items, so analysts watch the value of new business (VNB), the estimated value of policies sold in the quarter. APE is annual premium equivalent, the yardstick for new sales, and VNB margin is VNB divided by APE. Here VNB grew less than hoped because APE grew only 3.8%.
Data note: as of Saturday, 7 November 2026, 8:00 PM IST. Figures come from press and data-platform summaries of the filing (PSU Watch, Business Standard, Equentis, Indian Masterminds, Indian PSU and Social News XYZ); I did not open the BSE or NSE filing. Most reports do not say whether Rs 12,076 crore is standalone or consolidated; only PSU Watch labels it standalone, and one wire report gives consolidated Rs 12,115 crore. One report (Social News XYZ) lists Q1’s VNB of Rs 3,136 crore as the Q2 figure; I do not use that line. Derived numbers are marked “my calculation”.
LIC Q2 results FY27: what LIC reported on 5 November
The LIC Q2 results FY27 show standalone profit of Rs 12,076 crore (+20.12%), net premium income of Rs 1,47,018 crore (+16.2%), VNB of Rs 3,710 crore (+17.1%) at a 21.82% margin, and APE of Rs 17,004 crore (+3.8%).
| Measure | Q2 FY27 | Change on year | Source and note |
|---|---|---|---|
| Net profit, standalone | Rs 12,076 crore | +20.12% | PSU Watch; year-ago Rs 10,053 crore |
| Net profit, consolidated | Rs 12,115 crore | +20% | Social News XYZ (wire report); year-ago Rs 10,098 crore |
| Total income | Rs 2,62,739 crore | +9.7% | PSU Watch; year-ago Rs 2,39,614 crore (my calculation for growth) |
| Net premium income | Rs 1,47,018 crore | +16.2% | PSU Watch; Indian Masterminds |
| Value of new business | Rs 3,710 crore | +17.1% | Equentis; Systematix via Business Standard |
| VNB margin | 21.82% | +249 bps | Equentis; Business Standard says -109 bps on Q1 |
| APE | Rs 17,004 crore | +3.8% | Business Standard; year-ago Rs 16,382 crore |
| Half-year VNB | Rs 6,846 crore | +33.95% | PSU Watch; margin 22.3% against 17.6% |
Cite this table: PositionalCalls, “LIC Q2 FY27 Results Table, as of 7 November 2026”.
The LIC Q2 results FY27 tell two stories. Profit is up a clean 20% and premium income is up 16%, but the part analysts treat as the quality of the quarter, new business, came in below the only estimate I found and APE barely grew. The half-year ties exactly: Q1 FY27 VNB of Rs 3,136 crore plus Q2 VNB of Rs 3,710 crore is Rs 6,846 crore, the half-year figure PSU Watch gives (my calculation). The rest of this page compares the sources, grades the marks from the preview post published on 31 October, and lists what does not tie.
LIC Q2 FY27 profit: standalone Rs 12,076 crore or consolidated Rs 12,115 crore?
Both are reported: standalone profit of Rs 12,076 crore is up 20.12% on Rs 10,053 crore, and a wire report gives consolidated profit of Rs 12,115 crore, up 20% on Rs 10,098 crore. Compare each only with its own base.
| Basis | Q2 FY27 | Q2 FY26 | Growth | Gap between bases |
|---|---|---|---|---|
| Standalone | Rs 12,076 crore | Rs 10,053 crore | +20.12% | Year-ago gap Rs 45 crore |
| Consolidated | Rs 12,115 crore | Rs 10,098 crore | +20.0% (my calculation) | Q2 FY27 gap Rs 39 crore (my calculation) |
| Consolidated, Q1 FY27 | Rs 13,492 crore | Not applicable | Q2 is -10.2% on Q1 | My calculation |
Cite this table: PositionalCalls, “LIC Q2 FY27 Profit Bases, as of 7 November 2026”.
The two bases track each other: the consolidated figure is Rs 39 crore above standalone this quarter against Rs 45 crore a year ago (my calculation), so the choice of basis moves growth by less than 0.2 percentage points (20.12% against 20.0%). The preview carried both bases for this reason, so no figure here needs a restatement. The Rs 12,076 crore headline appears in most reports without a label, and I treat it as standalone because PSU Watch labels it so and its year-ago base of Rs 10,053 crore is the standalone figure from the preview post. Social News XYZ, which carries the consolidated number, also calls the previous quarter “Q1 FY26” and lists Q1’s VNB under Q2, so I use it only for the Rs 12,115 crore and Rs 10,098 crore pair, which agrees with the preview’s consolidated base.
Profit moved down 10.2% from Q1 FY27 (12,115 over 13,492, my calculation). The preview’s scenario table had a row for a 10% fall on Q1, which gave Rs 12,143 crore, so the quarter landed within Rs 28 crore of that row. That does not make it a forecast, because the preview called the rows arithmetic and not predictions. Net investment income rose only about 2.5% to roughly Rs 1.15 trillion (Business Standard), so the 20% profit growth cannot be explained by investment income alone (my reading); the filing’s statement should show the other lines. It does show that a fall from Q1 was a normal outcome for a company whose profit is lumpy, since Q2 FY26 had also fallen 7.8% on Q1 FY25.
One line does not tie from the reports alone. Total income of Rs 2,62,739 crore less total expenses of Rs 2,52,116 crore is Rs 10,623 crore (my calculation), while profit is Rs 12,076 crore, and a year ago the same subtraction gave Rs 9,454 crore against Rs 10,053 crore. The reports do not give the tax and other lines that bridge the difference, so the filing’s statement is the place to settle it.
LIC VNB margin Q2 FY27: why new business missed
VNB was Rs 3,710 crore, up 17.1% on year and 18.3% on Q1, at a 21.82% margin on APE of Rs 17,004 crore; the margin fell 109 bps from Q1 and APE grew only 3.8%, which is why Jefferies called it a miss.
| Measure | Q2 FY27 | Q2 FY26 | Q1 FY27 | Check |
|---|---|---|---|---|
| Value of new business | Rs 3,710 crore | About Rs 3,167 crore | Rs 3,136 crore | 3,710 over 3,167 is +17.1% |
| APE | Rs 17,004 crore | Rs 16,382 crore | About Rs 13,692 crore (derived) | 17,004 over 16,382 is +3.8% |
| VNB margin | 21.82% | 19.33% | 22.90% | 3,710 over 17,004 is 21.82% |
| Half-year VNB | Rs 6,846 crore | Rs 5,111 crore | Not applicable | 3,136 plus 3,710 is 6,846 |
| Half-year APE | Rs 30,696 crore (+5.72%) | About Rs 29,034 crore | Not applicable | Business Standard |
Cite this table: PositionalCalls, “LIC VNB and APE Table, as of 7 November 2026”.
LIC APE growth Q2 FY27 was only 3.8%, and the numbers tie in several directions, which is why I trust them. The derived Q2 FY26 VNB base of about Rs 3,167 crore in the preview post gives +17.1% when set against Rs 3,710 crore, exactly the growth Systematix and Equentis report. Q1 FY27 APE works out to Rs 13,692 crore (30,696 less 17,004, my calculation), and Rs 3,136 crore over that is 22.9%, the Q1 margin in the preview.
Systematix, cited by Business Standard, says a change in the risk-free rate cut the margin by about 120 bps, a better product mix helped, and the shift to larger-ticket ULIPs cut the monthly-mode ULIP share from 24% to 14% over a year. So the LIC Q2 results FY27 show a margin that is higher than a year ago but lower than Q1, on sales that grew slowly.
Net premium income was Rs 1,47,018 crore, up 16.2%, with renewal premium up 5.2%, first-year premium down 3.7% and single premium up about 35%; solvency was 2.35, AUM Rs 59.61 lakh crore and embedded value Rs 7.97 lakh crore, down 1.95%.
| Line | Q2 FY27 | Q2 FY26 | Change | Source and check |
|---|---|---|---|---|
| Net premium income | Rs 1,47,018 crore | Rs 1,26,479 crore | +16.2% | PSU Watch; my division gives 16.24% |
| Renewal premium | Rs 68,375 crore | Rs 64,996 crore | +5.2% | PSU Watch; Indian Masterminds |
| First-year premium | Rs 10,432 crore | Rs 10,836 crore | -3.7% | PSU Watch; Indian PSU |
| Single premium (implied) | About Rs 68,211 crore | About Rs 50,647 crore | +34.7% | My calculation; reports say +35% |
| Assets under management | Rs 59,60,941 crore | Rs 57,22,896 crore | +4.16% | PSU Watch |
| Solvency ratio | 2.35 | 2.13 | Up | PSU Watch only; Q1 FY27 was 2.42 |
| Indian embedded value | Rs 7,97,378 crore | Rs 8,13,230 crore | -1.95% | PSU Watch only |
| Premium by type check | 68,375 + 10,432 + 68,211 | 64,996 + 10,836 + 50,647 | Ties to the totals | My calculation |
Cite this table: PositionalCalls, “LIC Premium and Balance Sheet Table, as of 7 November 2026”.
Premium by type ties. Renewal premium of Rs 68,375 crore plus first-year premium of Rs 10,432 crore leaves Rs 68,211 crore for single premium out of Rs 1,47,018 crore, and the same subtraction a year ago gives Rs 50,647 crore, so single premium rose 34.7% (my calculation) against the 35% in the reports. The 16% jump in the LIC Q2 results FY27 premium line came from one-time premiums, while first-year premium fell.
The balance-sheet lines come from a single report. Solvency of 2.35 is below Q1’s 2.42 but above 2.13 a year ago, and inside the preview’s 2.2 to 2.42 in-line band. Embedded value fell 1.95% while AUM rose 4.16%, which is worth checking in the filing.
PositionalCalls WhatsApp channel
LIC results, explained on WhatsApp
- Profit basis and one-offs stated for each result
- Conflicts between sources shown, not hidden
- The next company on the results calendar
LIC Q2 results FY27 against estimates: VNB and APE below Centrum
Centrum Broking had expected VNB of Rs 4,320 crore, APE of Rs 18,800 crore and a 22.9% margin, so actual VNB was 14.1% lower, APE 9.6% lower and the margin 1.1 percentage points lower (my calculation).
| Measure | Centrum estimate | Actual | Gap (my calculation) | Grade on preview guide |
|---|---|---|---|---|
| Value of new business | Rs 4,320 crore | Rs 3,710 crore | -14.1% | In line (Rs 3,136 to 4,320 crore) |
| APE | Rs 18,800 crore | Rs 17,004 crore | -9.6% | In line (Rs 16,348 to 18,800 crore) |
| VNB margin | 22.9% | 21.82% | -1.1 points | In line (20% to 22.9%) |
| Profit | None found | Rs 12,076 crore (standalone) | No estimate | In line (Rs 10,098 to 13,492 crore) |
Cite this table: PositionalCalls, “LIC Q2 FY27 Estimate Table, as of 7 November 2026”.
Two readings are both true. Against the preview’s own cut-offs, which were built from last year’s base and Q1, every mark lands in the “in line” band. Against the single broker estimate, new business is well short. One house is not a consensus, and the preview said so, but Jefferies independently said VNB missed its estimates because of lower APE and margin (Business Standard). For the LIC Q2 results FY27 that makes the miss a fact about APE: with APE up only 3.8% against the 15% Centrum assumed, even a 22.9% margin would not have reached Rs 4,320 crore (17,004 times 22.9% is Rs 3,894 crore, my calculation).
LIC Q2 results FY27 against the preview marks
Against the preview’s marks, the board date held, profit, VNB, margin, APE and solvency all fell in the in-line bands, the derived VNB base was confirmed, and the only estimate was missed.
| Preview mark | What the preview said | What was reported | Reading |
|---|---|---|---|
| Board date | 5 November, from one secondary report | Results announced after market hours on 5 November | Confirmed |
| Profit base | Q2 FY26 consolidated Rs 10,098 crore; Q1 FY27 Rs 13,492 crore | Consolidated Rs 12,115 crore (+20%); standalone Rs 12,076 crore (+20.12%) | In line |
| Scenario row | A 10% fall on Q1 gives Rs 12,143 crore | Rs 12,115 crore, -10.2% on Q1 | Close to that row |
| VNB base | About Rs 3,167 crore (derived) | +17.1% reported, which implies the same base | Base confirmed |
| VNB | Above Rs 4,320 crore stronger; Rs 3,136 to 4,320 crore in line | Rs 3,710 crore | In line, below Centrum |
| VNB margin | 22.9% or higher stronger; 20% to 22.9% in line | 21.82% | In line |
| APE | Base Rs 16,348 crore (derived) | Rs 17,004 crore against a Rs 16,382 crore base | In line; derived base within Rs 34 crore |
| Net premium base | Rs 1,26,930 crore | Rs 1,26,479 crore implied by PSU Watch | Bases differ by Rs 451 crore |
| Solvency | 2.2 to 2.42 in line | 2.35 (one report) | In line |
| Traps flagged | Six-month VNB is not Q2 VNB; two profit bases | Both appear in the reports | Confirmed |
Cite this table: PositionalCalls, “LIC Q2 FY27 Preview-to-Result Table, as of 7 November 2026”.
The preview’s reading guide did what it was built to do, which was to separate headline growth from quality. Profit growth of 20% is far below the 33.6% a flat quarter would have shown, and the preview’s worked example, with profit of Rs 12,000 crore, VNB of Rs 3,900 crore and APE of Rs 17,700 crore, was close to what arrived. One mark looks off: the preview’s year-ago net premium base of Rs 1,26,930 crore does not match the Rs 1,26,479 crore PSU Watch implies, and I cannot say which has been restated.
LIC fell as much as 4.1% to Rs 391.60 on 6 November, and Jefferies cut its target to Rs 510 from Rs 530 while keeping Buy, as reported; Systematix has Buy at Rs 470. These are brokerages’ views, not PositionalCalls targets.
| Item | Level or view | Source and note |
|---|---|---|
| Previous close (derived) | About Rs 408 | Business Standard back-calculated; not stated; 393.4 over 0.964 is 408.1 (my calculation) |
| 6 Nov, 11:13 AM | Rs 393.4, -3.6% | Business Standard (NSE) |
| 6 Nov intraday low | Rs 391.6, -4.1% | Business Standard; Equentis says Rs 391.60 |
| Official 6 Nov close | Not found | No source gave it |
| Jefferies | Buy; target Rs 510 (from Rs 530) | Business Standard; Whalesbook; 0.6x December 2028 embedded value |
| Jefferies estimates | VNB estimates for FY28 and FY29 cut 3% | Equentis; cites lower yield-curve benefit |
| Systematix | Buy; target Rs 470 | Business Standard; calculated VNB Rs 3,710 crore |
| Gap to Rs 393.4 (my calculation) | Jefferies +29.6%; Systematix +19.5% | Arithmetic on an intraday price, not a forecast |
Cite this table: PositionalCalls, “LIC Share Price and Brokerage Views After Q2 FY27, as of 7 November 2026”.
After the LIC Q2 results FY27, the two views I found agree on direction but not on level, and I found no wider poll. Jefferies expects APE to grow 11% a year to FY29 with margins rising to 23%, and cites LIC’s 40% share of retail weighted received premium (Business Standard). Systematix says management expects APE growth to improve in the second half on a ULIP recovery, with non-par savings, protection, deferred annuity, health and cancer products helping. Equentis lists Rs 390 to Rs 392 as a reference zone after the low and Rs 400 as a round-number level, and says the first is not a confirmed support. Those are descriptions of a chart, not advice.
LIC and the IDBI Bank stake sale: what it means for the Q2 results
The Cabinet cleared the sale of 60.72% of IDBI Bank to Fairfax for Rs 52,878 crore on 14 October, of which LIC sells 30.24% and keeps 19%, but I found no report that the deal has closed, so I do not expect it in Q2 profit.
| Item | Figure | Source and check |
|---|---|---|
| Deal value | Rs 52,878.08 crore for 60.72% | Business Today, 14 October 2026 |
| Price | Rs 81 a share against a fair value of Rs 75.99 | Business Today |
| Government sells | 30.48%, keeps 15% | Business Today; PSU Watch gives 45.48% before |
| LIC sells | 30.24%, keeps 19% | Business Today; PSU Watch gives 49.24% before |
| Still needed | RBI fit-and-proper check and a compliance roadmap | Business Today; no completion date given |
Cite this table: PositionalCalls, “LIC IDBI Stake Sale Table, as of 7 November 2026”.
The holdings tie: 30.48% plus 30.24% is 60.72%, 49.24% less 30.24% leaves LIC at 19%, and 45.48% less 30.48% leaves the government at 15% (my calculation). Business Today also reported LIC shares up about 2% on 15 October after the approval. Because the sale needs regulatory steps and I found no completion report, a sale gain would not be in the LIC Q2 results FY27; check the filing’s notes to confirm how LIC treats the holding.
What LIC management said after the Q2 results
As relayed by Systematix, management expects APE growth to improve in the second half of FY27, helped by a recovery in ULIPs and by newly launched deferred annuity, health and cancer protection products.
- Product mix: a better mix helped the margin, while the risk-free rate change cost about 120 bps (Systematix via Business Standard).
- Group business: group APE grew 16.5% while individual APE fell 4.1% in the quarter (Equentis), and Business Standard notes group is sensitive to rates, competition and large international deals.
- Asset quality: the gross NPA ratio was 1.16% against 1.21% in the previous quarter (Indian Masterminds).
- Dividend: none of the reports I opened mentions an interim dividend for this quarter; confirm on the BSE or NSE announcement page.
The outlook is the main open question after the LIC Q2 results FY27. If the second-half ULIP recovery comes, APE growth should move above 3.8%, but the company gave no number in the sources I opened. See the ITC Q2 results and SBI Q2 results for how other large companies are reading the same quarter. Different sectors, so only the method carries over.
What ties and what does not in the LIC Q2 results FY27
Eight checks tie, and four do not: the year-ago premium base, the basis of the profit headline, the income-less-expenses gap and the single-source balance-sheet lines.
Because of these gaps, any number you quote from the LIC Q2 results FY27 should carry its basis. The filing’s results statement and the press release settle most of them, and both are free on the BSE and NSE pages. Treat any message promising a sure-shot call on LIC as unreliable.
Risks to read with the LIC Q2 results FY27
Analyst’s note on the LIC Q2 results FY27
The quarter shows steady profit and strong premium headlines sitting on weak new-sales growth, which is exactly the gap the preview told readers to look for.
- What stands out: profit +20% and premium +16% against APE +3.8% and first-year premium -3.7%.
- Easy to miss: a 21.82% margin is above last year’s 19.33% but below Q1’s 22.90%, so margin explains growth only against last year.
- What would change the view: a filing note showing APE or margin different from the reports, or a restated premium base.
- Caution: one quarter does not fix a long-term value, and the two targets I found differ by Rs 40.
- Reader action: read APE and the VNB margin before the profit headline.
Bottom line
The LIC Q2 results FY27 show standalone profit of Rs 12,076 crore (+20%) and VNB of Rs 3,710 crore (+17.1%), 14.1% below Centrum’s estimate, on APE growth of only 3.8%. Premium income rose 16% on single premium. Jefferies cut its target to Rs 510 and Systematix has Rs 470 as reported, and the shares fell as much as 4.1% on 6 November. Read APE and the margin in the filing and speak to a registered adviser before acting.
Next read: the preview post for the marks set before the results.
Part of the Earnings series.
PositionalCalls WhatsApp channel
Never miss a results update
- Same-day decoders with the numbers sourced
- Corrections posted openly when a number changes
- Plain-language risk notes
LIC Q2 results FY27: frequently asked questions
What are the LIC Q2 results FY27?
LIC reported standalone net profit of Rs 12,076 crore, up 20.12%, and net premium income of Rs 1,47,018 crore, up 16.2%, for the quarter ended 30 September 2026. Results came after market hours on 5 November 2026.
What is LIC’s consolidated profit in Q2 FY27?
A wire report gives consolidated profit of Rs 12,115 crore, up 20% from Rs 10,098 crore. Most reports quote Rs 12,076 crore without a label, and PSU Watch calls it standalone.
What was LIC’s value of new business in Q2 FY27?
VNB was Rs 3,710 crore, up 17.1% on year and 18.3% on Q1, with a margin of 21.82%. The half-year figure is Rs 6,846 crore, up 33.95%.
Did LIC miss VNB estimates in Q2 FY27?
Against Centrum’s Rs 4,320 crore estimate, VNB was 14.1% lower (my calculation), and Jefferies said VNB missed its estimates on lower APE and margin. Centrum is the only estimate I found with numbers.
What was LIC’s APE and VNB margin in Q2 FY27?
APE was Rs 17,004 crore, up 3.8%, and the VNB margin was 21.82%, up 249 bps on year and down 109 bps on Q1. Half-year APE was Rs 30,696 crore, up 5.72%.
Net premium income rose 16.2% to Rs 1,47,018 crore. Renewal premium rose 5.2%, first-year premium fell 3.7% to Rs 10,432 crore, and single premium rose about 35%.
What are LIC’s solvency ratio, AUM and embedded value?
One report (PSU Watch) gives solvency of 2.35, AUM of Rs 59,60,941 crore (+4.16%) and embedded value of Rs 7,97,378 crore (-1.95%). Confirm in the filing.
LIC fell as much as 4.1% to Rs 391.60 on 6 November and traded at Rs 393.4, down 3.6%, at 11:13 AM, per Business Standard. The previous close was about Rs 408 (derived); the official close was not found.
What are the brokerage targets for LIC after Q2?
As reported on 6 November: Jefferies Buy with a target of Rs 510 (cut from Rs 530) and Systematix Buy at Rs 470. These are brokerages’ views, not PositionalCalls targets or advice.
Did LIC declare a dividend, and what about the IDBI Bank sale?
None of the reports I opened mentions a dividend. The Cabinet cleared the IDBI Bank sale to Fairfax on 14 October (LIC sells 30.24%, keeps 19%), but I found no report that it has closed. Confirm on the BSE or NSE page.
Sources
- PSU Watch, 5 November 2026, 5:02 PM (standalone figures, solvency, H1 VNB)
- Business Standard, 6 November 2026 (VNB miss, APE, Jefferies, Systematix)
- Equentis, 6 November 2026 (VNB, margin, APE, price levels)
- Indian Masterminds, 5 November 2026 (premium lines, GNPA)
- Indian PSU, 5 November 2026 (premium lines)
- Social News XYZ, 5 November 2026 (consolidated Rs 12,115 crore)
- Whalesbook, 6 November 2026 (Jefferies target cut)
- Business Today, 14 October 2026 (IDBI Bank stake sale)
- Goodreturns, 23 October 2026 (Centrum estimates)
- Kotak Neo, August 2026 (Q1 FY27 results)
- Angel One, 7 November 2025 (Q2 FY26 base)
- BSE and NSE announcement pages: where the LIC filing is published (I did not open it).
Disclosure: PositionalCalls.com is not a SEBI-registered research analyst or investment adviser. Investments in securities markets are subject to market risks. Read all related documents carefully before investing. Returns are never guaranteed. PositionalCalls is an independent Indian stock market research and education site founded by Shubham Chaudhary. This page is results analysis and not a recommendation, target or investment advice. How I researched this: I compared six press and data-platform reports of the filing, tied the half-year VNB, the margin, APE, premium lines and IDBI holdings, recomputed every derived number, and listed the conflicts openly. I did not open the filing.

Shubham Chaudhary is the founder of PositionalCalls, an independent Indian stock market research website. He writes company fundamentals, quarterly results analysis, IPO analysis and sector research for NSE and BSE listed companies, with a focus on banking stocks, insurance and long-term value investing. Every article is built from primary sources such as RBI, SEBI, NSE and BSE filings and company annual reports, and states its risks plainly in simple language for retail investors.
Coverage areas Our research standards- Numbers checked against NSE, BSE and SEBI filings
- Risks and limits stated in every article
- No paid promotions or broker tie-ups
- Articles updated when new filings arrive