
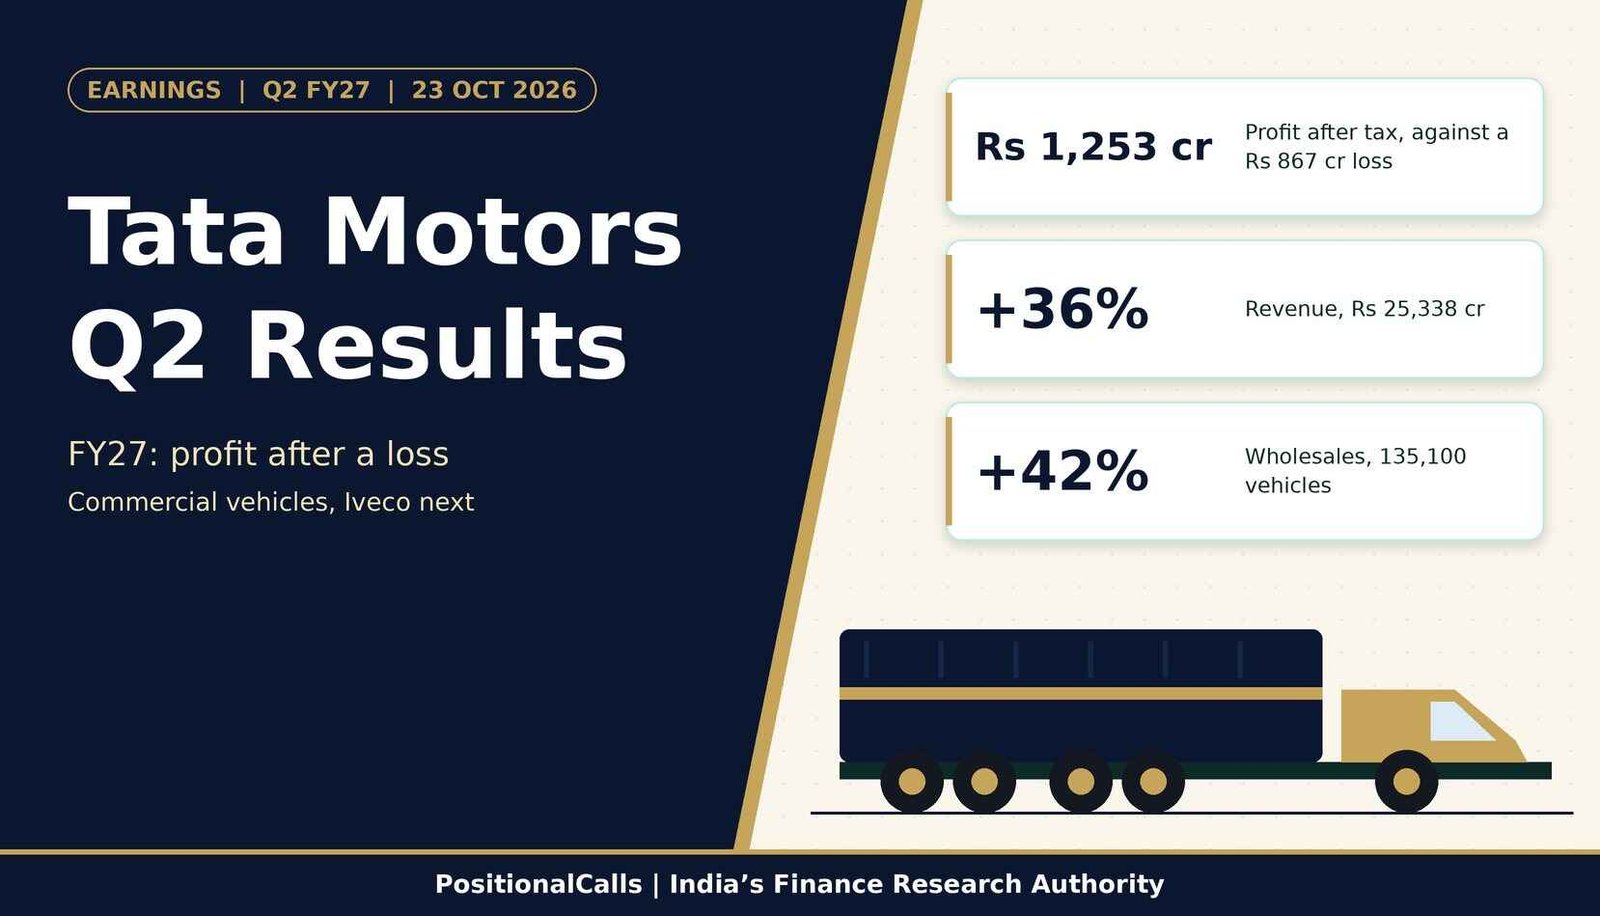
Earnings · Tata Motors
Tata Motors, the commercial vehicle company, swung to a profit in the September quarter on 42% higher wholesales. This page shows which profit number to trust, what drove growth and how the Iveco deal changes the next quarter.
Quick answer
Tata Motors Q2 results for FY27: Tata Motors Limited, the commercial vehicle company, reported consolidated revenue of Rs 25,338 crore (+36%), EBITDA of Rs 2,770 crore (+31%) and profit after tax of Rs 1,253 crore against a loss of Rs 867 crore a year ago. Wholesales rose 42% to 135,100 vehicles. Results came on Friday, 23 October 2026.
Latest update (Wednesday, 4 November 2026, 5:30 PM IST): Results were announced on Friday, 23 October 2026. The Iveco tender offer closed on Monday, 26 October 2026 with provisional acceptances of 87.81%, and reports after 30 October describe the initial settlement as completed. I did not find a confirmed Tata Motors share price after 27 October 2026. The next dated events are the Q3 FY27 results date, not yet announced, and the Iveco additional acceptance period in November.
Key takeaways
- Profit: Consolidated profit after tax was Rs 1,253 crore against a loss of Rs 867 crore a year ago. Other outlets show Rs 1,254 crore and Rs 1,257 crore.
- Revenue and EBITDA: Revenue Rs 25,338 crore (+36%); EBITDA Rs 2,770 crore (+31%) at a 10.9% margin, down from 11.3% a year ago.
- Volumes: Wholesales were 135,100 units (+42%). International sales rose 177% to 21,100 units, about one-third of the unit growth (my calculation).
- Standalone: Standalone revenue was Rs 23,930 crore (+42%) at an 11.7% EBITDA margin. Reported standalone profit differs by source: Rs 2,138 crore or Rs 2,062 crore.
- Iveco: The Iveco tender offer at €14.40 a share drew provisional acceptances of 87.81% of capital. Iveco is not in these Q2 numbers.
- Which company: This is the commercial vehicle company. Passenger vehicles and Jaguar Land Rover sit in Tata Motors Passenger Vehicles, which reports separately.
In plain words: Tata Motors Limited now makes trucks, buses and small commercial vehicles. A wholesale is a vehicle sold to a dealer, not to the end buyer. EBITDA is profit before interest, tax, depreciation and amortisation. Consolidated figures add the subsidiaries; standalone figures cover the parent company alone.
Data note: as of Wednesday, 4 November 2026, 5:30 PM IST. I could not open the company release or the exchange filing in full, so figures come from press and data-platform reports of the results and a summary of the BSE board outcome. Where sources disagree I show the range and say so. Share-price figures are as reported. Several sources are AI-assisted summaries, so treat single-source figures as reported, not confirmed. Correction: the year-ago profit of Rs 530 crore that appears in one report is the first-half FY26 figure, not the Q2 FY26 loss of Rs 867 crore.
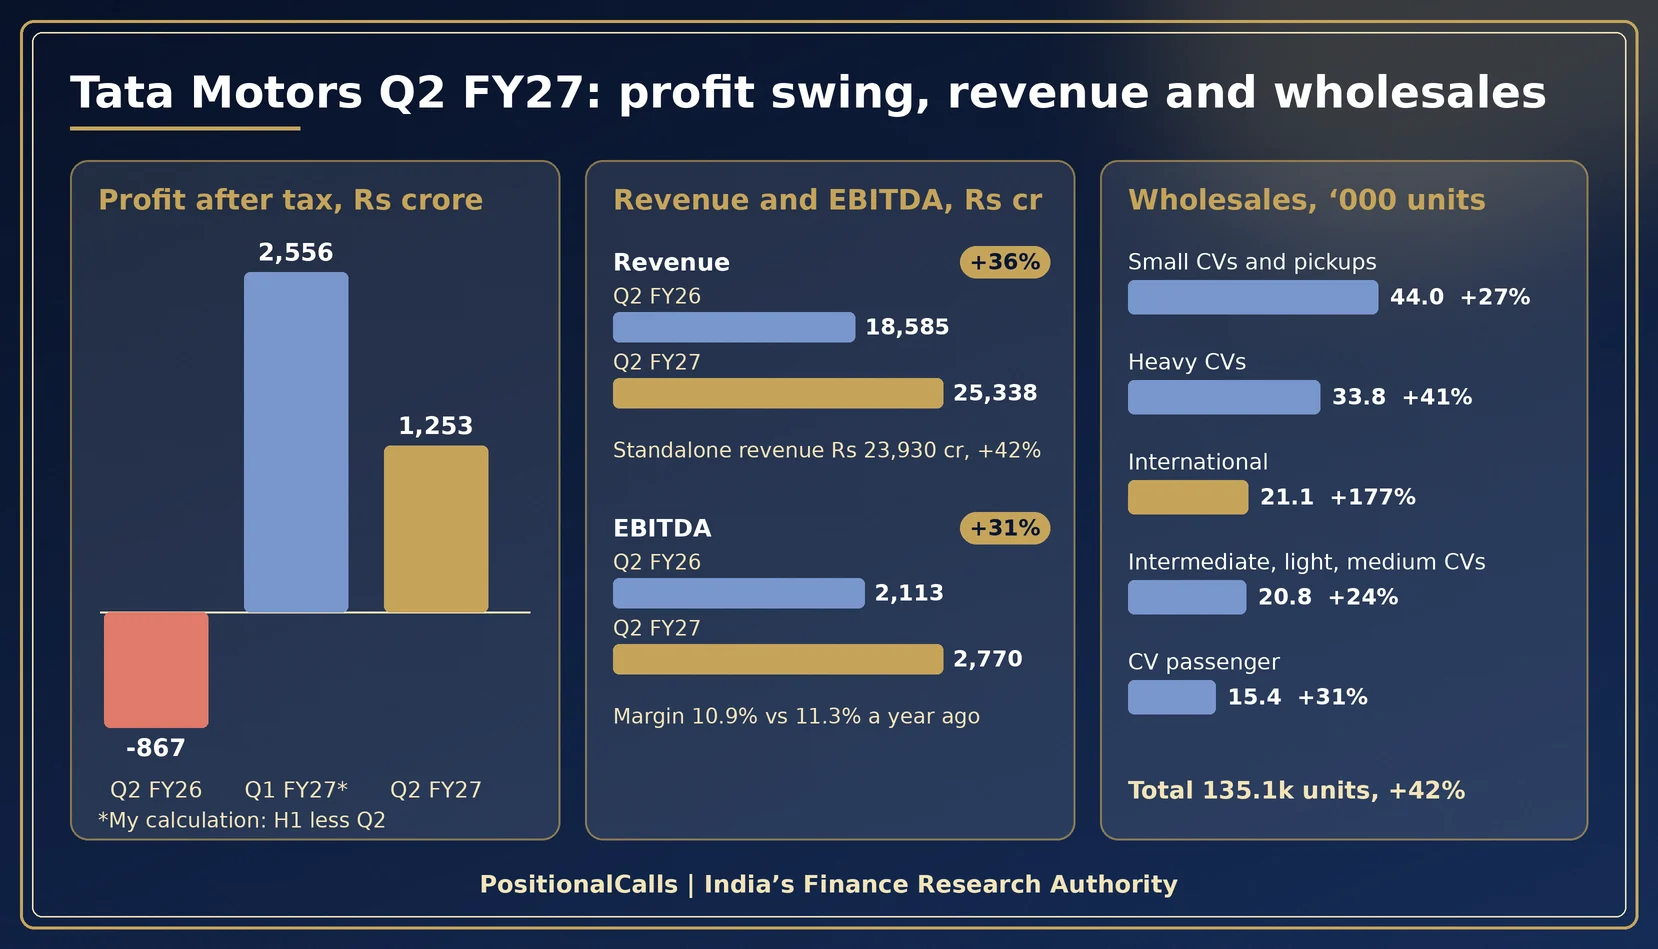
Tata Motors Q2 results FY27: key numbers at a glance
Tata Motors Q2 results show a turnaround: consolidated profit after tax of Rs 1,253 crore against a Rs 867 crore loss, on revenue up 36% and wholesales up 42%.
| Consolidated, Rs crore | Q2 FY27 | Q2 FY26 | Change | Why it matters |
|---|---|---|---|---|
| Revenue from operations | 25,338 | 18,585 | +36.3% | Volume and price both helped |
| EBITDA | 2,770 | 2,113 | +31.1% | Operating profit before interest, tax and depreciation |
| EBITDA margin (my calculation) | 10.9% | 11.4% | -0.4 pt | Commodity costs trimmed the margin |
| EBIT | 2,274 | 1,630 | +39.5% | Operating profit after depreciation |
| Profit before tax | 1,998 | -561 | Swing to profit | After an exceptional item of Rs 218 crore |
| Profit after tax | 1,253 | -867 | Swing to profit | Headline profit in two reports of the investor presentation |
Cite this table: PositionalCalls, “Tata Motors Q2 Results Key Numbers Table, as of 4 November 2026”.
These Tata Motors Q2 results are for the quarter ended 30 September 2026. The company’s own pages are the Tata Motors Limited Q2 FY27 results release and the BSE board outcome filing of 23 October 2026. For other companies reporting in the same weeks, see the Q2 results calendar.
Which Tata Motors is this? Commercial vehicles, not passenger cars
These Tata Motors Q2 results are for Tata Motors Limited, formerly TML Commercial Vehicles Limited, which trades as TMCV on NSE; passenger cars, electric cars and Jaguar Land Rover sit in Tata Motors Passenger Vehicles.
After the Tata group split its auto business, two listed companies carry the Tata Motors name. Many pages mix them, and so do many searches. The table sets out which one reports what, so you do not compare the wrong numbers.
| Company | What it makes | Ticker as reported | Q2 FY27 status in this post |
|---|---|---|---|
| Tata Motors Limited (formerly TML Commercial Vehicles Limited) | Trucks, buses, small commercial vehicles, commercial EVs, Iveco after the deal | TMCV on NSE | Results covered here, announced 23 October 2026 |
| Tata Motors Passenger Vehicles Limited | Cars, SUVs, electric cars, Jaguar Land Rover | TMPV on NSE | I did not find its Q2 FY27 results as of Wednesday, 4 November 2026, 5:30 PM IST |
| Older posts and searches | Pre-split Tata Motors results | Not applicable | See the Tata Motors Q3 results analysis for the earlier, pre-split quarter |
Cite this table: PositionalCalls, “Tata Motors Entity Map, as of 4 November 2026”.
The practical rule: a headline that says “Tata Motors Q2 profit Rs 1,253 crore” is about the commercial vehicle company. A headline about Jaguar Land Rover sales or the Nexon belongs to the passenger vehicle company. If you hold both shares, you need both sets of results.
The older page on this site, the Tata Motors Q3 results analysis, covers an earlier quarter and is kept for that history. It does not describe the current structure.
What was Tata Motors’ net profit in Q2 FY27, and which figure is right?
The Tata Motors net profit Q2 FY27 headline is consolidated profit after tax of Rs 1,253 crore against a loss of Rs 867 crore; reports also show Rs 1,254 crore, Rs 1,257 crore and a standalone figure above Rs 2,000 crore.
Search for the Tata Motors Q2 results and you will see at least five profit numbers. Most are real figures measuring different things. A few are mislabelled.
| Figure shown | Value, Rs crore | What it appears to be | Source and my label |
|---|---|---|---|
| Consolidated PAT | 1,253 | Profit after tax of the group | Kotak Neo and an investor-presentation summary: used in this post |
| Consolidated PAT, variant | 1,254 | Same line, rounded differently | Univest: treated as the same figure |
| Profit attributable to shareholders | 1,257 | Reported as profit for owners of the parent | Free Press Journal and a data platform; confirm in the filing |
| Standalone profit, filing summary | 2,138 | Parent company only; loss of Rs 1,021 crore a year ago | Summary of the BSE board outcome |
| Standalone profit, press report | 2,062 | Reported as net profit against a Rs 1,107 crore loss | The Week; conflicts with the line above |
| Year-ago profit shown as 530 | 530 | First-half FY26 profit, not the quarter | Mislabelled in one report; see the Data note |
Cite this table: PositionalCalls, “Tata Motors Q2 Results Profit Definitions and Conflicts, as of 4 November 2026”.
Three rules explain most of the confusion. First, consolidated and standalone are different companies in accounting terms: the consolidated line adds subsidiaries and the standalone line does not. Second, profit for the period and profit attributable to owners can differ when minority shareholders hold part of a subsidiary. Third, aggregators sometimes show a half-year number in a quarter column.
My rule in this post: I use Rs 1,253 crore as the consolidated headline because two independent summaries of the company’s own presentation agree on it, and I name every other line when it appears. The standalone profit is left as a range because I could not open the filing.
How did Tata Motors swing from a Rs 867 crore loss to a Rs 1,253 crore profit?
Better operating profit explains only about 28% of the Rs 2,331 crore swing in profit before tax; most of the rest sits below the operating line and needs the filing to explain.
Profit after tax moved by Rs 2,120 crore in a year, from a loss of Rs 867 crore to a profit of Rs 1,253 crore. I broke the improvement in pre-exceptional profit before tax into the parts I can see.
| Step | Rs crore | How I calculated it |
|---|---|---|
| PBT before exceptional items, Q2 FY26 | -551 | Loss reported in a Kotak Neo summary |
| Gain from higher EBIT | +644 | EBIT of 2,274 less 1,630 |
| Gain from lower finance cost | +149 | Consolidated finance cost of 107 against 256 |
| Gain from lines I cannot see | +1,538 | Remainder; other income, joint ventures and other items |
| PBT before exceptional items, Q2 FY27 | 1,780 | Kotak Neo summary; the steps add up to it |
Cite this table: PositionalCalls, “Tata Motors Q2 Results Profit Swing Bridge, as of 4 November 2026”.
EBIT rose Rs 644 crore, or about 40%. The pre-exceptional profit before tax rose Rs 2,331 crore. So operations explain about 28% of the improvement and lower interest another 6%. The remaining Rs 1,538 crore, about 66%, comes from items between EBIT and profit before tax.
I could not see those items. A year-ago quarter that included large charges, or a current quarter with higher other income, would each produce this pattern. This is the first thing to check in the filing, and I will update this page once it is open.
An exceptional item of Rs 218 crore then takes profit before tax from Rs 1,780 crore to Rs 1,998 crore. Because the total is higher after the item, the arithmetic says it was a gain, although one report calls it a loss (my calculation; the filing note will confirm).
Why did EBITDA grow 31% while the margin slipped? The sales-versus-margin bridge
Tata Motors EBITDA margin Q2 FY27 was 10.9% against 11.3%; extra sales added about Rs 768 crore of EBITDA and the lower margin took away about Rs 111 crore, on my bridge.
EBITDA rose Rs 657 crore, from Rs 2,113 crore to Rs 2,770 crore. I split the rise into what the extra revenue would have earned at last year’s margin, and what the change in margin did.
| Step | Rs crore | How I calculated it |
|---|---|---|
| Q2 FY26 EBITDA | 2,113 | Investor-presentation summary |
| Sales effect | +768 | Revenue rise of Rs 6,753 crore times the year-ago margin of 11.4% |
| Margin effect | -111 | Q2 FY27 revenue times the margin change of -0.44 percentage points |
| Q2 FY27 EBITDA | 2,770 | The three steps add up to it |
Cite this table: PositionalCalls, “Tata Motors Q2 Results EBITDA Bridge, as of 4 November 2026”.
Management blamed commodity costs, particularly steel and rubber, according to one summary of the earnings call. That summary is AI-assisted and a single source, so I treat the explanation as reported, not confirmed. The same summary shows a bridge in which variable costs rose Rs 1,416 crore, offset by volume and mix of Rs 1,159 crore and net realisation of Rs 1,017 crore.
Standalone figures tell the same story with a higher margin. Standalone EBITDA was Rs 2,806 crore at 11.7% of Rs 23,930 crore revenue (my calculation matches the reported margin), and one report puts it 90 basis points lower than a year ago. A basis point is one hundredth of a percentage point, so 90 basis points is 0.9 points.
What drove Tata Motors wholesales in Q2 FY27?
Tata Motors CV wholesales Q2 FY27 were 135,100 units, up 42%; heavy trucks grew 41%, small commercial vehicles 27% and international sales 177%, helped by an Indonesia order.
| Segment | Q2 FY27 units | Growth year on year | Share of total (my calculation) |
|---|---|---|---|
| Heavy commercial vehicles | 33,800 | +41% | 25% |
| Intermediate, light and medium CVs | 20,800 | +24% | 15% |
| Small CVs and pickups | 44,000 | +27% | 33% |
| CV passenger (buses) | 15,400 | +31% | 11% |
| International business | 21,100 | +177% | 16% |
| Total | 135,100 | +42% (95,000 a year ago) | 100% |
Cite this table: PositionalCalls, “Tata Motors Q2 Results Wholesales Mix, as of 4 November 2026”.
The segments add up to the total. Taking the 177% growth, international wholesales a year ago were about 7,617 units, so domestic wholesales were about 114,000 against 87,383, a rise of about 30% (my calculation, which matches the reported 30% domestic growth).
That means international sales supplied roughly 34% of the extra units. Reports link the jump to a single Indonesia order, so the 42% total growth is less repeatable than the domestic 30%. The company says it outgrew the industry, which one report puts at 28%. In short, the Tata Motors Q2 results are a volume story first and a margin story second.
Electric volumes rose 143%. Kotak Neo reports more than 4,400 small commercial EV retail sales. One summary adds that Delhi and the National Capital Region plan an EV-only registration requirement from 1 January 2027, a point to verify before relying on it.
PositionalCalls WhatsApp channel
Tata Motors Q3 and Iveco: get the number that matters
- The base to beat and wholesales table before the next Tata Motors result
- Which profit line each report is using, flagged clearly
- Iveco and dividend dates the day they appear
Tata Motors’ domestic commercial vehicle market share was 36.2% in H1 FY27, up 110 basis points from FY26, according to VAHAN registration data cited by management.
| Segment | H1 FY27 market share | Change versus FY26 | Source |
|---|---|---|---|
| Overall domestic CV | 36.2% | +110 bps | The Week and Investing.com |
| Heavy commercial vehicles | 55.7% | +50 bps | One summary; single source |
| CV passenger | 41.1% | +500 bps | One summary; single source |
| Small CV pickups | 27.6% | +130 bps | One summary; single source |
Cite this table: PositionalCalls, “Tata Motors Q2 Results Market Share Table, as of 4 November 2026”.
Market share here is measured on registrations, not on the wholesales the company reports. The two can differ in a quarter when dealers build or run down stock. A rising share on registrations is a stronger signal than a rise in dispatches alone.
For the competing view, read the peer pages: Ashok Leyland Q3 results for the nearest listed commercial vehicle rival, and the Eicher Motors Q3 results for the Volvo Eicher joint venture context. Both are older quarters and are labelled so.
Standalone versus consolidated: why the two profit numbers differ so much
Standalone profit of about Rs 2,100 crore is far above consolidated profit of Rs 1,253 crore, so subsidiaries and consolidation items pulled the group number down; the filing gives the reason.
| Rs crore | Standalone | Consolidated | Note |
|---|---|---|---|
| Revenue from operations | 23,930 (+42%) | 25,338 (+36%) | Standalone includes Tata Cummins per one summary |
| EBITDA and margin | 2,806 (11.7%) | 2,770 (10.9%) | Standalone margin is higher |
| Profit before tax | 2,878, after exceptional items | 1,998, after exceptional items | BSE summary and Kotak Neo |
| Profit after tax | 2,138 or 2,062 | 1,253 | Standalone sources conflict |
| Finance cost | 52 (186 a year ago) | 107 (256 a year ago) | Investor-presentation summary |
Cite this table: PositionalCalls, “Tata Motors Q2 Results Standalone Versus Consolidated, as of 4 November 2026”.
Standalone revenue is only about Rs 1,400 crore lower than consolidated revenue, but standalone profit before tax is Rs 880 crore higher. That is unusual. Normally the group earns more than the parent. I did not find the reason in the reports I reviewed, so I am not guessing; it may relate to how subsidiary results or intra-group income are treated.
The Tata Motors Q2 results therefore look very different on the two bases. For shareholders the consolidated number is the one that matches the group’s claim on earnings, and it is the line most investors compare year on year. The standalone number matters for dividend capacity. Check both against the exchange filing before using either in a model.
How does the Tata Motors Iveco acquisition change the next quarter?
Iveco is not in the Q2 numbers; the tender offer at €14.40 a share drew provisional acceptances of 87.81% of capital, and consolidation is reported to start next quarter, so Q3 FY27 will not be like for like.
| Date | Event | Source type |
|---|---|---|
| 9 October 2026 | Offer price raised from €14.10 to €14.40 a share; company said no further increase | Investing.com and Business Today |
| 16 October 2026 | Iveco shareholders approved the related resolutions at their meeting | Free Press Journal |
| 26 October 2026 | Offer acceptance period closed | Business Today |
| 27 October 2026 | Provisional acceptances of 238.16 million shares, 87.81% of capital | Business Today |
| 30 October 2026 | Initial settlement scheduled; later reports describe it as completed | Company schedule and press |
| November 2026 | Further acceptance period reported; dates not confirmed here | Headline only |
Cite this table: PositionalCalls, “Tata Motors Iveco Offer Timeline, as of 4 November 2026”.
My arithmetic: 238.16 million shares at €14.40 is about €3.43 billion, which matches the reported value of the tendered shares. Including treasury shares of about 1.8% of capital, reports put the potential stake at 89.42%. The whole offer is reported at about €3.91 billion, or about Rs 42,561 crore. A separate report gave an outlay of Rs 34,778 crore at the raised price, and the basis for the difference is not stated.
Why it matters for readers of the Q2 numbers: once Iveco is consolidated, revenue, debt and margins in the Q3 FY27 results will include a large European business. Year-on-year growth rates will jump for reasons unrelated to Indian demand, and margins may move because the mix changes. A sensible reader will ask for organic figures with and without Iveco.
How does the cash position compare with the Iveco payment?
One report puts consolidated net cash at Rs 15,900 crore and standalone net cash at Rs 11,300 crore, far below the Rs 34,778 to Rs 42,561 crore reported for the Iveco offer, so funding matters.
| Item | Rs crore | Basis |
|---|---|---|
| Standalone net cash | 11,300 | Investing.com summary; AI-assisted, single source |
| Consolidated net cash | 15,900 | Same summary; another line in a different report is inconsistent |
| Iveco offer, lower report | 34,778 | Free Press Journal, at the raised price |
| Iveco offer, higher report | 42,561 | Business Today, about €3.91 billion |
| Illustrative gap if paid from cash alone | 18,878 to 26,661 | My calculation; funding mix not confirmed |
Cite this table: PositionalCalls, “Tata Motors Q2 Results Net Cash Versus Iveco Offer, as of 4 November 2026”.
The gap is an illustration, not a forecast. A company usually funds an acquisition from cash, borrowing or both, and Iveco brings its own cash and debt when consolidated. A headline from Angel One refers to final external commercial borrowing approval for the deal, which suggests part of the funding is borrowed. I did not open that report.
Watch three lines in the Q3 FY27 results: net debt, finance cost and the net debt to EBITDA ratio. Those will show how the Iveco payment changes the balance sheet far more clearly than the Q2 net cash figure does.
The shares closed at Rs 396 on Friday, 23 October 2026, down 4.41%, the day of the results, and traded near Rs 388 on Tuesday, 27 October 2026; I did not find a later confirmed price.
| Date and time (IST) | Reported price or move | Source type |
|---|---|---|
| Fri 23 Oct, close | Rs 396 on NSE, down 4.41% | Kotak Neo |
| Fri 23 Oct, five-day view | Nearly 6% lower over five sessions | The Week |
| Tue 27 Oct, 9:04 AM | Rs 388.00, a move of 1.03% (direction not clear in the text) | Business Today |
| After 27 Oct | Not confirmed as of Wednesday, 4 November 2026, 5:30 PM IST | Not found |
Cite this table: PositionalCalls, “Tata Motors Q2 Results Share Price Trail, as of 4 November 2026”.
Reports on the results were posted from 4:42 PM IST, after the 3:30 PM market close, so the Friday fall came before the numbers were public (my reading of the timestamps). One report gives the price in dollars, which is an error because the shares trade in rupees on NSE. I use the rupee figures.
PositionalCalls is not a SEBI-registered research analyst, so this page does not publish price targets or buy, sell or hold views. A brokerage note I found on the commercial vehicle company dates from 24 June 2026, so I did not use it as a view on these results.
How do the Tata Motors Q2 results compare with Q1 FY27 and a year ago?
Q2 revenue rose about 23% over Q1 FY27 but profit after tax fell about 51% from Rs 2,556 crore, so the headline profit is lower than the previous quarter.
| Rs crore, consolidated | Q2 FY27 | Q1 FY27 (my calculation) | Q2 FY26 |
|---|---|---|---|
| Revenue from operations | 25,338 | 20,667 | 18,585 |
| Profit after tax | 1,253 | 2,556 | -867 |
| H1 FY27 revenue and PAT | 46,005 and 3,809 | Half-year totals | H1 FY26 PAT 530 |
Cite this table: PositionalCalls, “Tata Motors Q2 Results Three-Period Comparison, as of 4 November 2026”.
I calculated Q1 FY27 by subtracting Q2 from the half-year totals: revenue of Rs 46,005 crore less Rs 25,338 crore, and profit of Rs 3,809 crore less Rs 1,253 crore. A data platform reports Q1 profit of about Rs 2,560 crore, which agrees. One report gives half-year revenue of Rs 45,808 crore, which conflicts with Rs 46,005 crore; I used the figure that is consistent with a Q1 revenue of about Rs 20,700 crore.
The fall from Rs 2,556 crore to Rs 1,253 crore is large for a quarter in which revenue grew 23%. I did not find a stated reason. It could reflect one-off items in Q1, tax or other lines, so a year-on-year view is safer than a sequential one for a business with this kind of swing.
What did Tata Motors say about demand and costs for Q3 FY27?
One summary of the earnings call says demand growth should moderate to high single digits or low double digits in Q3 FY27, with additional commodity cost pressure of 150 to 200 basis points; this is a single AI-assisted source.
| Topic | Reported commentary | Label |
|---|---|---|
| Q3 demand | Growth to moderate to high single digit or low double digit | Single source; the same page has inconsistencies |
| Segment outlook | Intermediate and CV passenger double digit; heavy and small CVs higher single digit | Single source |
| Commodity costs | Extra pressure of 150 to 200 bps in Q3, depending on settlement timing | Single source |
| Pricing | Price actions of about 1% in January, 2% in April, 2.5% in July and 1% to 2% from 1 October | Single source |
| Small CV EV share | Target of about 20% by FY2028 from 12% | Single source |
Cite this table: PositionalCalls, “Tata Motors Q2 Results Outlook Commentary, as of 4 November 2026”.
I would not build a view on these lines until the earnings-call transcript or the investor presentation confirms them. They are useful as questions to ask when the Q3 FY27 results arrive: did growth moderate as said, and did the extra commodity cost show up in the margin?
How to read the next Tata Motors results: a decoder
At Q3 FY27, check organic wholesale growth, the EBITDA margin against 10.9%, and how Iveco changes revenue, debt and margins.
| What to read | Q2 FY27 mark | Question to ask |
|---|---|---|
| Wholesale growth | 135,100 units, +42% | How much is the Indonesia order and how much is domestic? |
| Consolidated EBITDA margin | 10.9% | Did the 150 to 200 bps commodity pressure arrive? |
| Domestic market share | 36.2% in H1 | Did share keep rising on registrations? |
| Profit after tax | Rs 1,253 crore | What explains the fall from Q1 FY27? |
| Iveco | Not consolidated | What are organic and Iveco-inclusive numbers? |
| Net debt | Net cash Rs 15,900 crore, one report | How much did the Iveco payment change it? |
Cite this table: PositionalCalls, “Tata Motors Q2 Results Decoder, as of 4 November 2026”.
The Tata Motors Q2 results set the marks in the middle column. No Q3 FY27 results date is confirmed as of Wednesday, 4 November 2026, 5:30 PM IST. Q3 results for large Indian companies usually come between late January and mid-February, and the board will announce the date through an exchange intimation.
What most people miss in the Tata Motors Q2 results
Most pages repeat the profit swing; the details that change the picture are the entity confusion, the one-third of growth from export, the mixed profit definitions and the Iveco effect on Q3.
The Tata Motors Q2 results alone need no action, and the reports I reviewed did not mention a dividend with these results, so check the exchange filing before assuming one.
- What you need: nothing special. The shares trade on NSE and BSE like any other listed stock.
- Tax angle: gains on sale and any dividend are taxed under current rules. Check our guide to capital gains tax on shares or ask a tax adviser.
- NRI note: NRIs buy through a PIS account with limits that changed in 2026. See NRI investment in the Indian stock market.
- Costs: brokerage and demat charges vary, so check your broker’s current schedule.
- Scam warning: fake “results alert” groups and tip sellers use well-known company names. No genuine result needs your OTP or an app download.
Related auto and industrial results: Mahindra and Mahindra Q2 results preview, Maruti Suzuki Q2 results, TVS Motor Q2 results, Tata Steel Q2 results for the steel cost side and Adani Ports Q2 results for the logistics side. More in auto results.
Analyst’s note
- What stands out: a swing to profit on strong volumes, with the margin and the profit definitions both needing care.
- Easy to miss: export growth and the Iveco effect on the next quarter, both explained above.
- What would change the view: the filing showing that one-off items drove the profit swing, or Q3 margins falling by the reported 150 to 200 basis points.
- Caution: several sources for this result are AI-assisted summaries that disagree with each other, so single-source figures are reported, not confirmed.
- Reader action: open the BSE filing, confirm the profit lines and the exceptional item, and check which company a headline is about.
Bottom line
Tata Motors delivered a strong volume quarter and a swing to profit, with a slightly lower margin and conflicting profit figures across sources. Iveco will make the next quarter hard to compare, so confirm the profit lines in the filing and ask for organic numbers then.
Next read: Mahindra and Mahindra Q2 results preview.
Part of the Earnings series.
PositionalCalls WhatsApp channel
Never miss a results-day update
- Same-day decoders for the biggest companies reporting
- Record dates and dividend amounts checked against filings
- Corrections posted openly when a number changes
Tata Motors Q2 results: frequently asked questions
When were the Tata Motors Q2 results announced?
Tata Motors Limited announced its Q2 FY27 results on Friday, 23 October 2026 for the quarter ended 30 September 2026. The board outcome was filed on BSE that day. The exact filing time is not confirmed in the sources I reviewed.
What was Tata Motors’ net profit in Q2 FY27?
Consolidated profit after tax was Rs 1,253 crore against a loss of Rs 867 crore a year ago. Other outlets show Rs 1,254 crore and Rs 1,257 crore. Confirm the profit line in the exchange filing before using it.
Is this Tata Motors Q2 results page about cars or trucks?
It covers commercial vehicles: trucks, buses and small commercial vehicles, under Tata Motors Limited (TMCV). Passenger cars and Jaguar Land Rover are in Tata Motors Passenger Vehicles, which reports separately.
What was Tata Motors’ revenue in Q2 FY27?
Consolidated revenue from operations was Rs 25,338 crore, up 36% from Rs 18,585 crore. Standalone revenue was Rs 23,930 crore, up 42%. Always check whether a page quotes the standalone or consolidated line.
What was the Tata Motors EBITDA margin in Q2 FY27?
Consolidated EBITDA was Rs 2,770 crore at a 10.9% margin, down from 11.3%. Standalone EBITDA was Rs 2,806 crore at 11.7%. Management cited steel and rubber costs in one earnings-call summary.
How many vehicles did Tata Motors sell in Q2 FY27?
Wholesales were 135,100 units, up 42%. Heavy trucks were 33,800, small commercial vehicles 44,000 and international 21,100, up 177%. International supplied about one-third of the unit growth on my calculation.
What is the status of the Tata Motors Iveco acquisition?
The offer at €14.40 a share drew provisional acceptances of 87.81% of capital by 26 October 2026. Reports after 30 October describe the initial settlement as completed. Iveco is not in the Q2 numbers.
Did Tata Motors declare a dividend with the Q2 results?
The reports I reviewed did not mention a dividend with the Q2 results. Dividends are announced through an exchange intimation, so check the NSE or BSE announcements page for any later declaration.
The shares closed at Rs 396 on 23 October 2026, down 4.41%, on results day and traded near Rs 388 on 27 October. I did not find a confirmed price after that date as of Wednesday, 4 November 2026, 5:30 PM IST.
When are Tata Motors Q3 FY27 results?
The company has not announced a date as of Wednesday, 4 November 2026, 5:30 PM IST. Large Indian companies usually report Q3 between late January and mid-February. Watch for the board meeting intimation on NSE and BSE.
Sources
- Tata Motors Limited Q2 FY27 results release (not opened in full; the page did not load for me)
- BSE board outcome filing of 23 October 2026 (summarised through a third-party page; not opened directly)
- Tata Motors commercial vehicles site
- Kotak Neo, 23 October 2026; The Week, 23 October 2026; Free Press Journal, 23 October 2026; Business Today, 27 October 2026; Univest, 26 October 2026; Arthneeti summaries; Investing.com, Multibagg and Angel One (secondary and AI-assisted, named not linked).
PositionalCalls.com is not a SEBI-registered research analyst or investment adviser. Investments in securities markets are subject to market risks. Read all related documents carefully before investing. Returns are never guaranteed. PositionalCalls is an independent Indian stock market research and education site founded by Shubham Chaudhary. This page is education and results analysis, not a recommendation to buy, sell or hold any security. How I researched this: I read press and data-platform reports of the results, cross-checked figures between them, recomputed every derived number, and listed conflicts openly. I have not opened the company release or the exchange filing directly.

Shubham Chaudhary is the founder of PositionalCalls, an independent Indian stock market research website. He writes company fundamentals, quarterly results analysis, IPO analysis and sector research for NSE and BSE listed companies, with a focus on banking stocks, insurance and long-term value investing. Every article is built from primary sources such as RBI, SEBI, NSE and BSE filings and company annual reports, and states its risks plainly in simple language for retail investors.
Coverage areas Our research standards- Numbers checked against NSE, BSE and SEBI filings
- Risks and limits stated in every article
- No paid promotions or broker tie-ups
- Articles updated when new filings arrive