
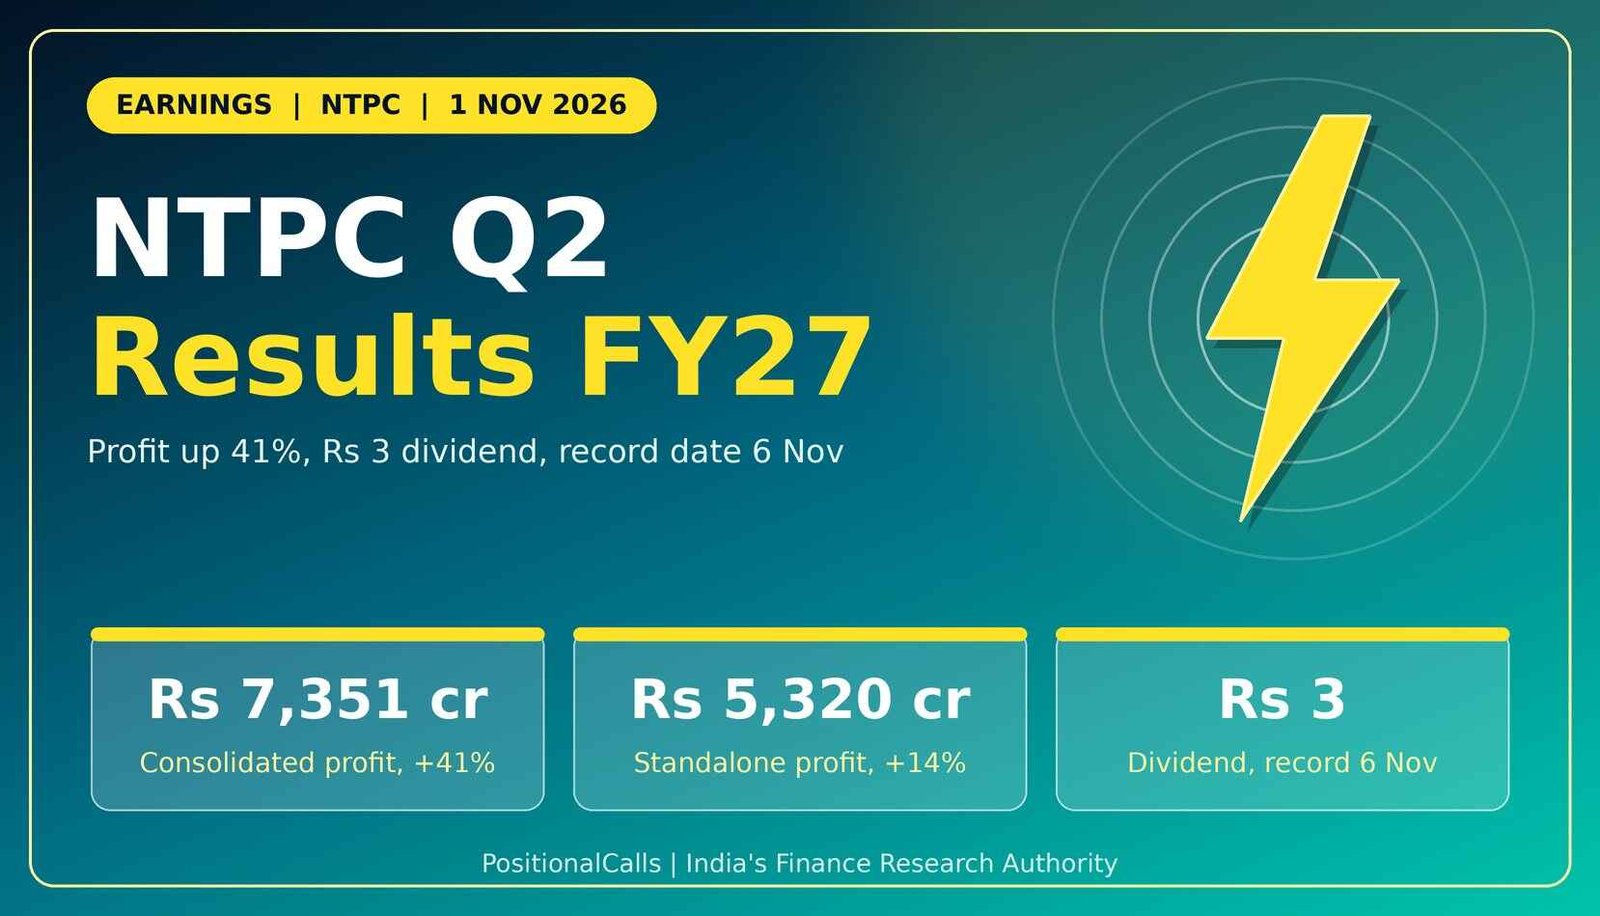
Earnings · NTPC
NTPC reported its September quarter on Saturday, 31 October 2026. Group profit jumped 41%, but the company on its own grew 14%. Here is why the two differ, which figure to quote, and what the Rs 3 dividend means in rupees.
Quick answer
NTPC Q2 results FY27 show consolidated net profit of Rs 7,351 crore, up 40.7%, on revenue of Rs 54,270 crore, up 21.2%. Standalone profit rose only 14.3% to Rs 5,320 crore. The board declared a Rs 3 interim dividend, record date Friday, 6 November 2026, so the last day to buy is Thursday, 5 November.
Latest update (1 November 2026, 5:30 PM IST): NTPC’s board approved the results on Saturday, 31 October 2026 and declared its first interim dividend for FY27 at 30%, Rs 3 a share, with payment to begin from 25 November 2026, as reported. Reports quote two different profit figures and two different year-ago bases.
Key takeaways
- Consolidated: net profit Rs 7,350.8 crore, up 40.7%; revenue from operations Rs 54,269.95 crore, up 21.2%.
- Standalone: net profit Rs 5,319.94 crore, up 14.3% from Rs 4,653.33 crore.
- Dividend: Rs 3 a share, 30% of face value, record date Friday, 6 November 2026.
- Why the gap: subsidiaries and joint ventures added about Rs 2,031 crore to group profit against about Rs 572 crore a year earlier (my calculation).
- Trap: the year-ago consolidated profit appears as Rs 5,225 crore and as Rs 5,066.78 crore.
In plain words: “Consolidated” adds NTPC’s subsidiaries and joint ventures to the parent; “standalone” is NTPC Limited alone. An interim dividend is paid during the year before the final one. The record date decides who receives it.
Data note: as of 1 November 2026, 5:30 PM IST. Figures follow NTPC’s results as carried by Upstox, Indian PSU, Indian Masterminds and Lapaas Voice on 31 October 2026, plus Business Standard for earlier periods; I have not opened the exchange filing. Standalone and consolidated numbers are labelled. Derived numbers are marked “my calculation”.
What did NTPC report in the Q2 results FY27?
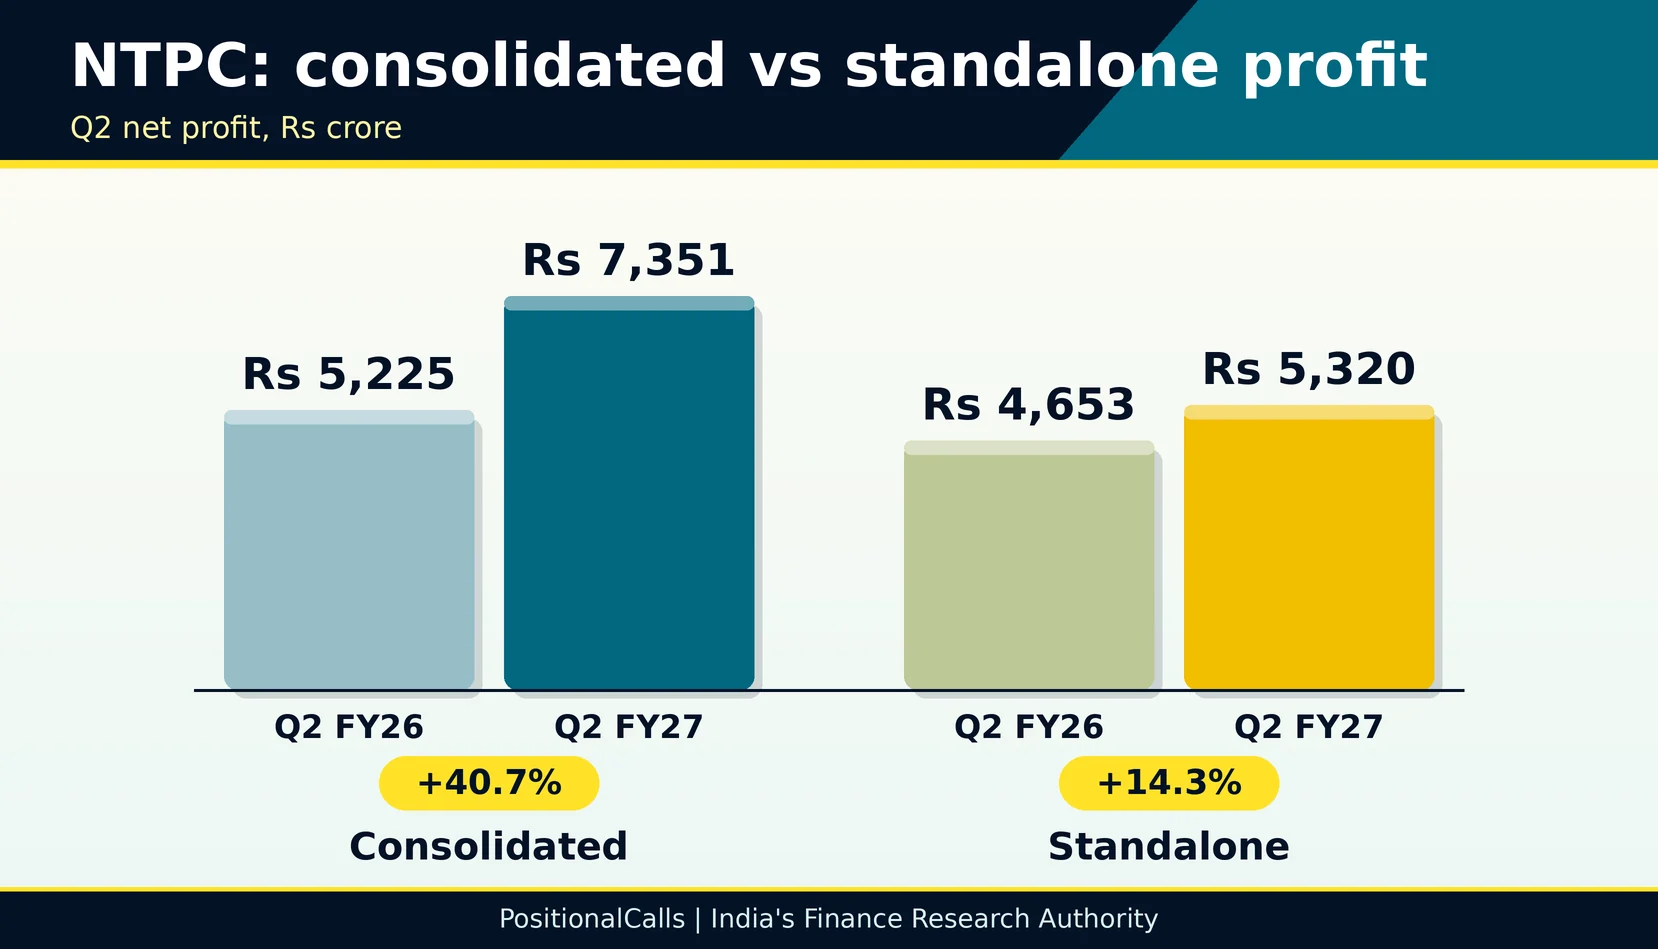
NTPC reported Q2 FY27 consolidated revenue from operations of Rs 54,269.95 crore, up 21.2%, and consolidated net profit of Rs 7,350.8 crore, up 40.7%, with standalone net profit of Rs 5,319.94 crore, up 14.3%.
| Rs crore | Q2 FY27 | Q2 FY26 | Change | Basis |
|---|---|---|---|---|
| Consolidated revenue from operations | 54,269.95 | 44,784.05 | +21.2% | Group |
| Consolidated net profit | 7,350.8 | about 5,225 | +40.7% | Group; base derived from the reported growth |
| Standalone net profit | 5,319.94 | 4,653.33 | +14.3% | NTPC Limited alone |
| Standalone revenue from operations | 45,752 | Q1 FY27 was 43,832; +4.4% sequentially (my calculation) | ||
| H1 FY27 standalone profit | 10,662 | 9,428 | +13.1% (my calculation) | Half year |
| H1 FY27 standalone revenue | 89,584 | Q1 plus Q2 reconciles |
Cite this table: PositionalCalls, “NTPC Q2 FY27 Results Table, as of 1 November 2026”.
Two numbers are easy to confuse: Rs 7,351 crore is the group, Rs 5,320 crore is NTPC Limited alone. Some headlines carry one and some the other, and both are correct for their scope. Revenue from other segments, a line one report mentions, rose 49.3% to Rs 7,349.32 crore from Rs 4,922.73 crore; the segment definition is not explained in the sources I saw.
Why did NTPC consolidated profit rise 41% when standalone rose only 14%?
Because subsidiaries and joint ventures contributed about Rs 2,031 crore to group profit this quarter against about Rs 572 crore a year ago, a rise of roughly 255% (my calculation); reports cite higher generation and improved operating efficiency.
| Rs crore | Q2 FY27 | Q2 FY26 | How derived |
|---|---|---|---|
| Consolidated net profit | 7,350.8 | 5,225 | Reported; base from the 40.68% growth |
| Standalone net profit | 5,319.94 | 4,653.33 | Reported |
| Gap: subsidiaries, JVs and other (my calculation) | about 2,031 | about 572 | Consolidated less standalone |
| Gap growth (my calculation) | +255% | 2,031 / 572 | |
| Standalone share of group profit (my calculation) | 72.4% | 89.1% | 5,320 / 7,351 and 4,653 / 5,225 |
Cite this table: PositionalCalls, “NTPC Consolidated Versus Standalone Table, as of 1 November 2026”.
A rise of about 255% in the gap is large. It could reflect the ramp-up of the green-energy subsidiary, higher profit from joint ventures or associates, or a one-off item. I could not confirm the reason from the sources I saw. One subsidiary, NTPC Green Energy, reported Q2 profit of Rs 137.5 crore, up 57%, as reported, which explains only a small part of Rs 2,031 crore. Read the filing’s segment and exceptional-item notes before treating 41% as the new run rate.
Which NTPC profit figure and base should you use? The definitions trap
Use consolidated Rs 7,350.8 crore against about Rs 5,225 crore for the 40.7% headline, and standalone Rs 5,319.94 crore against Rs 4,653.33 crore for 14.3%; one earlier summary shows the Q2 FY26 group profit as Rs 5,066.78 crore.
| Line | Figures in circulation | What it likely means | What to do |
|---|---|---|---|
| Q2 FY27 profit | Rs 7,351 crore; Rs 5,320 crore | Consolidated; standalone | Name the scope with the number |
| Q2 FY26 consolidated profit | Rs 5,225 crore; Rs 5,066.78 crore | Profit implied by 40.68% growth; a Business Standard summary (possibly a different line) | Use Rs 5,225 crore with 40.7%; check the filing |
| Q2 FY27 revenue | Rs 54,270 crore; Rs 45,752 crore | Consolidated; standalone | Compare like with like |
| Q1 FY27 “revenue” | Rs 43,832 crore | Standalone figure used for the sequential comparison | Do not compare with consolidated |
| Dividend | 30% of paid-up capital; Rs 3 per share | Same dividend, two expressions | Face value is Rs 10 |
| Net profit growth | +40.7%; +14.3%; +13.1% | Consolidated Q2; standalone Q2; standalone H1 | Quarter versus half year |
Cite this table: PositionalCalls, “NTPC Definitions Table, as of 1 November 2026”.
The base difference matters. If the year-ago consolidated profit were Rs 5,066.78 crore, the growth would be about 45.1% (my calculation: 7,350.8 / 5,066.78). The company-linked 40.68% implies Rs 5,225 crore, so the Business Standard line probably measures something slightly different. Always quote the growth rate with its base.
What dividend did NTPC declare, and what is the record date?
NTPC declared a first interim dividend of Rs 3 per share, 30% of the Rs 10 face value, with record date Friday, 6 November 2026 and payment from 25 November 2026, as reported.
| Announced | Type and year | Per share | Record or payment |
|---|---|---|---|
| 31 Oct 2026 | First interim, FY27 | Rs 3.00 | Record Fri, 6 Nov 2026; payment from 25 Nov 2026 |
| Jan 2026 | Second interim, FY26 (call summary) | Rs 2.75 | Not captured |
| May 2025 | Final, FY25 | Rs 3.35 | Record 4 Sep 2025; payment on or after 25 Sep 2025 |
| 29 Jan 2024 | Second interim, FY24 | Rs 2.25 | Payment 22 Feb 2024 |
| 28 Oct 2023 | First interim, FY24 | Rs 2.25 | Payment 23 Nov 2023 |
Cite this table: PositionalCalls, “NTPC Dividend History Table, as of 1 November 2026”.
Rs 3 is 9.1% above the Rs 2.75 second interim of FY26 (my calculation). I did not verify the amount of the first interim of FY26, so I do not compare with it. The earlier rows come from Business Standard and a call summary and are shown as reported.
Under T+1 the ex-date equals the record date, so you must own the shares by the close of Thursday, 5 November 2026; a purchase on Friday, 6 November does not qualify.
- Buy by Thursday, 5 November 2026: the last trading day before the record date.
- Hold on Friday, 6 November 2026: the record date and ex-date are the same under T+1.
- Expect payment from 25 November 2026: as reported; confirm in the filing.
- Keep the contract note: you need it for tax records and any TDS credit.
What is the Rs 3 NTPC dividend worth in rupees?
100 shares receive Rs 300, 1,000 shares Rs 3,000 and 5,000 shares Rs 15,000 before tax; at 3,500 shares or more the payout passes Rs 10,000 and may attract TDS (my calculations).
| Shares held | Dividend at Rs 3 | At the earlier Rs 2.75 | TDS if applicable (10%) |
|---|---|---|---|
| 100 | Rs 300 | Rs 275 | none |
| 1,000 | Rs 3,000 | Rs 2,750 | none |
| 3,500 | Rs 10,500 | Rs 9,625 | Rs 1,050 |
| 5,000 | Rs 15,000 | Rs 13,750 | Rs 1,500 |
Cite this table: PositionalCalls, “NTPC Dividend Rupee Table, as of 1 November 2026”.
TDS under Section 194 is generally 10% for residents when dividends from one company exceed Rs 10,000 in a financial year. The threshold applies to the year’s total from NTPC, not one payout, so earlier dividends count. Confirm the current rule; see our guide to tax on shares and dividend TDS. Dividends are also taxable at your slab rate. NRI investors should read NRI investment in the Indian stock market.
Was there an analyst estimate for NTPC Q2 FY27?
No Q2 FY27 profit or revenue estimate was found as of 1 November 2026, so the comparison here is with the year-ago quarter, not a consensus.
I searched for brokerage previews and found none for NTPC’s Q2 FY27, so I do not quote one. A power utility’s profit is also driven by regulated returns and generation volumes, so year-on-year change is a fairer test than a single analyst figure. If a preview or post-result note appears, this page will show its source, date and base, and say whether it uses consolidated or standalone profit.
What do the half-year numbers show?
H1 FY27 standalone profit was Rs 10,662 crore, up 13.1% from Rs 9,428 crore, and standalone revenue from operations was Rs 89,584 crore, which reconciles with Q1 at Rs 43,832 crore plus Q2 at Rs 45,752 crore.
| Standalone, Rs crore | H1 FY27 | H1 FY26 | Check (my calculation) |
|---|---|---|---|
| Net profit | 10,662 | 9,428 | +13.1% |
| Q2 FY27 net profit | 5,319.94 | 4,653.33 | +14.3% |
| Implied Q1 FY27 net profit | about 5,342 | about 4,775 | 10,662 less 5,320; 9,428 less 4,653 |
| Revenue from operations | 89,584 | 43,832 + 45,752 |
Cite this table: PositionalCalls, “NTPC H1 FY27 Standalone Table, as of 1 November 2026”.
The implied Q1 FY27 standalone profit of about Rs 5,342 crore is my back-calculation from the half-year and Q2 figures, so Q2 is about 0.4% below Q1 on the standalone line (5,319.94 / 5,342). That is consistent with a steady business, not a surge: the large growth came from the group lines outside the parent.
PositionalCalls WhatsApp channel
NTPC and PSU dividends, in plain words
- Record-date reminders with the T+1 buy-by day
- Standalone and consolidated figures kept apart
- Plain-language summaries of each filing
How have NTPC group profits moved across recent quarters?
Group profit was Rs 6,108.46 crore in Q1 FY26, about Rs 5,225 crore in Q2 FY26 and Rs 7,350.8 crore in Q2 FY27 (as reported and derived).
| Quarter | Consolidated net profit (Rs crore) | Source note |
|---|---|---|
| Q1 FY26 (Jun 2025) | 6,108.46 | PTI, 29 July 2025; +11% YoY |
| Q2 FY26 (Sep 2025) | about 5,225 (or 5,066.78) | Derived from +40.68%; Business Standard summary |
| Q2 FY27 (Sep 2026) | 7,350.8 | Reported, 31 October 2026 |
Cite this table: PositionalCalls, “NTPC Group Profit Run Table, as of 1 November 2026”.
The September 2025 quarter was lower than the June 2025 quarter, so Q2 FY27 benefits from a low year-ago base as well as higher generation. Reports describe the Q2 FY27 rise as driven by higher generation and operating efficiency. I did not find generation figures, plant load factor or tariff data in the sources I saw, so I do not quote them.
How does this September quarter compare with earlier years?
NTPC’s September-quarter group profit grew from Rs 3,417.67 crore in 2022 to Rs 7,350.8 crore in 2026, about 15.9% a year over the last three years (my calculation).
| September quarter | Consolidated net profit (Rs crore) | Source note |
|---|---|---|
| Q2 FY23 (Sep 2022) | 3,417.67 | Business Standard, 28 Oct 2023 |
| Q2 FY24 (Sep 2023) | 4,726.40 | Business Standard; +38% YoY |
| Q2 FY25 (Sep 2024) | not captured | |
| Q2 FY26 (Sep 2025) | about 5,225 (or 5,066.78) | Derived; Business Standard summary |
| Q2 FY27 (Sep 2026) | 7,350.8 | Reported, 31 October 2026 |
Cite this table: PositionalCalls, “NTPC September-Quarter Profit History, as of 1 November 2026”.
From Q2 FY24 to Q2 FY27 the group profit rose by a factor of 1.56, which works out to about 15.9% a year (7,350.8 / 4,726.4 over three years, my calculation). The 40.7% rise in Q2 FY27 is therefore well above the long-run pace. That does not make it wrong, but it does mean the last year saw something unusual in the group lines, which is why the filing notes matter.
What should you check in the NTPC filing?
Read the standalone profit first, then the segment and subsidiary notes, then any exceptional items, then the dividend notice, because reports are thin on each.
| What to read | Reported mark | Question to ask |
|---|---|---|
| Standalone net profit | Rs 5,319.94 crore, +14.3% | Is this the parent’s underlying trend? |
| Consolidated net profit | Rs 7,350.8 crore, +40.7% | What drove the extra Rs 2,031 crore? |
| Share of profit from subsidiaries and JVs | About Rs 2,031 crore vs Rs 572 crore | One-off or recurring? |
| Exceptional items and deferred tax | Not seen | Any one-off in the notes? |
| Generation and plant load factor | Not seen | Did volumes rise? |
| Dividend notice | Rs 3; record 6 Nov; payment from 25 Nov | Do the filing and exchange notice match? |
Cite this table: PositionalCalls, “NTPC Filing Checklist, as of 1 November 2026”.
Which power and PSU results are near NTPC’s?
Coal India, Reliance and the ONGC preview give energy-sector context, and Coal India shares the 4 November record date.
| Company | Status | Our page |
|---|---|---|
| NTPC | Reported 31 Oct 2026 | This page |
| Coal India | Reported 29 Oct 2026; record date 4 Nov 2026 | Coal India Q2 results FY27 |
| Reliance | Reported 30 Oct 2026 | Reliance Q2 results FY27 |
| ONGC | Board meeting Thu, 5 Nov 2026 (preview) | ONGC Q2 results FY27 |
| NTPC earlier quarter | Earlier quarter | NTPC Q3 results |
For more energy coverage see the energy category, and all dates are on the Q2 results calendar hub.
What do most people miss about the NTPC Q2 results FY27?
Most miss that the 41% figure is the group, that standalone grew only 14%, and that the gap comes from outside the parent.
- Name the scope, consolidated or standalone, with every number.
- Quote growth with its base: 5,225 crore or 5,066.78 crore.
- Check the subsidiary and joint-venture contribution in the notes.
- Buy by 5 November 2026 if you want the dividend.
- Confirm the dividend and payment date in the exchange filing.
What do you need to know about costs, tax and safety?
Trading costs and your holding period matter more than one quarter’s headline; never pay anyone for results alerts or tips.
- What you need: shares in your demat account by 5 November 2026; settlement is T+1.
- Costs: check your broker’s current charge schedule; the dividend itself carries no brokerage.
- Tax angle: dividends are taxed at your slab rate; see the rupee table and the linked tax guide, and ask a tax adviser if unsure.
- NRI note: withholding on dividends to non-residents is generally higher and may be reduced under a treaty; see the NRI guide linked above.
- Scam warning: fake results alerts, paid “dividend capture” tips and KYC links on messaging apps are common. Never share an OTP.
Analyst’s note
- What stands out: in the NTPC Q2 results FY27, the parent grew a steady 14% while the group grew 41%, so the story sits in the subsidiaries and joint ventures.
- Easy to miss: the extra Rs 2,031 crore outside the parent is nearly four times last year’s Rs 572 crore, which makes the 41% headline sensitive to one-offs.
- What would change the view: a repeat of the gap next quarter would show a new level; a fall back to about Rs 600 crore would show a one-off.
- Caution: this is reasoning from reported numbers, not a forecast. No outcome is assured.
- Reader action: read the segment note, name the scope and buy by 5 November if you want the dividend.
Bottom line
NTPC Q2 results FY27: consolidated profit Rs 7,351 crore (+40.7%), standalone Rs 5,320 crore (+14.3%), revenue Rs 54,270 crore (+21.2%) and a Rs 3 dividend with record date 6 November 2026. The gap between the two profit lines is the story. Confirm the figures and the dividend in the filing.
Next read: Coal India Q2 results FY27: results and Rs 10.25 dividend
Part of the PSU earnings series. The earlier quarter is covered on the NTPC Q3 results page.
PositionalCalls WhatsApp channel
PSU results, without the noise
- NTPC, Coal India and peers side by side
- Dividend dates the moment they are filed
- Corrections flagged as numbers change
Frequently asked questions
What are the NTPC Q2 results FY27?
NTPC reported consolidated net profit of Rs 7,350.8 crore (+40.7%) on revenue of Rs 54,269.95 crore (+21.2%), and standalone net profit of Rs 5,319.94 crore (+14.3%), on 31 October 2026, with a Rs 3 interim dividend.
How much dividend did NTPC declare with the Q2 results FY27?
The board declared a first interim dividend of Rs 3 a share, 30% of the Rs 10 face value, for FY27. The record date is Friday, 6 November 2026 and payment is to begin from 25 November 2026, as reported.
What is the NTPC dividend record date?
The record date is Friday, 6 November 2026. Under T+1 you must own the shares by the close of Thursday, 5 November 2026. Confirm the payment date in the exchange filing.
Why is NTPC consolidated profit growth higher than standalone?
Group profit rose 40.7% while standalone rose 14.3%. Subsidiaries, joint ventures and other items added about Rs 2,031 crore against about Rs 572 crore a year earlier (my calculation). The notes explain the drivers.
What was NTPC standalone profit in Q2 FY27?
Standalone net profit was Rs 5,319.94 crore, up 14.3% from Rs 4,653.33 crore. H1 FY27 standalone profit was Rs 10,662 crore against Rs 9,428 crore, up 13.1% (my calculation).
What is the NTPC Q2 FY26 consolidated profit base?
About Rs 5,225 crore, implied by the 40.68% growth. A Business Standard summary shows Rs 5,066.78 crore, which would give about 45.1% growth. Check the filing for the exact line.
At Rs 3 a share, 1,000 shares receive Rs 3,000 before tax. TDS of 10% may apply for residents when dividends from NTPC exceed Rs 10,000 in the year, so check current rules or ask a tax adviser.
Was there an analyst estimate for NTPC Q2 profit?
No estimate was found as of 1 November 2026. Compare with the year-ago quarter instead, and note whether the figure is consolidated or standalone. This page will show an estimate with its source if one appears.
How does the NTPC dividend compare with earlier payouts?
Rs 3 is about 9.1% above the Rs 2.75 second interim of FY26 (my calculation), and above the Rs 3.35 final of FY25 only if you ignore that final is a different payout. Earlier rows are shown as reported.
Where do I check the official NTPC results?
Open the NSE or BSE announcements for NTPC or the investor page at ntpc.co.in. News reports mix standalone and consolidated figures, so use the filing as the final source.
Sources
- NTPC Limited results announcement and board outcome, 31 October 2026 (NSE and BSE)
- Upstox, Indian PSU, Indian Masterminds and Lapaas Voice results reports, 31 October 2026 (secondary, not linked)
- Business Standard and PTI reports on NTPC’s earlier results and dividends (secondary, not linked)
Editorial disclosure. PositionalCalls.com is not a SEBI-registered research analyst or investment adviser. Investments in securities markets are subject to market risks. Read all related documents carefully before investing. Returns are never guaranteed. This page is educational, is independent and was written by Shubham Chaudhary, founder of PositionalCalls. How I researched this: I compared results reports of the company filing with earlier-quarter reports, recomputed every derived number and labelled conflicting figures. Corrections are published in the Data note.

Shubham Chaudhary is the founder of PositionalCalls, an independent Indian stock market research website. He writes company fundamentals, quarterly results analysis, IPO analysis and sector research for NSE and BSE listed companies, with a focus on banking stocks, insurance and long-term value investing. Every article is built from primary sources such as RBI, SEBI, NSE and BSE filings and company annual reports, and states its risks plainly in simple language for retail investors.
Coverage areas Our research standards- Numbers checked against NSE, BSE and SEBI filings
- Risks and limits stated in every article
- No paid promotions or broker tie-ups
- Articles updated when new filings arrive